

- Market Size (2026)
- USD 166.4 Mn
- Forecast (2036)
- USD 498.6 Mn
- CAGR (2026 to 2036)
- 11.6%
How big is Color Development Additives Market in 2026?
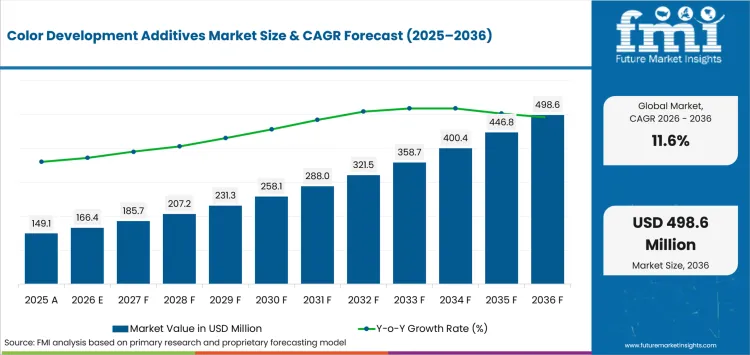
USD 166.4 million in 2026 and USD 498.6 million by 2036 at an 11.6% CAGR.
Demand for color development additives is projected to expand at 11.6% CAGR between 2026 and 2036, increasing valuation from USD 166.4 million to USD 498.6 million. Growers purchase these inputs when heat or nutrient stress threatens color-linked pack-out and grade acceptance. Acadian Plant Health launched its Abiotic Stress Management portfolio in February 2025 after field testing stress-focused biological inputs. That investment reinforces the role of plant biostimulants in protecting natural quality before harvest during commercial field qualification. The market is expected to add USD 332.2 million in value during the 2026 to 2036 forecast period.
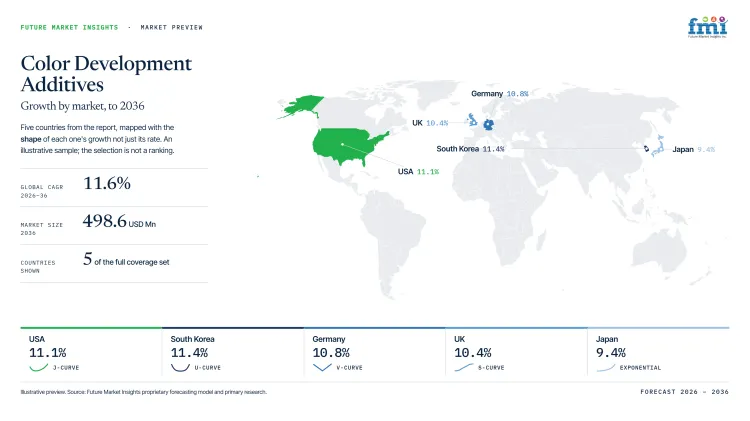
Country growth diverges most in markets where farm data can shorten local qualification for crop-quality inputs. South Korea carries the highest profiled CAGR at 11.4%, placing it clearly ahead of Japan at 9.4%. MAFRA’s February 2025 master plan targets smart farming on 35% of the country’s 55,000 greenhouse hectares. The planned verification network makes precision agriculture more useful for proving repeatable field performance before regular purchasing.
Key Takeaways of Color Development Additives Market
- Demand rises as growers protect harvest color and marketable quality without disrupting existing crop-nutrition schedules or application windows.
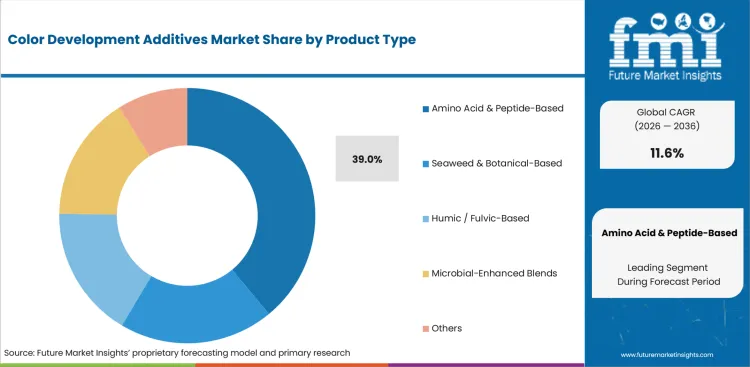
- Amino acid & peptide-based products are projected to hold 39.0% of product type demand in 2026 due to metabolic relevance in targeted quality programs.
- Cereals & grains are estimated to represent 41.4% of crop type demand in 2026 owing to broad acreage and repeatable field protocols.
- Soil application is forecast to capture 39.7% of application method demand in 2026 as root-zone programs fit routine nutrient-management schedules.
- Variable crop response and claim-dependent regulatory treatment lengthen qualification, especially where color outcomes change with cultivar or weather conditions.
- Some of the key players in this market include Kimitec, Plant Health Care (PI Industries), COMPO EXPERT, Syngenta Biologicals (Valagro), UPL NPP, Rovensa Next, Hello Nature, and Acadian Plant Health.
Analyst Perspective
"Color-development additives earn repeat orders after local trials separate treatment effects from weather and cultivar variation. Commercial value depends on disciplined claims plus application timing that agronomists can reproduce within existing fertility or spray programs."
- Nikhil Kaitwade, Principal Consultant, Future Market Insights
How is the Color Development Additives Market segmented?
The market is segmented by product type, crop type, application method, farm type and sales channel.
The color development additives market is segmented by product type, crop type, application method, farm type and sales channel. Product types include amino acid & peptide-based, seaweed & botanical-based, humic / fulvic-based, microbial-enhanced blends and others. Crop types include cereals & grains, fruits & vegetables, oilseeds & pulses, turf & ornamentals and others. Application methods cover soil, foliar, fertigation / drip, seed and others. Farm types comprise large commercial farms, mid-size farms, smallholders, greenhouses & nurseries and others. Sales channels include agri-input distributors, cooperatives, agri-retail chains, online / direct-to-farm and others.
What makes Amino Acid & Peptide-Based products central to the Product Type category?
Color programs require timing discipline because selected amino acids participate in pigment-related plant metabolism during ripening. The Science Societies noted in May 2026 that phenylalanine can be applied 2-4 weeks before harvest to improve red color in selected fruit crops. That timing places amino-acid inputs beside seaweed extracts and humic and fulvic biostimulants during product evaluation.
- Amino acid & peptide-based products are projected to account for 39.0% of product type demand in 2026, supported by targeted metabolic use and formulation flexibility.
- Agronomists can place peptide-based inputs within existing foliar or root-zone programs, which lowers operational disruption during crop-specific trial work under variable ripening weather.
Why do Cereals & Grains lead the Crop Type category?
Cereals & grains offer enough acreage for strip trials and repeated protocols to test whether an additive protects crop performance under stress. USDA estimated record 2025 corn production at 17.0 billion bushels, giving microbial biofertilizers and other biological programs a large validation base for repeat field comparisons.
- Cereals & grains are estimated to hold 41.4% of crop type demand in 2026, as standard field equipment supports repeatable treatment at commercial acreage.
- Farm managers compare treated strips against local yield and quality records, so repeat use depends on measurable gains instead of cosmetic color claims before wider acreage commitment.
How does Soil Application shape the Application method category?
Soil application places additives in root-zone programs that influence nutrient access before visible quality traits develop later in the crop cycle. In February 2025, Syngenta and Ceres Biotics signed a global VIXERAN agreement for a biostimulant designed to access nitrogen through leaves and roots. The agreement gives soil programs a current biological route alongside seaweed extracts in fertility plans.
- Soil application is expected to lead method demand at 39.7% in 2026, because root-zone programs fit scheduled nutrient management.
- Growers can evaluate soil treatments beside controlled-release nutrition without requiring an extra late-season pass, which simplifies trial execution on broadacre farms within routine operating schedules.
What supports Large Commercial Farms within the Farm Type category?
Large commercial farms can reserve treated and untreated blocks while using field records to compare harvest outcomes over acreage. USDA ERS reported in February 2026 that large-scale family farms represented 5% of farms but 50% of production value and 33% of acres. That scale gives controlled-release nutrition trials enough field area for repeated crop-quality comparisons.
- Large commercial farms are forecast to represent 36.8% of farm type demand in 2026, driven by acreage that supports structured trials and standardized purchasing.
- Managers can extend a successful protocol to several fields after local evidence clears the internal return threshold, improving the economics of repeat adoption.
What are the drivers, restraints and opportunities in the Color Development Additives Market?
Harvest-quality economics increase demand, variable efficacy and regulation slow qualification, and better farm-data protocols offer the clearest route to repeat orders.
- Driver: Growers seek treatments that protect natural color and marketable quality during heat, water stress or nutrient imbalance.
- Restraint: Variable biological response and evolving product rules increase the evidence burden before a formulation earns regular use.
- Opportunity: Digital trial records can shorten qualification by linking application timing with crop-quality results under local production conditions.
Color quality directly affects whether fruit reaches a premium grade or loses commercial value at harvest. Defra’s June 2026 horticulture statistics show Gala apple yields increased 20% in 2025 while fruit color was exceptionally good. The contrast explains why plant activators and metabolic inputs must prove crop-specific responses under commercial harvest conditions instead of relying on a generic stress claim.
Novel materials raise selling costs by requiring additional evidence during registration and distributor onboarding before a manufacturer can use harmonized claims. EBIC’s April 2025 position paper states that CMC 7 permits only four microorganism types in microbial plant biostimulants under the EU Fertilising Products Regulation. Companies therefore need fertilizer programs with claim language that matches the legal route in each intended market.
Farm data offers a practical route to convert biological trials into repeat purchasing provided the recorded outcome matches a defined quality objective. MAFRA announced in May 2026 that sixteen government GPUs would analyse crop-growth images for smart-agriculture development. Biological crop nutrition companies can pair those records with specialty fertilizers to sharpen application protocols and reduce uncertainty during local commercial validation.
Which country CAGRs are profiled in the Color Development Additives Market?
| Country | CAGR |
|---|---|
| South Korea | 11.4% |
| USA | 11.1% |
| Germany | 10.8% |
| UK | 10.4% |
| Japan | 9.4% |
How do country-level CAGRs compare in the Color Development Additives Market?
The 2.0-percentage-point spread puts South Korea and the USA at the upper end, with Japan at the lower endpoint. Germany and the UK occupy the middle. Regulation, validation cost and channel execution can outweigh modest CAGR differences during launch sequencing, particularly where local proof requirements slow order conversion.
- South Korea's smart-farm verification network gives biological-input trials a stronger measurement route.
- Federal definition debates keep claims discipline central to USA commercialization decisions.
- EU conformity requirements increase German distributors' evidence burden during product qualification.
- UK regulatory redesign keeps conformity planning active for fertilising-product launches.
- Broader farm-data use gives Japanese agronomists stronger records for local protocol design.
Similar CAGRs can yield different launch economics because qualification cost and technical channel strength vary by country. The full report provides country-level CAGR analysis across North America, Latin America, Europe, East Asia, South Asia, Oceania and the Middle East and Africa.
Country-wise Analysis
- South Korean greenhouse operators increasingly work with sensor records and public smart-farming agencies, giving crop-input trials a clearer measurement route. Color development additive demand is forecast to rise at 11.4% CAGR from 2026 to 2036, reinforced by stronger national smart-farming support. MAFRA designated two national agencies as smart-farming support centres in June 2025 for training and data analysis. Digital records shorten the proof cycle by giving agronomists comparable field results for fruit-quality programs. Local distributors still need crop-specific timing and agronomy because narrow seasonal windows leave little room to repeat weak trials. Suppliers that turn sensor records into simple treatment decisions are positioned to convert Korean validation work into orders.
- USA crop-input sales run through national brands and regional distributors, with direct farm relationships also requiring state-aware label review before wider placement. H.R.3783 was introduced on June 5 2025 to establish a consistent federal definition for plant biostimulants, and Congress.gov lists the bill at Introduced status. Demand is projected to advance at 11.1% CAGR from 2026 to 2036, shaped by a large testing base and strict claims discipline. Regional distributors need field evidence showing that a treatment improves marketable crop quality under local weather patterns before they widen placement. State-ready labels and repeatable specialty-crop trials give companies a clearer route to national commercial expansion.
- German fruit programs pair technically trained distribution with EU conformity requirements, so agronomic evidence must survive field scrutiny and formal product positioning. Germany is estimated to post 10.8% CAGR over the forecast period, attributable to its quality-sensitive orchard base. Destatis recorded 1.138 million tonnes of apples in 2025 in its December 2025 harvest release. Visible quality matters most for fruit entering fresh channels, yet manufacturers must prove incremental performance inside tightly controlled crop-input budgets. German-language protocols and distributor training remain necessary because orchard managers expect application guidance that fits familiar seasonal routines. Documented treatment timing and quality outcomes let suppliers compete without asking growers to alter proven orchard programs.
- UK manufacturers and distributors are preparing for a redesigned fertilising-products regime, making regulatory planning part of product-entry work instead of a distant policy issue. Defra opened a UK-wide fertiliser reform consultation in March 2026 covering conformity assessment and newer fertilising products, including evidence needs for plant biostimulants. Color development additive sales are forecast to expand at 10.4% CAGR through 2036, aided by interest in novel inputs but limited by the cost of UK-specific efficacy records. Distributors will hesitate to commit training resources and seasonal inventory until claim boundaries become clearer under the framework. Adaptable dossiers are expected to improve entry readiness once the revised conformity route takes effect.
- Japanese commercial farms place strong weight on localized agronomy and documented operating records, especially for biological inputs entering cooperative or distributor programs. Adoption of color development additives in Japan is estimated to expand at 9.4% CAGR through 2036, tied to data-enabled management despite a shrinking core farm workforce. MAFF’s November 2025 census release found that 40.0% of farm businesses used agricultural data, giving technical programs a stronger measurement base for treatment comparisons. Local adoption depends on Japanese protocols and crop-specific proof that fits cooperative advice and familiar production schedules. Localized trial packages have an advantage over global claims alone because cooperative advisers need repeatable field results.
Who are the notable companies in the Color Development Additives Market?
Kimitec, Plant Health Care (PI Industries), COMPO EXPERT, Syngenta Biologicals (Valagro), UPL NPP, Rovensa Next, Hello Nature, and Acadian Plant Health are the notable companies serving this market.
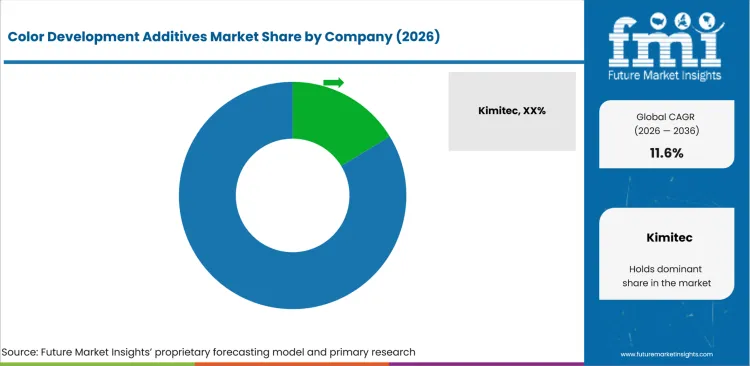
Competition is fragmented among peptide specialists, crop-nutrition groups and marine-biological businesses that use different validation routes before a quality claim reaches growers. Rovensa Next and Acadian Plant Health draw on seaweed feedstocks, while Kimitec and Plant Health Care emphasize natural molecules or peptide platforms. Entry therefore depends on evidence depth and channel agronomy more than corporate scale alone during commercial qualification.
- Kimitec and Plant Health Care (PI Industries) pair targeted molecule and peptide platforms with biological discovery and field validation.
- COMPO EXPERT, Syngenta Biologicals (Valagro), UPL NPP and Rovensa Next operate broad bionutrition platforms with multi-crop commercialization infrastructure.
- Hello Nature and Acadian Plant Health focus their natural-input platforms on vegetal peptides or marine-derived biological technologies.
Competitive Benchmarking: Color Development Additives Market
| Company | Quality-Trait Focus | Validation Infrastructure | 2025-2026 Action Depth | Geographic Reach |
|---|---|---|---|---|
| Kimitec | Medium | High | Low | Europe, Latin America and partner-led global markets |
| Plant Health Care (PI Industries) | Medium | High | Medium | Americas, Europe and selected Asian markets |
| COMPO EXPERT | High | Medium | Medium | Europe, Asia-Pacific, Americas and Africa |
| Syngenta Biologicals (Valagro) | Medium | High | High | Global |
| UPL NPP | Medium | High | Medium | Global |
| Rovensa Next | High | High | High | More than 90 countries |
| Hello Nature | Medium | Medium | Medium | 80 countries with international production and sales |
| Acadian Plant Health | Medium | High | Medium | Global through direct and distribution partnerships |
Scoring basis: High quality-trait focus requires explicit current evidence for fruit color or defined harvest-quality outcomes. Medium covers documented crop-quality or stress outcomes, while Low covers broader biological performance without a defined quality trait. High validation infrastructure requires multiple controlled research or field-validation routes, Medium requires one company-controlled route, and Low denotes partner-led validation. High action depth requires at least three qualifying 2025-2026 official actions, Medium requires two, and Low requires one documented action.
Key Developments in the Color Development Additives Market
- In December 2025, Rovensa Next launched Myndra in Europe as a seaweed-based biostimulant for fruit-quality traits in woody perennial crops.
- In June 2025, Hello Nature began expanding its Italian biostimulant facility to double production capacity after sustained growth in vegetal-peptide technologies.
- In February 2025, Syngenta Biologicals started its new world-scale biologicals production facility in Orangeburg, South Carolina to serve North and Latin American demand.
Key Players in the Color Development Additives Market
Targeted Molecule and Peptide Platforms
- Kimitec
- Plant Health Care (PI Industries)
Integrated Bionutrition Platforms
- COMPO EXPERT
- Syngenta Biologicals (Valagro)
- UPL NPP
- Rovensa Next
Specialist Natural-Input Platforms
- Hello Nature
- Acadian Plant Health
Color Development Additives Market - Report Scope
| Coverage field | Report scope |
|---|---|
| Market breakdown | By product type, crop type, application method, farm type, sales channel and region. |
| Quantitative Units | USD Million. |
| Market Definition | Commercial additives sold to support natural crop color development or associated pre-harvest quality traits within the defined biological and bionutrition scope. |
| Regions Covered | North America, Latin America, Europe, East Asia, South Asia and Pacific, and Middle East and Africa. |
| Countries Covered | South Korea, USA, Germany, UK, Japan, and 20+ countries included in the full report. |
| Key Companies Profiled | Kimitec, Plant Health Care (PI Industries), COMPO EXPERT, Syngenta Biologicals (Valagro), UPL NPP, Rovensa Next, Hello Nature, and Acadian Plant Health. |
| Forecast Period | 2026 to 2036. |
| Approach | Primary and secondary research with market triangulation. |
Color Development Additives Market - Research Methodology
| Method | Approach |
|---|---|
| Primary Research | FMI analysts gathered input from manufacturers, service providers, technology developers, distributors, end users, procurement teams, and subject-matter experts. Interviews examined purchasing decisions, product or service evaluation, adoption barriers, approval requirements, pricing considerations, and expectations for technical or commercial support. Respondents were also asked what evidence is required before a trial, pilot, or initial order develops into regular purchasing. |
| Desk Research | Desk research covered government statistics, regulatory publications, trade data, industry associations, technical literature, standards, company filings, product information, and official corporate announcements. Sources were reviewed for relevance, publication date, geographic coverage, and consistency with the defined market scope. Claims relating to performance, applications, approvals, capacity, investment, and commercial activity were retained only when supported by credible public evidence. |
| Market Sizing and Forecasting | The market model combined the baseline value with historical performance, segment structure, pricing and volume indicators, adoption levels, company participation, and country-level demand conditions. Forecast assumptions considered economic activity, investment trends, regulatory developments, technology adoption, purchasing cycles, supply availability, and barriers to wider market use. Segment and regional estimates were reconciled before the final market total was calculated. |
| Data Validation | Estimates were checked against multiple independent indicators, including public data, company activity, trade patterns, industry developments, and findings from primary interviews. Validation also tested whether products, services, applications, and company revenues fell within the defined market boundaries. Adjacent categories, unsupported claims, overlapping revenues, and activities without direct market relevance were excluded to reduce double counting and maintain consistency across segments and countries. |
Color Development Additives Market by Segments
Color Development Additives Market segmented by Product Type:
- Amino Acid & Peptide-Based
- Seaweed & Botanical-Based
- Humic / Fulvic-Based
- Microbial-Enhanced Blends
- Others
Color Development Additives Market segmented by Crop Type:
- Cereals & Grains
- Fruits & Vegetables
- Oilseeds & Pulses
- Turf & Ornamentals
- Others
Color Development Additives Market segmented by Application Method:
- Soil Application
- Foliar Application
- Fertigation / Drip
- Seed Application
- Others
Color Development Additives Market segmented by Farm Type:
- Large Commercial Farms
- Mid-Size Farms
- Smallholders
- Greenhouses & Nurseries
- Others
Color Development Additives Market segmented by Sales Channel:
- Agri-Input Distributors
- Cooperatives
- Agri-Retail Chains
- Online / Direct-to-Farm
- Others
Color Development Additives Market by Region:
- North America
- United States
- Canada
- Latin America
- Brazil
- Mexico
- Chile
- Rest of Latin America
- Western Europe
- Germany
- United Kingdom
- Italy
- Spain
- France
- Nordics
- Benelux
- Rest of Western Europe
- Eastern Europe
- Russia
- Poland
- Hungary
- Balkan and Baltic States
- Rest of Eastern Europe
- East Asia
- China
- Japan
- South Korea
- South Asia and Pacific
- India
- ASEAN
- Australia and New Zealand
- Rest of South Asia and Pacific
- Middle East and Africa
- Kingdom of Saudi Arabia
- Other GCC Countries
- Türkiye
- South Africa
- Other African Union Countries
- Rest of Middle East and Africa
Research Sources and Bibliography
- Acadian Plant Health. (2025, February 18). Acadian Plant Health™ sets new standard for crop resilience with Abiotic Stress Management portfolio.
- Ministry of Agriculture, Food and Rural Affairs. (2025, February 27). S. Korea’s First Master Plan for Promotion of the Growth of the Smart-Farming Industry for the Years 2025-2029.
- Science Societies. (2026, May 11). Coloring in crop management.
- USA Department of Agriculture, National Agricultural Statistics Service. (2026, January 12). Crop Production 2025 Summary.
- Syngenta. (2025, February 20). Sustainability in agriculture gets a boost with global biologicals partnership.
- USA Department of Agriculture, Economic Research Service. (2026, February 10). America's Farms and Ranches at a Glance: 2025 Edition.
- Department for Environment, Food & Rural Affairs. (2026, June 25). Horticulture statistics 2025.
- European Biostimulants Industry Council. (2025, April 30). Simplifying EU Rules to Support Innovation in Plant Biostimulants.
- Ministry of Agriculture, Food and Rural Affairs. (2026, May 6). Full-Scale Rollout of AI-Driven Innovation on Farms.
- Ministry of Agriculture, Food and Rural Affairs. (2025, June 17). S. Korea Accelerates Turning Agricultural Production into Smart Farming through Smart Farming Support Centres.
- USA Congress. (2025, June 5). H.R.3783 - Plant Biostimulant Act of 2025.
- Department for Environment, Food & Rural Affairs. (2026, March 19). Marketing fertilising products in the UK: regulatory reform.
- Statistisches Bundesamt. (2025, December 19). Apfelernte 2025: Mit 1 138 000 Tonnen zweithöchste Ernte der vergangenen zehn Jahre.
- Ministry of Agriculture, Forestry and Fisheries of Japan. (2025, November 28). 2025年農林業センサス結果の概要(概数値)(令和7年2月1日現在).
- Rovensa Next. (2025, December 9). Rovensa Next launches Myndra, a new synergistic biostimulant to elevate fruit quality in woody perennials in Europe.
- Hello Nature. (2025, June 26). Hello Nature Announces Major Expansion of Italian Biostimulant Production Facility.
- Syngenta. (2025, February 26). Syngenta strengthens global leadership in agricultural biologicals.
- Bayer AG. (2025, August). Half-Year Financial Report 2025.
- PI Industries Limited. (2025, August). Integrated Annual Report 2024-25.
- COMPO EXPERT. (2025, June 13). COMPO EXPERT at EBIC Summit 2025.
- UPL Limited. (2025). Annual Report 2024-25.
- Yara International. (2026, March 23). Yara expands research capabilities in biological crop solutions.
- Syngenta. (2026, July 14). Syngenta and Groundwork BioAg enter partnership to bring innovation in biologicals and soil carbon solutions to farmers.
- Rovensa Next. (2026, June 11). Rovensa Next to Distribute Novonesis’ Biosolutions for Plant Health in the United States.
- Koppert. (2025, January 27). Acadian Plant Health and Koppert expand partnership to drive sustainable agriculture.
- COMPO EXPERT. (2025, April 2). Introducing the Basfoliar® Premium SL Line: Powered by Leaf Care Technology.
- Koppert. (2025, February 20). Koppert launches Stingray 25 in France: a booster of crop growth and productivity.
This bibliography is provided for reader reference and is not exhaustive. The full report contains the complete reference list and detailed citations.
This Report Answers
- What is the size of the color development additives market in 2026 and what value is forecast for 2036?
- Which crop-quality conditions support repeat demand for color development additives?
- Why do amino acid & peptide-based products hold the leading product type share in 2026?
- How do cereals & grains and soil application shape commercial qualification requirements?
- What evidence burden can slow adoption despite favorable crop-quality economics?
- How do country growth rates differ across South Korea, USA, Germany, UK and Japan?
- Which companies use peptide, bionutrition and marine-biological platforms?
- What do agronomists and distributors compare in the competitive benchmarking assessment?
- Which recent company developments have changed available biological capacity or fruit-quality offers?
Frequently Asked Questions
Which product type leads the color development additives market?
The amino acid & peptide-based segment is expected to hold 39.0% of the color development additives market in 2026, driven by targeted metabolic use and formulation flexibility. Growers can place these inputs within familiar foliar or root-zone programs without rebuilding existing crop-nutrition schedules.
Which crop type holds the largest share of the color development additives market?
The cereals & grains segment is estimated to hold 41.4% of the color development additives market in 2026, attributable to broad acreage and repeatable field protocols. Standard equipment makes commercial trials easier to reproduce over larger production areas during repeated field seasons.
How much value will the color development additives market add between 2026 and 2036?
The color development additives market is expected to add USD 332.2 million in value between 2026 and 2036. The increase reflects wider use of validated crop-quality programs and recurring purchases after local field evidence supports the treatment economics.
Which countries are projected to record the highest growth in the color development additives market?
South Korea is projected to grow at 11.4% CAGR, followed by USA at 11.1% and Germany at 10.8% through 2036. Growth depends on local validation infrastructure plus regulatory routes that let agronomists translate performance evidence into repeat orders.
Which companies are active in the color development additives market?
Key companies operating in the color development additives market include Kimitec, Plant Health Care (PI Industries), COMPO EXPERT, Syngenta Biologicals (Valagro), UPL NPP, Rovensa Next, Hello Nature, and Acadian Plant Health. These companies compete through biological platforms, field validation and agronomic distribution support.
Preview the report firsthand - request a free sample
Get SampleGet the brochure for pricing and purchase details.
Get PDFTable of Content
- Key Takeaways
- Market Size and CAGR
- Top Growth Driver
- Fastest Growing Segment
- Leading Region
- Key Companies
- Emerging Opportunities
- Executive Summary
- Global Market Outlook
- Demand-side Trends
- Supply-side Trends
- Technology Roadmap Analysis
- Analysis and Recommendations
- Analyst Perspective (What is happening? Why now? What should investors know?)
- Key Questions Answered
- How large is the market?
- What is the CAGR?
- What are key trends?
- Which region dominates?
- Who are the leaders?
- Market Overview
- Market Coverage / Taxonomy
- Market Definition / Scope / Limitations
- Research Methodology
- Chapter Orientation
- Analytical Lens and Working Hypotheses
- Market Structure, Signals, and Trend Drivers
- Benchmarking and Cross-market Comparability
- Market Sizing, Forecasting, and Opportunity Mapping
- Research Design and Evidence Framework
- Desk Research Programme (Secondary Evidence)
- Expert Input and Fieldwork (Primary Evidence)
- Tooling, Models, and Reference Databases
- Data Engineering and Model Build
- Quality Assurance and Audit Trail
- Market Background
- Market Dynamics (Drivers, Restraints, Opportunity, Trends)
- Scenario Forecast (Optimistic, Likely, Conservative)
- Impact Analysis
- AI Impact
- Sustainability Impact
- Regulatory Impact
- Technology Impact
- Consumer / Buyer Analysis
- Purchase Drivers
- Adoption Barriers
- Buyer Journey
- Opportunity Map Analysis
- Product Life Cycle Analysis
- Supply Chain Analysis
- Investment Feasibility Matrix
- Value Chain Analysis
- PESTLE and Porter's Analysis
- Regulatory Landscape
- Regional Parent Market Outlook
- Production and Consumption Statistics
- Import and Export Statistics
- Global Market Analysis and Forecast, 2021 to 2036
- Historical Market Size Value (USD Million) Analysis, 2021 to 2025
- Current and Future Market Size Value (USD Million) Projections, 2026 to 2036
- Y-o-Y Growth Trend Analysis
- Absolute $ Opportunity Analysis
- Global Market Pricing Analysis, 2021 to 2036
- Global Market Analysis and Forecast, By Product Type, 2021 to 2036
- Introduction / Key Findings
- Historical Market Size Value (USD Million) Analysis By Product Type, 2021 to 2025
- Current and Future Market Size Value (USD Million) Analysis and Forecast By Product Type, 2026 to 2036
- Amino Acid & Peptide-Based
- Seaweed & Botanical-Based
- Humic / Fulvic-Based
- Microbial-Enhanced Blends
- Others
- Amino Acid & Peptide-Based
- Y-o-Y Growth Trend Analysis By Product Type, 2021 to 2025
- Absolute $ Opportunity Analysis By Product Type, 2026 to 2036
- Global Market Analysis and Forecast, By Crop Type, 2021 to 2036
- Introduction / Key Findings
- Historical Market Size Value (USD Million) Analysis By Crop Type, 2021 to 2025
- Current and Future Market Size Value (USD Million) Analysis and Forecast By Crop Type, 2026 to 2036
- Cereals & Grains
- Fruits & Vegetables
- Oilseeds & Pulses
- Turf & Ornamentals
- Others
- Cereals & Grains
- Y-o-Y Growth Trend Analysis By Crop Type, 2021 to 2025
- Absolute $ Opportunity Analysis By Crop Type, 2026 to 2036
- Global Market Analysis and Forecast, By Application Method, 2021 to 2036
- Introduction / Key Findings
- Historical Market Size Value (USD Million) Analysis By Application Method, 2021 to 2025
- Current and Future Market Size Value (USD Million) Analysis and Forecast By Application Method, 2026 to 2036
- Soil Application
- Foliar Application
- Fertigation / Drip
- Seed Application
- Others
- Soil Application
- Y-o-Y Growth Trend Analysis By Application Method, 2021 to 2025
- Absolute $ Opportunity Analysis By Application Method, 2026 to 2036
- Global Market Analysis and Forecast, By Farm Type, 2021 to 2036
- Introduction / Key Findings
- Historical Market Size Value (USD Million) Analysis By Farm Type, 2021 to 2025
- Current and Future Market Size Value (USD Million) Analysis and Forecast By Farm Type, 2026 to 2036
- Large Commercial Farms
- Mid-Size Farms
- Smallholders
- Greenhouses & Nurseries
- Others
- Large Commercial Farms
- Y-o-Y Growth Trend Analysis By Farm Type, 2021 to 2025
- Absolute $ Opportunity Analysis By Farm Type, 2026 to 2036
- Global Market Analysis and Forecast, By Sales Channel, 2021 to 2036
- Introduction / Key Findings
- Historical Market Size Value (USD Million) Analysis By Sales Channel, 2021 to 2025
- Current and Future Market Size Value (USD Million) Analysis and Forecast By Sales Channel, 2026 to 2036
- Agri-Input Distributors
- Cooperatives
- Agri-Retail Chains
- Online / Direct-to-Farm
- Others
- Agri-Input Distributors
- Y-o-Y Growth Trend Analysis By Sales Channel, 2021 to 2025
- Absolute $ Opportunity Analysis By Sales Channel, 2026 to 2036
- Global Market Analysis and Forecast, By Region, 2021 to 2036
- Introduction
- Historical Market Size Value (USD Million) Analysis By Region, 2021 to 2025
- Current Market Size Value (USD Million) Analysis and Forecast By Region, 2026 to 2036
- North America
- Latin America
- Western Europe
- Eastern Europe
- East Asia
- South Asia and Pacific
- Middle East & Africa
- Market Attractiveness Analysis By Region
- North America Market Analysis and Forecast, By Country, 2021 to 2036
- Historical Market Size Value (USD Million) Trend Analysis By Market Taxonomy, 2021 to 2025
- Market Size Value (USD Million) Forecast By Market Taxonomy, 2026 to 2036
- By Country
- USA
- Canada
- By Product Type
- By Crop Type
- By Application Method
- By Farm Type
- By Sales Channel
- By Country
- Market Attractiveness Analysis
- By Country
- By Product Type
- By Crop Type
- By Application Method
- By Farm Type
- By Sales Channel
- Key Takeaways
- Latin America Market Analysis and Forecast, By Country
- Historical Market Size Value (USD Million) Trend Analysis By Market Taxonomy, 2021 to 2025
- Market Size Value (USD Million) Forecast By Market Taxonomy, 2026 to 2036
- By Country
- Brazil
- Mexico
- Chile
- Rest of Latin America
- By Product Type
- By Crop Type
- By Application Method
- By Farm Type
- By Sales Channel
- By Country
- Market Attractiveness Analysis
- By Country
- By Product Type
- By Crop Type
- By Application Method
- By Farm Type
- By Sales Channel
- Key Takeaways
- Western Europe Market Analysis and Forecast, By Country
- Historical Market Size Value (USD Million) Trend Analysis By Market Taxonomy, 2021 to 2025
- Market Size Value (USD Million) Forecast By Market Taxonomy, 2026 to 2036
- By Country
- Germany
- UK
- Italy
- Spain
- France
- Nordic
- BENELUX
- Rest of Western Europe
- By Product Type
- By Crop Type
- By Application Method
- By Farm Type
- By Sales Channel
- By Country
- Market Attractiveness Analysis
- By Country
- By Product Type
- By Crop Type
- By Application Method
- By Farm Type
- By Sales Channel
- Key Takeaways
- Eastern Europe Market Analysis and Forecast, By Country
- Historical Market Size Value (USD Million) Trend Analysis By Market Taxonomy, 2021 to 2025
- Market Size Value (USD Million) Forecast By Market Taxonomy, 2026 to 2036
- By Country
- Russia
- Poland
- Hungary
- Balkan & Baltic
- Rest of Eastern Europe
- By Product Type
- By Crop Type
- By Application Method
- By Farm Type
- By Sales Channel
- By Country
- Market Attractiveness Analysis
- By Country
- By Product Type
- By Crop Type
- By Application Method
- By Farm Type
- By Sales Channel
- Key Takeaways
- East Asia Market Analysis and Forecast, By Country
- Historical Market Size Value (USD Million) Trend Analysis By Market Taxonomy, 2021 to 2025
- Market Size Value (USD Million) Forecast By Market Taxonomy, 2026 to 2036
- By Country
- China
- Japan
- South Korea
- By Product Type
- By Crop Type
- By Application Method
- By Farm Type
- By Sales Channel
- By Country
- Market Attractiveness Analysis
- By Country
- By Product Type
- By Crop Type
- By Application Method
- By Farm Type
- By Sales Channel
- Key Takeaways
- South Asia and Pacific Market Analysis and Forecast, By Country
- Historical Market Size Value (USD Million) Trend Analysis By Market Taxonomy, 2021 to 2025
- Market Size Value (USD Million) Forecast By Market Taxonomy, 2026 to 2036
- By Country
- India
- ASEAN
- Australia & New Zealand
- Rest of South Asia and Pacific
- By Product Type
- By Crop Type
- By Application Method
- By Farm Type
- By Sales Channel
- By Country
- Market Attractiveness Analysis
- By Country
- By Product Type
- By Crop Type
- By Application Method
- By Farm Type
- By Sales Channel
- Key Takeaways
- Middle East & Africa Market Analysis and Forecast, By Country
- Historical Market Size Value (USD Million) Trend Analysis By Market Taxonomy, 2021 to 2025
- Market Size Value (USD Million) Forecast By Market Taxonomy, 2026 to 2036
- By Country
- Kingdom of Saudi Arabia
- Other GCC Countries
- Türkiye
- South Africa
- Other African Union
- Rest of Middle East & Africa
- By Product Type
- By Crop Type
- By Application Method
- By Farm Type
- By Sales Channel
- By Country
- Market Attractiveness Analysis
- By Country
- By Product Type
- By Crop Type
- By Application Method
- By Farm Type
- By Sales Channel
- Key Takeaways
- Key Countries Market Analysis
- USA
- Pricing Analysis
- Market Share Analysis, 2025
- By Product Type
- By Crop Type
- By Application Method
- By Farm Type
- By Sales Channel
- Canada
- Pricing Analysis
- Market Share Analysis, 2025
- By Product Type
- By Crop Type
- By Application Method
- By Farm Type
- By Sales Channel
- Mexico
- Pricing Analysis
- Market Share Analysis, 2025
- By Product Type
- By Crop Type
- By Application Method
- By Farm Type
- By Sales Channel
- Brazil
- Pricing Analysis
- Market Share Analysis, 2025
- By Product Type
- By Crop Type
- By Application Method
- By Farm Type
- By Sales Channel
- Chile
- Pricing Analysis
- Market Share Analysis, 2025
- By Product Type
- By Crop Type
- By Application Method
- By Farm Type
- By Sales Channel
- Germany
- Pricing Analysis
- Market Share Analysis, 2025
- By Product Type
- By Crop Type
- By Application Method
- By Farm Type
- By Sales Channel
- UK
- Pricing Analysis
- Market Share Analysis, 2025
- By Product Type
- By Crop Type
- By Application Method
- By Farm Type
- By Sales Channel
- Italy
- Pricing Analysis
- Market Share Analysis, 2025
- By Product Type
- By Crop Type
- By Application Method
- By Farm Type
- By Sales Channel
- Spain
- Pricing Analysis
- Market Share Analysis, 2025
- By Product Type
- By Crop Type
- By Application Method
- By Farm Type
- By Sales Channel
- France
- Pricing Analysis
- Market Share Analysis, 2025
- By Product Type
- By Crop Type
- By Application Method
- By Farm Type
- By Sales Channel
- India
- Pricing Analysis
- Market Share Analysis, 2025
- By Product Type
- By Crop Type
- By Application Method
- By Farm Type
- By Sales Channel
- ASEAN
- Pricing Analysis
- Market Share Analysis, 2025
- By Product Type
- By Crop Type
- By Application Method
- By Farm Type
- By Sales Channel
- Australia & New Zealand
- Pricing Analysis
- Market Share Analysis, 2025
- By Product Type
- By Crop Type
- By Application Method
- By Farm Type
- By Sales Channel
- China
- Pricing Analysis
- Market Share Analysis, 2025
- By Product Type
- By Crop Type
- By Application Method
- By Farm Type
- By Sales Channel
- Japan
- Pricing Analysis
- Market Share Analysis, 2025
- By Product Type
- By Crop Type
- By Application Method
- By Farm Type
- By Sales Channel
- South Korea
- Pricing Analysis
- Market Share Analysis, 2025
- By Product Type
- By Crop Type
- By Application Method
- By Farm Type
- By Sales Channel
- Russia
- Pricing Analysis
- Market Share Analysis, 2025
- By Product Type
- By Crop Type
- By Application Method
- By Farm Type
- By Sales Channel
- Poland
- Pricing Analysis
- Market Share Analysis, 2025
- By Product Type
- By Crop Type
- By Application Method
- By Farm Type
- By Sales Channel
- Hungary
- Pricing Analysis
- Market Share Analysis, 2025
- By Product Type
- By Crop Type
- By Application Method
- By Farm Type
- By Sales Channel
- Kingdom of Saudi Arabia
- Pricing Analysis
- Market Share Analysis, 2025
- By Product Type
- By Crop Type
- By Application Method
- By Farm Type
- By Sales Channel
- Türkiye
- Pricing Analysis
- Market Share Analysis, 2025
- By Product Type
- By Crop Type
- By Application Method
- By Farm Type
- By Sales Channel
- South Africa
- Pricing Analysis
- Market Share Analysis, 2025
- By Product Type
- By Crop Type
- By Application Method
- By Farm Type
- By Sales Channel
- USA
- Market Structure Analysis
- Competition Dashboard
- Competition Benchmarking
- Market Share Analysis of Top Players
- By Regional
- By Product Type
- By Crop Type
- By Application Method
- By Farm Type
- By Sales Channel
- Emerging Startups
- Innovation Benchmarking
- Competition Analysis
- Competition Deep Dive
- Kimitec
- Overview
- Product Portfolio
- Profitability by Market Segments
- Sales Footprint
- Strategy Overview
- Marketing Strategy
- Product Strategy
- Channel Strategy
- Plant Health Care
- Compo Expert
- Valagro (Syngenta Biologicals)
- UPL (NPP)
- Rovensa Next (Tradecorp)
- Hello Nature (Italpollina)
- Acadian Plant Health
- Kimitec
- Case Studies
- Success Stories
- Recent Developments
- Competition Deep Dive
- Assumptions & Acronyms Used


