Concentrate Pods Market Size and Share Forecast Outlook 2025 to 2035

The concentrate pods market is forecast to expand from USD 1.8 billion in 2025 to USD 3.6 billion by 2035, resulting in a total gain of USD 1.8 billion over the decade. This reflects a 100.0% overall growth, with the market doubling in size and achieving a compound annual growth rate (CAGR) of 7.2% over the ten-year period.
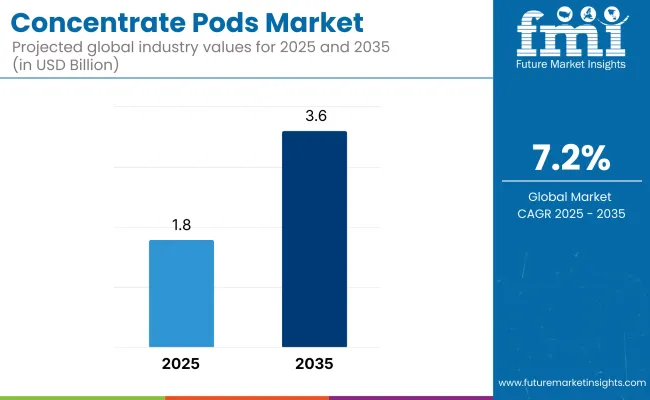
Quick Stats for Concentrate Pods Market

  • Market Value (2025): USD 1.8 billion
  • Market Forecast Value (2035): USD 3.6 billion
  • Market Forecast CAGR: 7.2%
  • Leading Segment in 2025: liquid pods (46.5%)
  • Key Growth Regions: Asia-Pacific (India is the fastest-growing market with 9.1% CAGR)
  • Top Key Players: Auhentic Daily Chemical Co., Ltd., S.C. Johnson & Son Inc., UnikPods, EcoZone, Green Sustainable Packaging, Inc., and GoodFibers.

Concentrate Pods Market

Metric Value
Industry Size (2025E) USD 1.8 billion
Industry Value (2035F) USD 3.6 billion
CAGR (2025 to 2035) 7.2%

The market scales by a 2.0 multiple, indicating rising demand for concentrated, single-serve delivery formats. In the first five years (2025-2030), the market rises from USD 1.8 billion to USD 2.6 billion, contributing USD 0.8 billion, or 44.4% of the total decade’s growth. Growth in this phase is driven by surging adoption in household cleaning, personal care, and laundry care categories, where sustainability concerns and consumer convenience encourage the shift to waterless, lightweight formats. E-commerce and subscription-based sales channels boost early-phase market visibility and trial.

From 2030 to 2035, the market further accelerates from USD 2.6 billion to USD 3.6 billion, generating USD 1.0 billion, or 55.6% of the total growth. Demand in this phase is driven by food & beverage applications, pet care, and nutraceuticals, as brands invest in functional pod systems compatible with smart dispensers and IoT-connected devices. Compostable pod films, active ingredient encapsulation, and precision-dosing technology become key innovation areas, enhancing both value and sustainability.

From 2020 to 2024, the concentrate pods market grew from USD 1.2 billion to USD 1.6 billion, driven by hardware-centric adoption across home care, personal care, and institutional cleaning applications, where compact, pre-dosed formats enable sustainability and convenience. During this period, the competitive landscape was dominated by pod packaging specialists and fast-moving consumer goods (FMCG) firms, with companies such asS.C. Johnson & Son Inc., and Auhentic Daily Chemical Co., Ltd. controlling nearly 70% of total revenue.

Competitive differentiation relied on solubility precision, pod strength, and compatibility with dispensers, while digital enablement such as usage tracking or smart refill integration was bundled within broader appliance ecosystems rather than as direct revenue drivers. Service-based models had minimal traction, contributing less than 10% of total market value, with most consumer brands prioritizing high-volume single-purchase models.

Demand for concentrate pods will expand to USD 3.6 billion in 2035, and the revenue mix will shift as refill subscription models, sustainable packaging innovation, and IoT-linked dispensers grow to over 40% share. Traditional FMCG and contract packagers face rising competition from sustainability-first players offering biodegradable pod shells, waterless cleaning systems, and customized refill solutions.

Why the Concentrate Pods Market is growing?

The shift toward portion-controlled, mess-free, and portable product formats is driving the growth of the concentrate pods market. These pods are pre-measured units of concentrated liquids or gels commonly used in home care, personal care, food & beverage, and nutraceuticals designed to dissolve or dilute during use. Consumers increasingly prefer these formats for their convenience, sustainability benefits, and reduction in product overuse or waste.

Single-use and multi-use concentrate pods have gained popularity due to their compatibility with refillable dispensers, smart appliances, or direct-application packaging. Their compact size, lightweight profile, and reduced transportation footprint support circular economy goals and appeal to eco-conscious consumers. The rise in e-commerce and subscription-based delivery models has further propelled the demand for concentrated, ship-friendly product formats.

Segmental Analysis

The market is segmented by product format, solubility type, pod material, activation method, application, end-use channel, and region. Product format includes liquid pods, gel pods, powder pods, and solid pods, offering diverse delivery systems tailored to product texture, shelf life, and activation requirements. Solubility type segmentation comprises water-soluble, oil-soluble, and dual-phase variants, supporting compatibility across a range of aqueous and lipid-based formulations. Pod material includes PVOH film, PLA film, starch-based film, and biodegradable barrier materials, emphasizing sustainability, biodegradability, and product integrity.

Activation method includes snap-to-use, twist-to-release, and dissolve-in-use, designed for user convenience, safety, and precision dispensing. Application areas span beverages, household cleaners, personal care, and nutraceuticals, reflecting rising demand for compact, single-dose, and mess-free solutions. End-use channels include retail, institutional, e-commerce, and foodservice, addressing varied distribution pathways for both consumer and commercial environments. Regionally, the market is segmented into North America, Europe, Asia-Pacific, Latin America, and the Middle East & Africa.
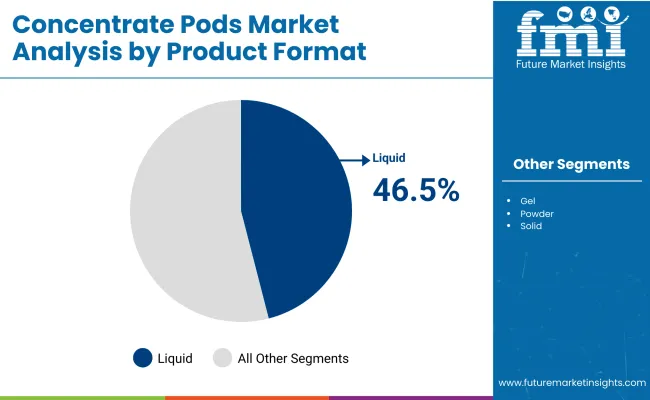
Liquid Pods Segment Dominates with Versatility and Measured Dispensing Precision

Concentrate Pods Market By Product

The liquid pods segment is projected to secure the largest market share of 46.5% in the concentrate pods market by 2025. This leadership stems from their ability to offer precise dosing, spill prevention, and easy storage, which enhances both consumer convenience and product effectiveness. Their compatibility with a wide range of applications from laundry detergents to surface cleaners makes liquid pods a preferred choice for brands targeting consistent performance and reduced product wastage. The segment’s growth is further fueled by consumer preference for ready-to-use, pre-measured solutions that eliminate guesswork in mixing.

Manufacturers are investing in barrier-protected, multi-layer pod designs to extend shelf life and protect sensitive ingredients from moisture or contamination. Liquid pod formulations are also being upgraded with eco-friendly and biodegradable components to align with sustainability targets.
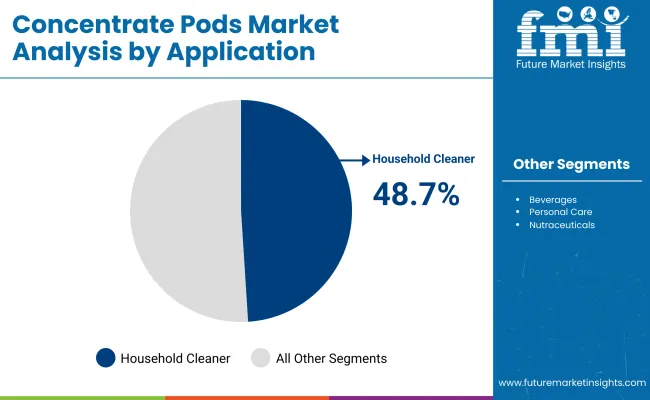
Household Cleaners Segment Leads as Concentrate Pods Transform Everyday Cleaning Routines

Concentrate Pods Market By Application

The household cleaners segment is expected to hold a commanding 48.7% share of the concentrate pods market in 2025, driven by the growing adoption of single-dose cleaning solutions that combine convenience with reduced environmental impact. These pods enable consumers to prepare cleaning solutions on demand, minimizing packaging waste and storage needs. Their ease of use has made them especially popular among busy households seeking effective cleaning with minimal preparation time.

Leading cleaning brands are expanding their pod-based offerings with targeted formulations for kitchens, bathrooms, and multi-surface use, supported by marketing campaigns focused on hygiene and sustainability. The shift toward refillable spray bottles paired with concentrate pods supports zero-waste initiatives, while child-resistant and water-soluble designs enhance user safety.

Water-Soluble Segment Dominates with Convenience, Safety, and Environmental Compatibility

The water-soluble segment is forecast to lead the concentrate pods market with a 62.2% share in 2025, driven by rising consumer demand for effortless, mess-free solutions that eliminate the need for manual measuring or mixing. Water-soluble pods dissolve completely upon contact with water, ensuring precise dosing and uniform product consistency across applications such as household cleaning, laundry care, and personal hygiene. Their ability to simplify usage without compromising performance has made them a preferred choice for both domestic and commercial settings.

Manufacturers are leveraging advanced film technologies and barrier coatings to enhance pod stability, preventing premature dissolution during storage while maintaining rapid solubility at the point of use. The segment’s growth is further reinforced by its alignment with eco-friendly goals, as water-soluble films significantly reduce secondary packaging waste and are compatible with biodegradable materials.

PVOH Film Leads Pod Material Segment with Superior Solubility and Eco-Friendly Attributes

The PVOH (polyvinyl alcohol) film segment is projected to dominate the pod material category with a 54.2% market share in 2025, driven by its rapid solubility, non-toxic profile, and compatibility with a variety of active ingredients. Its ability to completely dissolve in water without leaving residue has made it the preferred choice for manufacturers aiming to deliver a premium, mess-free consumer experience. PVOH films also act as a protective barrier, ensuring product stability during storage and transportation.

With regulatory bodies and consumers increasingly prioritizing biodegradable and compostable materials, PVOH film is gaining traction as a sustainable alternative to conventional plastics. Manufacturers are enhancing these films with moisture resistance and higher tensile strength to improve shelf life and packaging durability.

Dissolve-in-Use Pods Gain Momentum with Hassle-Free Preparation and Zero Waste

Dissolve-in-use pods are anticipated to capture 49.1% of the market share in 2025, supported by growing consumer demand for instant, pre-measured solutions that minimize preparation time. These pods dissolve entirely in the end-use container, such as a spray bottle or mixing jug, ensuring there is no product waste or leftover residue. Their convenience appeals strongly to on-the-go consumers and commercial users seeking efficiency without compromising on performance.

Producers are increasingly offering dissolve-in-use pods in both liquid and powder formats, allowing cross-segment adoption in household care, institutional cleaning, and even specialty food preparation. The format aligns well with refillable packaging systems, promoting sustainability by reducing the need for single-use bottles and extra packaging layers.

Retail End-Use Channel Dominates with Broad Consumer Access and High Purchase Frequency

The retail channel is expected to account for 42.1% of the Concentrate Pods Market in 2025, reflecting its role in driving mass-market adoption through supermarkets, hypermarkets, and specialty stores. Retail availability allows consumers to easily compare brands, formats, and prices, facilitating faster uptake of pod-based products. Promotions, product demos, and in-store education are also helping to familiarize shoppers with the convenience and sustainability benefits of concentrate pods.

Major retailers are partnering with leading manufacturers to expand private-label offerings, while also introducing eco-displays highlighting refillable and dissolvable pod systems. The retail channel benefits from impulse purchases, seasonal product rotations, and premium shelf placements that boost visibility.

What are the Drivers, Restraints, and Key Trends of the Concentrate Pods Market?

Single-use plastic concerns and compatibility limitations challenge scalability, even as demand grows across beverages, cleaning products, and personal care for pre-measured, mess-free, and compact concentrate pods that support convenience, portion control, and sustainability.

Convenience-driven Adoption in Homecare, Beverage, and Personal Care Segments

Concentrate pods are witnessing strong uptake in categories such as liquid detergents, concentrated juices, health supplements, and personal care due to their compactness, pre-measured dosing, and ease of use. These pods enable consumers to dilute a concentrated formula on demand, eliminating guesswork, overuse, or waste. Their small size supports lightweight logistics, e-commerce delivery, and on-the-go use.

In homecare and cleaning products, concentrate pods reduce plastic usage by encouraging reusable bottles. In beverages and nutraceuticals, pods appeal to health-conscious consumers seeking portability and freshness.

Material Waste, Compatibility Barriers, and Regulatory Concerns

Despite their utility, concentrate pods face several barriers to mass-market penetration. Most pods use water-soluble films like PVA or encapsulating polymers, which may not be universally biodegradable or safe across all chemical formulations. These films can present disposal and microplastic issues in wastewater treatment when not properly managed. Compatibility challenges also exist certain formulas degrade the film or require specific environmental conditions for stable encapsulation. In some markets, regulatory scrutiny around child safety and accidental ingestion (especially for cleaning pods) is tightening.

Growth of Refill Ecosystems and Biodegradable Pod Technologies

A leading trend in the concentrate pods market is the evolution of closed-loop refill systems and environmentally responsible pod designs. Brands are developing pod-compatible reusable bottles, dispensing devices, and starter kits that reduce packaging waste and boost customer loyalty through subscription models.

At the same time, innovations in water-soluble films using plant-based polymers or marine-safe biodegradables are helping overcome concerns around plastic pollution. Formulators are also experimenting with dual-chamber or multi-phase pods for advanced use cases like skincare layering or vitamin boosts in beverages.
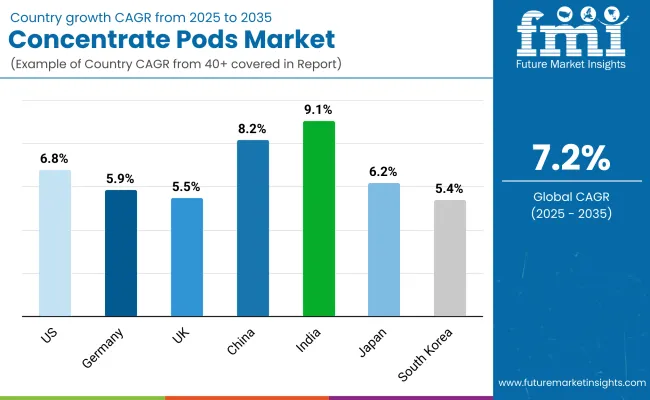
Analysis of Concentrate Pods Market by Key Countries

Concentrate Pods Market By Country

The global concentrate pods market is witnessing robust expansion, driven by rising demand for single-dose convenience, hygienic dispensing, and precise formulation across household care, personal care, nutraceuticals, and food sectors. Asia-Pacific leads growth momentum, with India and China accelerating due to growing middle-class awareness and e-commerce penetration.

In developed countries like the USA and Germany eco-conscious consumption and space-efficient product packaging are central to market traction. Concentrate pods are gaining relevance across FMCG and pharma applications due to measured usage, tamper resistance, and compact logistics.

Sales Outlook for Concentrate Pods United States

The USA market for concentrate pods is projected to grow at a CAGR of 6.8%, supported by consumer preference for pre-measured units in laundry, dishwasher detergents, and functional beverages. FMCG brands are emphasizing pod-based solutions that ensure reduced spillage, controlled dosing, and eco-conscious packaging. With smart dispensers gaining traction in connected homes, pod-format products are becoming part of subscription-based refill ecosystems.

  • Laundry and dish pod sales grow due to mess-free, pre-measured use cases.
  • Functional beverage makers use pods for vitamins, energy drinks, and hydration boosters.
  • Retailers offer bundled IoT dispensers compatible with refill pods for recurring orders.

Growth Outlook for Concentrate Pods Germany

Germany’s concentrate pods market is growing at a CAGR of 5.9%, propelled by demand in green cleaning, homecare, and nutrition sectors. Regulatory focus on packaging waste and recyclability is leading brands to adopt pod formats made from water-soluble films and biodegradable capsules. German consumers favor refillable and precision-based usage, especially for laundry, oral hygiene, and health supplements.

  • Bio-based detergent pods gain popularity for low-waste, plant-based formulations.
  • Health-conscious consumers prefer vitamin pods and probiotic supplements in single-serve formats.
  • German OEMs produce compact dispensers designed for refillable, minimal-contact pod delivery.

Expansion Outlook for Concentrate Pods United Kingdom

The UK concentrate pods market is projected to grow at a CAGR of 5.5%, led by growing adoption across oral care, OTC drugs, and sustainable cleaning. Cost-of-living pressures have prompted demand for accurate dosing and extended product shelf life. Subscription models are being built around pods for toothpaste, hand soap, and nutraceuticals, driving repeat usage.

  • Mouthwash and toothpaste pods reduce plastic consumption and improve portability.
  • Nutraceutical firms offer daily vitamin pods with individual QR-coded packaging.
  • Retailers push water-activated cleaning pods to cut freight costs and emissions.

Sales Outlook for Concentrate Pods China

China’s concentrate pods market is forecast to expand at a CAGR of 8.2%, driven by growing e-commerce formats, rapid urbanization, and premiumization in household care. Single-dose pods for cleaning and skincare are widely adopted by Gen Z and millennial consumers, who prioritize convenience, hygiene, and minimalist design. Domestic brands are also innovating with herbal formulations in pod formats.

  • Household cleaners and shower gels are increasingly launched in pod-based form for urban homes.
  • D2C platforms promote monthly pod subscriptions for home, beauty, and baby care categories.
  • Local OEMs develop water-soluble pods made from starch-based biodegradable materials.

Growth Outlook for Concentrate Pods India

India is witnessing the fastest growth in the concentrate pods market with a projected CAGR of 9.1%. MSMEs and urban households are adopting pods for precise usage in cleaning, beauty, and nutraceutical applications. Tier-2 and Tier-3 cities are seeing demand for compact, travel-friendly, and water-activated products. Eco-conscious start-ups are using pods to promote zero-waste packaging.

  • Affordable nutraceutical pods cater to immunity and energy needs in ready-to-mix formats.
  • Laundry pods and dishwashing pods gain acceptance due to compact size and portion control.
  • Start-ups focus on refill-and-reuse strategies with reusable pod containers and sachets.

Growth Outlook for Concentrate Pods Japan

Japan’s concentrate pods market is projected to grow at a CAGR of 6.2%, led by innovation in compact homecare, elder-friendly personal care, and precision medication formats. Japanese consumers value form factor efficiency and aesthetic integration with minimalist homes. Pharmaceutical and OTC categories are also exploring pods for accurate dosage, particularly in geriatric populations.

  • Elder care brands launch body wash and shampoo pods with pre-portioned doses.
  • Japanese pharma players develop OTC relief pods for sore throat, digestion, and hydration.
  • Homecare brands adopt refillable pod dispensers to reduce plastic waste.

Opportunity Analysis for Concentrate Pods South Korea

South Korea’s market is forecast to grow at a CAGR of 5.4%, supported by beauty, wellness, and premium FMCG segments. Pods are increasingly used in K-beauty rituals, including cleansing oils, serums, and hair masks. Precision formulation and airtight pod storage help preserve active ingredients. The tech-savvy Korean market is also aligning pods with app-controlled home dispensers.

  • Skincare pods gain favor for antioxidants, probiotics, and sensitive skin regimens.
  • Smart dispensers enable mix-on-demand for customized personal care routines.
  • Korean OEMs are launching dual-pod and twist-to-activate formats to enhance user interaction.

Competitive Landscape of Concentrate Pods Market

The concentrate pods market is moderately fragmented, with contract manufacturers, sustainability-driven innovators, and multinational CPG players competing across household cleaning, personal care, and foodservice concentrate categories. Global leaders such as S.C. Johnson & Son Inc. and Pod Pack International, LLC hold significant market share, driven by proprietary pod-based formulations, compatibility with refillable systems, and strategic alignment with waste-reduction goals. Their strategies increasingly emphasize dissolvable film technologies, single-dose accuracy, and retail-ready solutions for cleaning, beverage, and flavoring applications.

Established mid-sized players, including Unimasses Group, Auhentic Daily Chemical Co., Ltd., and UnikPods, are accelerating adoption through private-label offerings, dual-compartment innovations, and customizable shapes designed for e-commerce and subscription-based delivery formats. These firms are particularly relevant for DTC (direct-to-consumer) brands in laundry care, multi-surface sprays, and waterless concentrates.

Key Development of Concentrate Pods Market

  • 03 March 2025, Unimasses Group, Pods & Success Sourcing High-Quality Private Label Laundry Pods from China
  • 03 Jul, 2025 Auhentic daily Chemical Co., Ltd., A Liquid Dispensing Structure for Laundry Detergent Pod Machines: The Core of Precision, Cleanliness, and Efficient Filling.
  • Concentrate Pods Market

Key Companies

  • Auhentic daily Chemical Co.,Ltd.
  • S.C. Johnson & Son Inc.
  • UnikPods
  • EcoZone
  • Green Sustainable Packaging, Inc.
  • GoodFibers

Scope of the Report

Item Value
Quantitative Units USD 1.8 Billion
By Product Format Liquid Pods, Gel Pods, Powder Pods, and Solid Pods
By Solubility Type Water-soluble, Oil-soluble, and Dual-phase
By Pod Material PVOH Film, PLA Film, Starch-based Film, and Biodegradable Barrier
By Activation Method Snap-to-Use, Twist-to-Release, and Dissolve-in-Use
By Application Beverages, Household Cleaners, Personal Care, and Nutraceuticals
By End-Use Channel Retail, Institutional, E-commerce, and Foodservice
Key Companies Profiled Auhentic Daily Chemical Co., Ltd., S.C. Johnson & Son Inc., UnikPods, EcoZone, Green Sustainable Packaging, Inc., and GoodFibers
Additional Attributes Expanding adoption of single-dose pod formats in beverage and personal care segments, water-soluble PVOH films gaining prominence for eco-friendly disposal, innovation in dual-phase pods for multi-component delivery, increasing use in concentrated household cleaner refills, biodegradable pod materials aligning with circular economy initiatives, growth in e-commerce sales for DIY pod refills, rising institutional demand for bulk pack pods in foodservice and healthcare, child-resistant and tamper-evident pod formats improving safety, integration of oil-soluble pods in nutraceutical and wellness products, and strong market growth across North America, Europe, and Asia-Pacific

Key Segments

By Product Format:

  • Liquid Pods
  • Gel Pods
  • Powder Pods
  • Solid Pods

By Solubility Type:

  • Water-soluble
  • Oil-soluble
  • Dual-phase

By Pod Material:

  • PVOH Film
  • PLA Film
  • Starch-based Film
  • Biodegradable Barrier

By Activation Method:

  • Snap-to-Use
  • Twist-to-Release
  • Dissolve-in-Use

By Application:

  • Beverages
  • Household Cleaners
  • Personal Care
  • Nutraceuticals

By End-Use Channel:

  • Retail
  • Institutional
  • E-commerce
  • Foodservice

By Region:

  • North America
  • Europe
  • Asia-Pacific
  • Latin America
  • Middle East & Africa

Table of Content

  1. Executive Summary
    • Global Market Outlook
    • Demand-side Trends
    • Supply-side Trends
    • Technology Roadmap Analysis
    • Analysis and Recommendations
  2. Market Overview
    • Market Coverage / Taxonomy
    • Market Definition / Scope / Limitations
  3. Market Background
    • Market Dynamics
      • Drivers
      • Restraints
      • Opportunity
      • Trends
    • Scenario Forecast
      • Demand in Optimistic Scenario
      • Demand in Likely Scenario
      • Demand in Conservative Scenario
    • Opportunity Map Analysis
    • Product Life Cycle Analysis
    • Supply Chain Analysis
      • Supply Side Participants and their Roles
        • Producers
        • Mid-Level Participants (Traders/ Agents/ Brokers)
        • Wholesalers and Distributors
      • Value Added and Value Created at Node in the Supply Chain
      • List of Raw Material Suppliers
      • List of Existing and Potential Buyer’s
    • Investment Feasibility Matrix
    • Value Chain Analysis
      • Profit Margin Analysis
      • Wholesalers and Distributors
      • Retailers
    • PESTLE and Porter’s Analysis
    • Regulatory Landscape
      • By Key Regions
      • By Key Countries
    • Regional Parent Market Outlook
    • Production and Consumption Statistics
    • Import and Export Statistics
  4. Global Market Analysis 2020 to 2024 and Forecast, 2025 to 2035
    • Historical Market Size Value (USD Million) & Volume (Units) Analysis, 2020 to 2024
    • Current and Future Market Size Value (USD Million) & Volume (Units) Projections, 2025 to 2035
      • Y-o-Y Growth Trend Analysis
      • Absolute $ Opportunity Analysis
  5. Global Market Pricing Analysis 2020 to 2024 and Forecast 2025 to 2035
  6. Global Market Analysis 2020 to 2024 and Forecast 2025 to 2035, By Product Format
    • Introduction / Key Findings
    • Historical Market Size Value (USD Million) & Volume (Units) Analysis By Product Format, 2020 to 2024
    • Current and Future Market Size Value (USD Million) & Volume (Units) Analysis and Forecast By Product Format, 2025 to 2035
      • Liquid Pods
      • Gel Pods
      • Powder Pods
      • Solid Pods
    • Y-o-Y Growth Trend Analysis By Product Format, 2020 to 2024
    • Absolute $ Opportunity Analysis By Product Format, 2025 to 2035
  7. Global Market Analysis 2020 to 2024 and Forecast 2025 to 2035, By Solubility Type
    • Introduction / Key Findings
    • Historical Market Size Value (USD Million) & Volume (Units) Analysis By Solubility Type, 2020 to 2024
    • Current and Future Market Size Value (USD Million) & Volume (Units) Analysis and Forecast By Solubility Type, 2025 to 2035
      • Water-soluble
      • Oil-soluble
      • Dual-phase
    • Y-o-Y Growth Trend Analysis By Solubility Type, 2020 to 2024
    • Absolute $ Opportunity Analysis By Solubility Type, 2025 to 2035
  8. Global Market Analysis 2020 to 2024 and Forecast 2025 to 2035, By Pod Material
    • Introduction / Key Findings
    • Historical Market Size Value (USD Million) & Volume (Units) Analysis By Pod Material, 2020 to 2024
    • Current and Future Market Size Value (USD Million) & Volume (Units) Analysis and Forecast By Pod Material, 2025 to 2035
      • PVOH Film
      • PLA Film
      • Starch-based Film
      • Biodegradable Barrier
    • Y-o-Y Growth Trend Analysis By Pod Material, 2020 to 2024
    • Absolute $ Opportunity Analysis By Pod Material, 2025 to 2035
  9. Global Market Analysis 2020 to 2024 and Forecast 2025 to 2035, By Activation Method
    • Introduction / Key Findings
    • Historical Market Size Value (USD Million) & Volume (Units) Analysis By Activation Method, 2020 to 2024
    • Current and Future Market Size Value (USD Million) & Volume (Units) Analysis and Forecast By Activation Method, 2025 to 2035
      • Snap-to-Use
      • Twist-to-Release
      • Dissolve-in-Use
    • Y-o-Y Growth Trend Analysis By Activation Method, 2020 to 2024
    • Absolute $ Opportunity Analysis By Activation Method, 2025 to 2035
  10. Global Market Analysis 2020 to 2024 and Forecast 2025 to 2035, By Application
    • Introduction / Key Findings
    • Historical Market Size Value (USD Million) & Volume (Units) Analysis By Application, 2020 to 2024
    • Current and Future Market Size Value (USD Million) & Volume (Units) Analysis and Forecast By Application, 2025 to 2035
      • Beverages
      • Household Cleaners
      • Personal Care
      • Nutraceuticals
    • Y-o-Y Growth Trend Analysis By Application, 2020 to 2024
    • Absolute $ Opportunity Analysis By Application, 2025 to 2035
  11. Global Market Analysis 2020 to 2024 and Forecast 2025 to 2035, By End-Use Channel
    • Introduction / Key Findings
    • Historical Market Size Value (USD Million) & Volume (Units) Analysis By End-Use Channel, 2020 to 2024
    • Current and Future Market Size Value (USD Million) & Volume (Units) Analysis and Forecast By End-Use Channel, 2025 to 2035
      • Retail
      • Institutional
      • E-commerce
      • Foodservice
    • Y-o-Y Growth Trend Analysis By End-Use Channel, 2020 to 2024
    • Absolute $ Opportunity Analysis By End-Use Channel, 2025 to 2035
  12. Global Market Analysis 2020 to 2024 and Forecast 2025 to 2035, By Region
    • Introduction
    • Historical Market Size Value (USD Million) & Volume (Units) Analysis By Region, 2020 to 2024
    • Current Market Size Value (USD Million) & Volume (Units) Analysis and Forecast By Region, 2025 to 2035
      • North America
      • Latin America
      • Europe
      • East Asia
      • South Asia
      • Oceania
      • MEA
    • Market Attractiveness Analysis By Region
  13. North America Market Analysis 2020 to 2024 and Forecast 2025 to 2035, By Country
    • Historical Market Size Value (USD Million) & Volume (Units) Trend Analysis By Market Taxonomy, 2020 to 2024
    • Market Size Value (USD Million) & Volume (Units) Forecast By Market Taxonomy, 2025 to 2035
      • By Country
        • USA
        • Canada
      • By Product Format
      • By Solubility Type
      • By Pod Material
      • By Activation Method
      • By Application
      • By End-Use Channel
    • Market Attractiveness Analysis
      • By Country
      • By Product Format
      • By Solubility Type
      • By Pod Material
      • By Activation Method
      • By Application
      • By End-Use Channel
    • Key Takeaways
  14. Latin America Market Analysis 2020 to 2024 and Forecast 2025 to 2035, By Country
    • Historical Market Size Value (USD Million) & Volume (Units) Trend Analysis By Market Taxonomy, 2020 to 2024
    • Market Size Value (USD Million) & Volume (Units) Forecast By Market Taxonomy, 2025 to 2035
      • By Country
        • Brazil
        • Mexico
        • Argentina
        • Chile
        • Peru
        • Rest of Latin America
      • By Product Format
      • By Solubility Type
      • By Pod Material
      • By Activation Method
      • By Application
      • By End-Use Channel
    • Market Attractiveness Analysis
      • By Country
      • By Product Format
      • By Solubility Type
      • By Pod Material
      • By Activation Method
      • By Application
      • By End-Use Channel
    • Key Takeaways
  15. Europe Market Analysis 2020 to 2024 and Forecast 2025 to 2035, By Country
    • Historical Market Size Value (USD Million) & Volume (Units) Trend Analysis By Market Taxonomy, 2020 to 2024
    • Market Size Value (USD Million) & Volume (Units) Forecast By Market Taxonomy, 2025 to 2035
      • By Country
        • Germany
        • Italy
        • France
        • UK
        • Spain
        • Russia
        • BENELUX
        • Rest of Europe
      • By Product Format
      • By Solubility Type
      • By Pod Material
      • By Activation Method
      • By Application
      • By End-Use Channel
    • Market Attractiveness Analysis
      • By Country
      • By Product Format
      • By Solubility Type
      • By Pod Material
      • By Activation Method
      • By Application
      • By End-Use Channel
    • Key Takeaways
  16. East Asia Market Analysis 2020 to 2024 and Forecast 2025 to 2035, By Country
    • Historical Market Size Value (USD Million) & Volume (Units) Trend Analysis By Market Taxonomy, 2020 to 2024
    • Market Size Value (USD Million) & Volume (Units) Forecast By Market Taxonomy, 2025 to 2035
      • By Country
        • China
        • Japan
        • South Korea
      • By Product Format
      • By Solubility Type
      • By Pod Material
      • By Activation Method
      • By Application
      • By End-Use Channel
    • Market Attractiveness Analysis
      • By Country
      • By Product Format
      • By Solubility Type
      • By Pod Material
      • By Activation Method
      • By Application
      • By End-Use Channel
    • Key Takeaways
  17. South Asia Market Analysis 2020 to 2024 and Forecast 2025 to 2035, By Country
    • Historical Market Size Value (USD Million) & Volume (Units) Trend Analysis By Market Taxonomy, 2020 to 2024
    • Market Size Value (USD Million) & Volume (Units) Forecast By Market Taxonomy, 2025 to 2035
      • By Country
        • India
        • Thailand
        • Malaysia
        • Indonesia
        • Rest of South Asia
      • By Product Format
      • By Solubility Type
      • By Pod Material
      • By Activation Method
      • By Application
      • By End-Use Channel
    • Market Attractiveness Analysis
      • By Country
      • By Product Format
      • By Solubility Type
      • By Pod Material
      • By Activation Method
      • By Application
      • By End-Use Channel
    • Key Takeaways
  18. Oceania Market Analysis 2020 to 2024 and Forecast 2025 to 2035, By Country
    • Historical Market Size Value (USD Million) & Volume (Units) Trend Analysis By Market Taxonomy, 2020 to 2024
    • Market Size Value (USD Million) & Volume (Units) Forecast By Market Taxonomy, 2025 to 2035
      • By Country
        • Australia
        • New Zealand
      • By Product Format
      • By Solubility Type
      • By Pod Material
      • By Activation Method
      • By Application
      • By End-Use Channel
    • Market Attractiveness Analysis
      • By Country
      • By Product Format
      • By Solubility Type
      • By Pod Material
      • By Activation Method
      • By Application
      • By End-Use Channel
    • Key Takeaways
  19. MEA Market Analysis 2020 to 2024 and Forecast 2025 to 2035, By Country
    • Historical Market Size Value (USD Million) & Volume (Units) Trend Analysis By Market Taxonomy, 2020 to 2024
    • Market Size Value (USD Million) & Volume (Units) Forecast By Market Taxonomy, 2025 to 2035
      • By Country
        • GCC
        • Rest of MEA
      • By Product Format
      • By Solubility Type
      • By Pod Material
      • By Activation Method
      • By Application
      • By End-Use Channel
    • Market Attractiveness Analysis
      • By Country
      • By Product Format
      • By Solubility Type
      • By Pod Material
      • By Activation Method
      • By Application
      • By End-Use Channel
    • Key Takeaways
  20. Key Countries Market Analysis
    • USA
      • Pricing Analysis
      • Market Share Analysis, 2024
        • By Product Format
        • By Solubility Type
        • By Pod Material
        • By Activation Method
        • By Application
        • By End-Use Channel
    • Canada
      • Pricing Analysis
      • Market Share Analysis, 2024
        • By Product Format
        • By Solubility Type
        • By Pod Material
        • By Activation Method
        • By Application
        • By End-Use Channel
    • Brazil
      • Pricing Analysis
      • Market Share Analysis, 2024
        • By Product Format
        • By Solubility Type
        • By Pod Material
        • By Activation Method
        • By Application
        • By End-Use Channel
    • Mexico
      • Pricing Analysis
      • Market Share Analysis, 2024
        • By Product Format
        • By Solubility Type
        • By Pod Material
        • By Activation Method
        • By Application
        • By End-Use Channel
    • Argentina
      • Pricing Analysis
      • Market Share Analysis, 2024
        • By Product Format
        • By Solubility Type
        • By Pod Material
        • By Activation Method
        • By Application
        • By End-Use Channel
  21. Market Structure Analysis
    • Competition Dashboard
    • Competition Benchmarking
    • Market Share Analysis of Top Players
      • By Regional
      • By Product Format
      • By Solubility Type
      • By Pod Material
      • By Activation Method
      • By Application
      • By End-Use Channel
  22. Competition Analysis
    • Competition Deep Dive
      • Pod Pack International, LLC
        • Overview
        • Product Portfolio
        • Profitability by Market Segments (Product/Age /Sales Channel/Region)
        • Sales Footprint
        • Strategy Overview
          • Marketing Strategy
          • Product Strategy
          • Channel Strategy
      • UNIMASSES
        • Overview
        • Product Portfolio
        • Profitability by Market Segments (Product/Age /Sales Channel/Region)
        • Sales Footprint
        • Strategy Overview
          • Marketing Strategy
          • Product Strategy
          • Channel Strategy
      • Auhentic daily Chemical Co.,Ltd.
        • Overview
        • Product Portfolio
        • Profitability by Market Segments (Product/Age /Sales Channel/Region)
        • Sales Footprint
        • Strategy Overview
          • Marketing Strategy
          • Product Strategy
          • Channel Strategy
      • Tian Jin Nuo Mi Life Supplies Co.,ltd.
        • Overview
        • Product Portfolio
        • Profitability by Market Segments (Product/Age /Sales Channel/Region)
        • Sales Footprint
        • Strategy Overview
          • Marketing Strategy
          • Product Strategy
          • Channel Strategy
      • S.C. Johnson & Son Inc.
        • Overview
        • Product Portfolio
        • Profitability by Market Segments (Product/Age /Sales Channel/Region)
        • Sales Footprint
        • Strategy Overview
          • Marketing Strategy
          • Product Strategy
          • Channel Strategy
      • UnikPods
        • Overview
        • Product Portfolio
        • Profitability by Market Segments (Product/Age /Sales Channel/Region)
        • Sales Footprint
        • Strategy Overview
          • Marketing Strategy
          • Product Strategy
          • Channel Strategy
      • EcoZone
        • Overview
        • Product Portfolio
        • Profitability by Market Segments (Product/Age /Sales Channel/Region)
        • Sales Footprint
        • Strategy Overview
          • Marketing Strategy
          • Product Strategy
          • Channel Strategy
      • Green Sustainable Packaging, Inc.
        • Overview
        • Product Portfolio
        • Profitability by Market Segments (Product/Age /Sales Channel/Region)
        • Sales Footprint
        • Strategy Overview
          • Marketing Strategy
          • Product Strategy
          • Channel Strategy
      • GoodFibers
        • Overview
        • Product Portfolio
        • Profitability by Market Segments (Product/Age /Sales Channel/Region)
        • Sales Footprint
        • Strategy Overview
          • Marketing Strategy
          • Product Strategy
          • Channel Strategy
      • Mattpak
        • Overview
        • Product Portfolio
        • Profitability by Market Segments (Product/Age /Sales Channel/Region)
        • Sales Footprint
        • Strategy Overview
          • Marketing Strategy
          • Product Strategy
          • Channel Strategy
  23. Assumptions & Acronyms Used
  24. Research Methodology

List of Tables

  • Table 1: Global Market Value (USD Million) Forecast by Region, 2020-2035
  • Table 2: Global Market Volume (Units) Forecast by Region, 2020-2035
  • Table 3: Global Market Value (USD Million) Forecast By Product Format, 2020-2035
  • Table 4: Global Market Volume (Units) Forecast By Product Format, 2020-2035
  • Table 5: Global Market Value (USD Million) Forecast By Solubility Type, 2020-2035
  • Table 6: Global Market Volume (Units) Forecast By Solubility Type, 2020-2035
  • Table 7: Global Market Value (USD Million) Forecast By Pod Material, 2020-2035
  • Table 8: Global Market Volume (Units) Forecast By Pod Material, 2020-2035
  • Table 9: Global Market Value (USD Million) Forecast By Activation Method, 2020-2035
  • Table 10: Global Market Volume (Units) Forecast By Activation Method, 2020-2035
  • Table 11: Global Market Value (USD Million) Forecast By Application, 2020-2035
  • Table 12: Global Market Volume (Units) Forecast By Application, 2020-2035
  • Table 13: Global Market Value (USD Million) Forecast By End-Use Channel, 2020-2035
  • Table 14: Global Market Volume (Units) Forecast By End-Use Channel, 2020-2035
  • Table 15: North America Market Value (USD Million) Forecast by Country, 2020-2035
  • Table 16: North America Market Volume (Units) Forecast by Country, 2020-2035
  • Table 17: North America Market Value (USD Million) Forecast By Product Format, 2020-2035
  • Table 18: North America Market Volume (Units) Forecast By Product Format, 2020-2035
  • Table 19: North America Market Value (USD Million) Forecast By Solubility Type, 2020-2035
  • Table 20: North America Market Volume (Units) Forecast By Solubility Type, 2020-2035
  • Table 21: North America Market Value (USD Million) Forecast By Pod Material, 2020-2035
  • Table 22: North America Market Volume (Units) Forecast By Pod Material, 2020-2035
  • Table 23: North America Market Value (USD Million) Forecast By Activation Method, 2020-2035
  • Table 24: North America Market Volume (Units) Forecast By Activation Method, 2020-2035
  • Table 25: North America Market Value (USD Million) Forecast By Application, 2020-2035
  • Table 26: North America Market Volume (Units) Forecast By Application, 2020-2035
  • Table 27: North America Market Value (USD Million) Forecast By End-Use Channel, 2020-2035
  • Table 28: North America Market Volume (Units) Forecast By End-Use Channel, 2020-2035
  • Table 29: Latin America Market Value (USD Million) Forecast by Country, 2020-2035
  • Table 30: Latin America Market Volume (Units) Forecast by Country, 2020-2035
  • Table 31: Latin America Market Value (USD Million) Forecast By Product Format, 2020-2035
  • Table 32: Latin America Market Volume (Units) Forecast By Product Format, 2020-2035
  • Table 33: Latin America Market Value (USD Million) Forecast By Solubility Type, 2020-2035
  • Table 34: Latin America Market Volume (Units) Forecast By Solubility Type, 2020-2035
  • Table 35: Latin America Market Value (USD Million) Forecast By Pod Material, 2020-2035
  • Table 36: Latin America Market Volume (Units) Forecast By Pod Material, 2020-2035
  • Table 37: Latin America Market Value (USD Million) Forecast By Activation Method, 2020-2035
  • Table 38: Latin America Market Volume (Units) Forecast By Activation Method, 2020-2035
  • Table 39: Latin America Market Value (USD Million) Forecast By Application, 2020-2035
  • Table 40: Latin America Market Volume (Units) Forecast By Application, 2020-2035
  • Table 41: Latin America Market Value (USD Million) Forecast By End-Use Channel, 2020-2035
  • Table 42: Latin America Market Volume (Units) Forecast By End-Use Channel, 2020-2035
  • Table 43: Europe Market Value (USD Million) Forecast by Country, 2020-2035
  • Table 44: Europe Market Volume (Units) Forecast by Country, 2020-2035
  • Table 45: Europe Market Value (USD Million) Forecast By Product Format, 2020-2035
  • Table 46: Europe Market Volume (Units) Forecast By Product Format, 2020-2035
  • Table 47: Europe Market Value (USD Million) Forecast By Solubility Type, 2020-2035
  • Table 48: Europe Market Volume (Units) Forecast By Solubility Type, 2020-2035
  • Table 49: Europe Market Value (USD Million) Forecast By Pod Material, 2020-2035
  • Table 50: Europe Market Volume (Units) Forecast By Pod Material, 2020-2035
  • Table 51: Europe Market Value (USD Million) Forecast By Activation Method, 2020-2035
  • Table 52: Europe Market Volume (Units) Forecast By Activation Method, 2020-2035
  • Table 53: Europe Market Value (USD Million) Forecast By Application, 2020-2035
  • Table 54: Europe Market Volume (Units) Forecast By Application, 2020-2035
  • Table 55: Europe Market Value (USD Million) Forecast By End-Use Channel, 2020-2035
  • Table 56: Europe Market Volume (Units) Forecast By End-Use Channel, 2020-2035
  • Table 57: East Asia Market Value (USD Million) Forecast by Country, 2020-2035
  • Table 58: East Asia Market Volume (Units) Forecast by Country, 2020-2035
  • Table 59: East Asia Market Value (USD Million) Forecast By Product Format, 2020-2035
  • Table 60: East Asia Market Volume (Units) Forecast By Product Format, 2020-2035
  • Table 61: East Asia Market Value (USD Million) Forecast By Solubility Type, 2020-2035
  • Table 62: East Asia Market Volume (Units) Forecast By Solubility Type, 2020-2035
  • Table 63: East Asia Market Value (USD Million) Forecast By Pod Material, 2020-2035
  • Table 64: East Asia Market Volume (Units) Forecast By Pod Material, 2020-2035
  • Table 65: East Asia Market Value (USD Million) Forecast By Activation Method, 2020-2035
  • Table 66: East Asia Market Volume (Units) Forecast By Activation Method, 2020-2035
  • Table 67: East Asia Market Value (USD Million) Forecast By Application, 2020-2035
  • Table 68: East Asia Market Volume (Units) Forecast By Application, 2020-2035
  • Table 69: East Asia Market Value (USD Million) Forecast By End-Use Channel, 2020-2035
  • Table 70: East Asia Market Volume (Units) Forecast By End-Use Channel, 2020-2035
  • Table 71: South Asia Market Value (USD Million) Forecast by Country, 2020-2035
  • Table 72: South Asia Market Volume (Units) Forecast by Country, 2020-2035
  • Table 73: South Asia Market Value (USD Million) Forecast By Product Format, 2020-2035
  • Table 74: South Asia Market Volume (Units) Forecast By Product Format, 2020-2035
  • Table 75: South Asia Market Value (USD Million) Forecast By Solubility Type, 2020-2035
  • Table 76: South Asia Market Volume (Units) Forecast By Solubility Type, 2020-2035
  • Table 77: South Asia Market Value (USD Million) Forecast By Pod Material, 2020-2035
  • Table 78: South Asia Market Volume (Units) Forecast By Pod Material, 2020-2035
  • Table 79: South Asia Market Value (USD Million) Forecast By Activation Method, 2020-2035
  • Table 80: South Asia Market Volume (Units) Forecast By Activation Method, 2020-2035
  • Table 81: South Asia Market Value (USD Million) Forecast By Application, 2020-2035
  • Table 82: South Asia Market Volume (Units) Forecast By Application, 2020-2035
  • Table 83: South Asia Market Value (USD Million) Forecast By End-Use Channel, 2020-2035
  • Table 84: South Asia Market Volume (Units) Forecast By End-Use Channel, 2020-2035
  • Table 85: Oceania Market Value (USD Million) Forecast by Country, 2020-2035
  • Table 86: Oceania Market Volume (Units) Forecast by Country, 2020-2035
  • Table 87: Oceania Market Value (USD Million) Forecast By Product Format, 2020-2035
  • Table 88: Oceania Market Volume (Units) Forecast By Product Format, 2020-2035
  • Table 89: Oceania Market Value (USD Million) Forecast By Solubility Type, 2020-2035
  • Table 90: Oceania Market Volume (Units) Forecast By Solubility Type, 2020-2035
  • Table 91: Oceania Market Value (USD Million) Forecast By Pod Material, 2020-2035
  • Table 92: Oceania Market Volume (Units) Forecast By Pod Material, 2020-2035
  • Table 93: Oceania Market Value (USD Million) Forecast By Activation Method, 2020-2035
  • Table 94: Oceania Market Volume (Units) Forecast By Activation Method, 2020-2035
  • Table 95: Oceania Market Value (USD Million) Forecast By Application, 2020-2035
  • Table 96: Oceania Market Volume (Units) Forecast By Application, 2020-2035
  • Table 97: Oceania Market Value (USD Million) Forecast By End-Use Channel, 2020-2035
  • Table 98: Oceania Market Volume (Units) Forecast By End-Use Channel, 2020-2035
  • Table 99: MEA Market Value (USD Million) Forecast by Country, 2020-2035
  • Table 100: MEA Market Volume (Units) Forecast by Country, 2020-2035
  • Table 101: MEA Market Value (USD Million) Forecast By Product Format, 2020-2035
  • Table 102: MEA Market Volume (Units) Forecast By Product Format, 2020-2035
  • Table 103: MEA Market Value (USD Million) Forecast By Solubility Type, 2020-2035
  • Table 104: MEA Market Volume (Units) Forecast By Solubility Type, 2020-2035
  • Table 105: MEA Market Value (USD Million) Forecast By Pod Material, 2020-2035
  • Table 106: MEA Market Volume (Units) Forecast By Pod Material, 2020-2035
  • Table 107: MEA Market Value (USD Million) Forecast By Activation Method, 2020-2035
  • Table 108: MEA Market Volume (Units) Forecast By Activation Method, 2020-2035
  • Table 109: MEA Market Value (USD Million) Forecast By Application, 2020-2035
  • Table 110: MEA Market Volume (Units) Forecast By Application, 2020-2035
  • Table 111: MEA Market Value (USD Million) Forecast By End-Use Channel, 2020-2035
  • Table 112: MEA Market Volume (Units) Forecast By End-Use Channel, 2020-2035

List of Figures

  • Figure 1: Global Market Volume (Units) Forecast 2020-2035
  • Figure 2: Global Market Pricing Analysis
  • Figure 3: Global Market Value (USD Million) Forecast 2020-2035
  • Figure 4: Global Market Value Share and BPS Analysis By Product Format, 2025 and 2035
  • Figure 5: Global Market Y-o-Y Growth Comparison By Product Format, 2025-2035
  • Figure 6: Global Market Attractiveness Analysis By Product Format
  • Figure 7: Global Market Value Share and BPS Analysis By Solubility Type, 2025 and 2035
  • Figure 8: Global Market Y-o-Y Growth Comparison By Solubility Type, 2025-2035
  • Figure 9: Global Market Attractiveness Analysis By Solubility Type
  • Figure 10: Global Market Value Share and BPS Analysis By Pod Material, 2025 and 2035
  • Figure 11: Global Market Y-o-Y Growth Comparison By Pod Material, 2025-2035
  • Figure 12: Global Market Attractiveness Analysis By Pod Material
  • Figure 13: Global Market Value Share and BPS Analysis By Activation Method, 2025 and 2035
  • Figure 14: Global Market Y-o-Y Growth Comparison By Activation Method, 2025-2035
  • Figure 15: Global Market Attractiveness Analysis By Activation Method
  • Figure 16: Global Market Value Share and BPS Analysis By Application, 2025 and 2035
  • Figure 17: Global Market Y-o-Y Growth Comparison By Application, 2025-2035
  • Figure 18: Global Market Attractiveness Analysis By Application
  • Figure 19: Global Market Value Share and BPS Analysis By End-Use Channel, 2025 and 2035
  • Figure 20: Global Market Y-o-Y Growth Comparison By End-Use Channel, 2025-2035
  • Figure 21: Global Market Attractiveness Analysis By End-Use Channel
  • Figure 22: Global Market Value (USD Million) Share and BPS Analysis by Region, 2025 and 2035
  • Figure 23: Global Market Y-o-Y Growth Comparison by Region, 2025-2035
  • Figure 24: Global Market Attractiveness Analysis by Region
  • Figure 25: North America Market Incremental $ Opportunity, 2025-2035
  • Figure 26: Latin America Market Incremental $ Opportunity, 2025-2035
  • Figure 27: Europe Market Incremental $ Opportunity, 2025-2035
  • Figure 28: East Asia Market Incremental $ Opportunity, 2025-2035
  • Figure 29: South Asia Market Incremental $ Opportunity, 2025-2035
  • Figure 30: Oceania Market Incremental $ Opportunity, 2025-2035
  • Figure 31: MEA Market Incremental $ Opportunity, 2025-2035
  • Figure 32: North America Market Value Share and BPS Analysis by Country, 2025 and 2035
  • Figure 33: North America Market Value Share and BPS Analysis By Product Format, 2025 and 2035
  • Figure 34: North America Market Y-o-Y Growth Comparison By Product Format, 2025-2035
  • Figure 35: North America Market Attractiveness Analysis By Product Format
  • Figure 36: North America Market Value Share and BPS Analysis By Solubility Type, 2025 and 2035
  • Figure 37: North America Market Y-o-Y Growth Comparison By Solubility Type, 2025-2035
  • Figure 38: North America Market Attractiveness Analysis By Solubility Type
  • Figure 39: North America Market Value Share and BPS Analysis By Pod Material, 2025 and 2035
  • Figure 40: North America Market Y-o-Y Growth Comparison By Pod Material, 2025-2035
  • Figure 41: North America Market Attractiveness Analysis By Pod Material
  • Figure 42: North America Market Value Share and BPS Analysis By Activation Method, 2025 and 2035
  • Figure 43: North America Market Y-o-Y Growth Comparison By Activation Method, 2025-2035
  • Figure 44: North America Market Attractiveness Analysis By Activation Method
  • Figure 45: North America Market Value Share and BPS Analysis By Application, 2025 and 2035
  • Figure 46: North America Market Y-o-Y Growth Comparison By Application, 2025-2035
  • Figure 47: North America Market Attractiveness Analysis By Application
  • Figure 48: North America Market Value Share and BPS Analysis By End-Use Channel, 2025 and 2035
  • Figure 49: North America Market Y-o-Y Growth Comparison By End-Use Channel, 2025-2035
  • Figure 50: North America Market Attractiveness Analysis By End-Use Channel
  • Figure 51: Latin America Market Value Share and BPS Analysis by Country, 2025 and 2035
  • Figure 52: Latin America Market Value Share and BPS Analysis By Product Format, 2025 and 2035
  • Figure 53: Latin America Market Y-o-Y Growth Comparison By Product Format, 2025-2035
  • Figure 54: Latin America Market Attractiveness Analysis By Product Format
  • Figure 55: Latin America Market Value Share and BPS Analysis By Solubility Type, 2025 and 2035
  • Figure 56: Latin America Market Y-o-Y Growth Comparison By Solubility Type, 2025-2035
  • Figure 57: Latin America Market Attractiveness Analysis By Solubility Type
  • Figure 58: Latin America Market Value Share and BPS Analysis By Pod Material, 2025 and 2035
  • Figure 59: Latin America Market Y-o-Y Growth Comparison By Pod Material, 2025-2035
  • Figure 60: Latin America Market Attractiveness Analysis By Pod Material
  • Figure 61: Latin America Market Value Share and BPS Analysis By Activation Method, 2025 and 2035
  • Figure 62: Latin America Market Y-o-Y Growth Comparison By Activation Method, 2025-2035
  • Figure 63: Latin America Market Attractiveness Analysis By Activation Method
  • Figure 64: Latin America Market Value Share and BPS Analysis By Application, 2025 and 2035
  • Figure 65: Latin America Market Y-o-Y Growth Comparison By Application, 2025-2035
  • Figure 66: Latin America Market Attractiveness Analysis By Application
  • Figure 67: Latin America Market Value Share and BPS Analysis By End-Use Channel, 2025 and 2035
  • Figure 68: Latin America Market Y-o-Y Growth Comparison By End-Use Channel, 2025-2035
  • Figure 69: Latin America Market Attractiveness Analysis By End-Use Channel
  • Figure 70: Europe Market Value Share and BPS Analysis by Country, 2025 and 2035
  • Figure 71: Europe Market Value Share and BPS Analysis By Product Format, 2025 and 2035
  • Figure 72: Europe Market Y-o-Y Growth Comparison By Product Format, 2025-2035
  • Figure 73: Europe Market Attractiveness Analysis By Product Format
  • Figure 74: Europe Market Value Share and BPS Analysis By Solubility Type, 2025 and 2035
  • Figure 75: Europe Market Y-o-Y Growth Comparison By Solubility Type, 2025-2035
  • Figure 76: Europe Market Attractiveness Analysis By Solubility Type
  • Figure 77: Europe Market Value Share and BPS Analysis By Pod Material, 2025 and 2035
  • Figure 78: Europe Market Y-o-Y Growth Comparison By Pod Material, 2025-2035
  • Figure 79: Europe Market Attractiveness Analysis By Pod Material
  • Figure 80: Europe Market Value Share and BPS Analysis By Activation Method, 2025 and 2035
  • Figure 81: Europe Market Y-o-Y Growth Comparison By Activation Method, 2025-2035
  • Figure 82: Europe Market Attractiveness Analysis By Activation Method
  • Figure 83: Europe Market Value Share and BPS Analysis By Application, 2025 and 2035
  • Figure 84: Europe Market Y-o-Y Growth Comparison By Application, 2025-2035
  • Figure 85: Europe Market Attractiveness Analysis By Application
  • Figure 86: Europe Market Value Share and BPS Analysis By End-Use Channel, 2025 and 2035
  • Figure 87: Europe Market Y-o-Y Growth Comparison By End-Use Channel, 2025-2035
  • Figure 88: Europe Market Attractiveness Analysis By End-Use Channel
  • Figure 89: East Asia Market Value Share and BPS Analysis by Country, 2025 and 2035
  • Figure 90: East Asia Market Value Share and BPS Analysis By Product Format, 2025 and 2035
  • Figure 91: East Asia Market Y-o-Y Growth Comparison By Product Format, 2025-2035
  • Figure 92: East Asia Market Attractiveness Analysis By Product Format
  • Figure 93: East Asia Market Value Share and BPS Analysis By Solubility Type, 2025 and 2035
  • Figure 94: East Asia Market Y-o-Y Growth Comparison By Solubility Type, 2025-2035
  • Figure 95: East Asia Market Attractiveness Analysis By Solubility Type
  • Figure 96: East Asia Market Value Share and BPS Analysis By Pod Material, 2025 and 2035
  • Figure 97: East Asia Market Y-o-Y Growth Comparison By Pod Material, 2025-2035
  • Figure 98: East Asia Market Attractiveness Analysis By Pod Material
  • Figure 99: East Asia Market Value Share and BPS Analysis By Activation Method, 2025 and 2035
  • Figure 100: East Asia Market Y-o-Y Growth Comparison By Activation Method, 2025-2035
  • Figure 101: East Asia Market Attractiveness Analysis By Activation Method
  • Figure 102: East Asia Market Value Share and BPS Analysis By Application, 2025 and 2035
  • Figure 103: East Asia Market Y-o-Y Growth Comparison By Application, 2025-2035
  • Figure 104: East Asia Market Attractiveness Analysis By Application
  • Figure 105: East Asia Market Value Share and BPS Analysis By End-Use Channel, 2025 and 2035
  • Figure 106: East Asia Market Y-o-Y Growth Comparison By End-Use Channel, 2025-2035
  • Figure 107: East Asia Market Attractiveness Analysis By End-Use Channel
  • Figure 108: South Asia Market Value Share and BPS Analysis by Country, 2025 and 2035
  • Figure 109: South Asia Market Value Share and BPS Analysis By Product Format, 2025 and 2035
  • Figure 110: South Asia Market Y-o-Y Growth Comparison By Product Format, 2025-2035
  • Figure 111: South Asia Market Attractiveness Analysis By Product Format
  • Figure 112: South Asia Market Value Share and BPS Analysis By Solubility Type, 2025 and 2035
  • Figure 113: South Asia Market Y-o-Y Growth Comparison By Solubility Type, 2025-2035
  • Figure 114: South Asia Market Attractiveness Analysis By Solubility Type
  • Figure 115: South Asia Market Value Share and BPS Analysis By Pod Material, 2025 and 2035
  • Figure 116: South Asia Market Y-o-Y Growth Comparison By Pod Material, 2025-2035
  • Figure 117: South Asia Market Attractiveness Analysis By Pod Material
  • Figure 118: South Asia Market Value Share and BPS Analysis By Activation Method, 2025 and 2035
  • Figure 119: South Asia Market Y-o-Y Growth Comparison By Activation Method, 2025-2035
  • Figure 120: South Asia Market Attractiveness Analysis By Activation Method
  • Figure 121: South Asia Market Value Share and BPS Analysis By Application, 2025 and 2035
  • Figure 122: South Asia Market Y-o-Y Growth Comparison By Application, 2025-2035
  • Figure 123: South Asia Market Attractiveness Analysis By Application
  • Figure 124: South Asia Market Value Share and BPS Analysis By End-Use Channel, 2025 and 2035
  • Figure 125: South Asia Market Y-o-Y Growth Comparison By End-Use Channel, 2025-2035
  • Figure 126: South Asia Market Attractiveness Analysis By End-Use Channel
  • Figure 127: Oceania Market Value Share and BPS Analysis by Country, 2025 and 2035
  • Figure 128: Oceania Market Value Share and BPS Analysis By Product Format, 2025 and 2035
  • Figure 129: Oceania Market Y-o-Y Growth Comparison By Product Format, 2025-2035
  • Figure 130: Oceania Market Attractiveness Analysis By Product Format
  • Figure 131: Oceania Market Value Share and BPS Analysis By Solubility Type, 2025 and 2035
  • Figure 132: Oceania Market Y-o-Y Growth Comparison By Solubility Type, 2025-2035
  • Figure 133: Oceania Market Attractiveness Analysis By Solubility Type
  • Figure 134: Oceania Market Value Share and BPS Analysis By Pod Material, 2025 and 2035
  • Figure 135: Oceania Market Y-o-Y Growth Comparison By Pod Material, 2025-2035
  • Figure 136: Oceania Market Attractiveness Analysis By Pod Material
  • Figure 137: Oceania Market Value Share and BPS Analysis By Activation Method, 2025 and 2035
  • Figure 138: Oceania Market Y-o-Y Growth Comparison By Activation Method, 2025-2035
  • Figure 139: Oceania Market Attractiveness Analysis By Activation Method
  • Figure 140: Oceania Market Value Share and BPS Analysis By Application, 2025 and 2035
  • Figure 141: Oceania Market Y-o-Y Growth Comparison By Application, 2025-2035
  • Figure 142: Oceania Market Attractiveness Analysis By Application
  • Figure 143: Oceania Market Value Share and BPS Analysis By End-Use Channel, 2025 and 2035
  • Figure 144: Oceania Market Y-o-Y Growth Comparison By End-Use Channel, 2025-2035
  • Figure 145: Oceania Market Attractiveness Analysis By End-Use Channel
  • Figure 146: MEA Market Value Share and BPS Analysis by Country, 2025 and 2035
  • Figure 147: MEA Market Value Share and BPS Analysis By Product Format, 2025 and 2035
  • Figure 148: MEA Market Y-o-Y Growth Comparison By Product Format, 2025-2035
  • Figure 149: MEA Market Attractiveness Analysis By Product Format
  • Figure 150: MEA Market Value Share and BPS Analysis By Solubility Type, 2025 and 2035
  • Figure 151: MEA Market Y-o-Y Growth Comparison By Solubility Type, 2025-2035
  • Figure 152: MEA Market Attractiveness Analysis By Solubility Type
  • Figure 153: MEA Market Value Share and BPS Analysis By Pod Material, 2025 and 2035
  • Figure 154: MEA Market Y-o-Y Growth Comparison By Pod Material, 2025-2035
  • Figure 155: MEA Market Attractiveness Analysis By Pod Material
  • Figure 156: MEA Market Value Share and BPS Analysis By Activation Method, 2025 and 2035
  • Figure 157: MEA Market Y-o-Y Growth Comparison By Activation Method, 2025-2035
  • Figure 158: MEA Market Attractiveness Analysis By Activation Method
  • Figure 159: MEA Market Value Share and BPS Analysis By Application, 2025 and 2035
  • Figure 160: MEA Market Y-o-Y Growth Comparison By Application, 2025-2035
  • Figure 161: MEA Market Attractiveness Analysis By Application
  • Figure 162: MEA Market Value Share and BPS Analysis By End-Use Channel, 2025 and 2035
  • Figure 163: MEA Market Y-o-Y Growth Comparison By End-Use Channel, 2025-2035
  • Figure 164: MEA Market Attractiveness Analysis By End-Use Channel
  • Figure 165: Global Market - Tier Structure Analysis
  • Figure 166: Global Market - Company Share Analysis

Frequently Asked Questions

How big is the concentrate pods market in 2025?

The global concentrate pods market is estimated to be valued at USD 1.8 billion in 2025.

What will be the size of the concentrate pods market in 2035?

The market size for the concentrate pods market is projected to reach USD 3.6 billion by 2035.

How much will be the concentrate pods market growth between 2025 and 2035?

The concentrate pods market is expected to grow at a CAGR of 7.2% between 2025 and 2035.

What are the key product types in the concentrate pods market?

The key product types in the concentrate pods market include liquid pods, powder pods, and gel-based pods.

Which product segment is expected to contribute significant share in the concentrate pods market in 2025?

In terms of product type, the liquid pods segment is expected to account for the highest share of 46.5% in the concentrate pods market in 2025

Explore Similar Insights

Future Market Insights

Concentrate Pods Market