
- Market Size (2026)
- USD 54.9 Bn
- Forecast (2036)
- USD 81.3 Bn
- CAGR (2026 to 2036)
- 4.0%
How big is the Culinary Sauce Market in 2026?
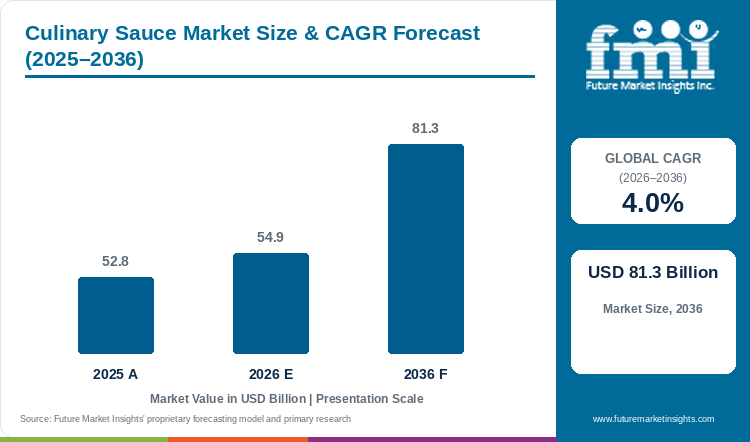
The Culinary Sauce Market is projected to reach USD 81.3 billion by 2036, growing at a 4.0% CAGR from 2026 to 2036. FMI estimates the market at USD 54.9 billion in 2026, after it was valued at USD 52.8 billion in 2025. Packaged sauces keep gaining shelf space in Asia and emerging markets, while mature Western markets see flat volumes [1]. Revenue growth therefore comes more from price, premium lines and emerging-market volume than from higher use in developed markets.
Customs data for soy sauce, ketchup and other tomato sauces show where trade is concentrated. China reported soy sauce exports of USD 223.9 million in 2025 [7]. The Netherlands followed at USD 218.6 million and Japan at USD 90.3 million [7]. The US exported USD 389.5 million of ketchup and tomato sauces, behind only Italy at USD 520.2 million [9]. Combined imports of both sauces reach USD 605.3 million in the US and USD 103.4 million in Mexico [8][10]. They are USD 42.8 million in China and only USD 6.7 million in India [8][10]. Combined imports in the US are therefore about 90 times those in India.
Key Market Trends & Insights
- Ownership of sauce brands is moving toward flavour specialists that buy established regional and global brands. McCormick agreed on 31 March 2026 to combine Unilever Foods with its own business [19]. The combined portfolio has USD 20.0 billion of fiscal 2025 revenue [19]. McCormick also raised its stake in McCormick de Mexico to 75.0% on 2 January 2026 [20]. Kraft Heinz paused its planned separation in February 2026 and still cited the pause on 4 November 2026 [6][18].
- Asian sauce makers are expanding abroad: Haitian Flavouring sells in more than 80 countries and regions, set up an overseas production base in 2025 and listed in Hong Kong in June 2025 [3]. These overseas supply lines give Western retailers more choice in soy and oyster sauces.
- Premium and global flavours are carrying growth where volumes are flat. Unilever said Hellmann's grew by a mid-single-digit rate in 2025, led by volume and by emerging markets [4], and an Indian food group's move into Capital Foods, owner of the Ching's Secret brand, points the same way [5].
Regional Highlights
- In Asia Pacific, Haitian Flavouring raised 2025 revenue by 7.3% to RMB 28.87 billion, with soy sauce revenue up 8.6% [3]. In India, a large food group raised its Capital Foods stake to 80.0% on 1 September 2026 [5].
- In North America, US pasta and cooking sauce volume was stagnant in May 2026 [1], and Kraft Heinz reported lower sauce volume and mix in the third quarter of 2026 [18]. In Europe, McCormick's EMEA Consumer sales grew 3.5% organically in fiscal 2025 [2].
Culinary Sauce Market Size and Forecast
Table 1: Culinary Sauce Market Size and Forecast
| Market size and forecast | Value |
|---|---|
| Market size in 2025 | USD 52.8 billion |
| Estimated market size in 2026 | USD 54.9 billion |
| Projected market size by 2036 | USD 81.3 billion |
| CAGR from 2026 to 2036 | 4.0% |
Source: Future Market Insights analysis of the culinary sauce market, 2026.
Analyst Perspective
“Households buy sauces for flavour and convenience, and most of the sales growth now comes from emerging-market volume and premium lines. Producers with local plants and strong brands can pass cost increases to buyers more easily than makers of generic sauces, while soy, tomato and chilli bases share ingredients with commodity markets, so crop and freight costs move margins. Foodservice buyers are the price-sensitive side of the market because they can switch to bulk or private-label supply.”
- Nandini Roy Choudhury, Principal Consultant, FMI
How is the Culinary Sauce Market segmented?
- By product type: Soy sauces, Hot sauces, Barbecue sauces, Oyster sauces, Pasta and tomato sauces, Others.
- By form: Wet sauces, Dry sauces and mixes.
- By end user: Households, Food processors and manufacturers, HoReCa.
- By region: North America, Latin America, Europe, East Asia, South Asia, Oceania, Middle East and Africa.
Why do Soy sauces lead by Product Type in the Culinary Sauce Market in 2026?
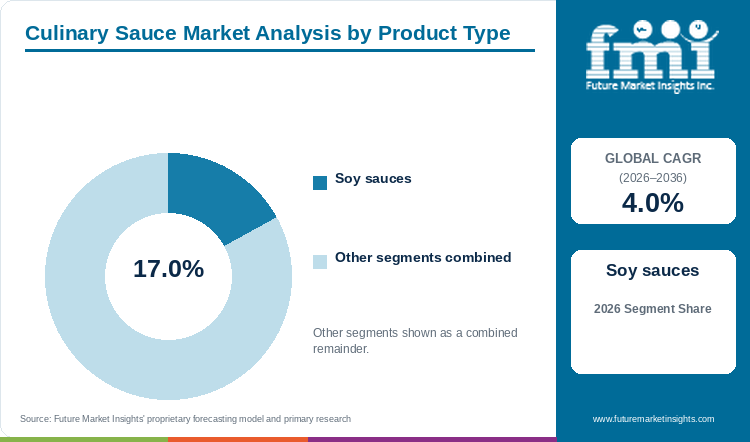
Soy sauces lead the Culinary Sauce Market by product type with a 17.0% share in 2026.
Soy sauce is used in cooking, marinades and table seasoning across Asia. Haitian Flavouring alone reported soy sauce revenue of RMB 14.93 billion in 2025, up 8.6% [3]. A Japanese soy sauce maker began brewing at its third US plant in May 2026 to meet growing North American demand [22]. Pasta and tomato sauces, hot sauces, barbecue sauces, oyster sauces and others hold the remaining 83.0%, and these types are more fragmented by country. Oyster sauce sales at Haitian rose 5.5% in 2025 [3], while stagnant pasta and cooking sauce volumes in the United States [1] limit the size of the tomato-based group.
Table 2: Product Type, 2026 Share
| Leading Share | 2026 market share |
|---|---|
| Soy sauces | 17.0% |
| All Other Segments Combined Share | 83.0% |
Source: Future Market Insights analysis of the culinary sauce market, 2026.
Why do Wet sauces lead by Form in the Culinary Sauce Market in 2026?
Wet sauces account for 76.0% of the Culinary Sauce Market by form in 2026.
Soy sauce, ketchup, tomato puree and chilli sauce are all sold as liquids or pastes and are ready to use. Haitian Flavouring's 2025 soy sauce revenue of RMB 14.93 billion and oyster sauce revenue of RMB 4.87 billion are both liquid products [3]. Dry sauces and mixes hold the remaining 24.0%. McCormick's Consumer segment, which includes seasoning mixes, had sales of USD 3,950 million in fiscal 2025 [2].
Table 3: Form, 2026 Share
| Leading Share | 2026 market share |
|---|---|
| Wet sauces | 76.0% |
| All Other Segments Combined Share | 24.0% |
Source: Future Market Insights analysis of the culinary sauce market, 2026.
Why do Households lead by End User in the Culinary Sauce Market in 2026?
Households account for 71.0% of the Culinary Sauce Market by end user in 2026.
Households buy sauces through retail packs, where Hellmann's grew by a mid-single-digit rate in 2025 [4]. Unilever Food Solutions, which sells to foodservice, was flat in the same year [4]. Food processors and HoReCa hold the remaining 29.0%. McCormick's Flavor Solutions segment grew organically by 1.1% in fiscal 2025 against 2.4% for its Consumer segment [2].
Table 4: End User, 2026 Share
| Leading Share | 2026 market share |
|---|---|
| Households | 71.0% |
| All Other Segments Combined Share | 29.0% |
Source: Future Market Insights analysis of the culinary sauce market, 2026.
What are the key drivers, restraints and opportunities?
Driver
Emerging-market demand for packaged sauces. Packaged sauce use is rising in Asia and other emerging markets, and Unilever said its Foods growth of 2.5% in 2025 came mainly from emerging markets [4]. Haitian Flavouring's total revenue rose 7.3% to RMB 28.87 billion in 2025 [3].
Brand investment in flavour and premium lines. Large producers are putting more money behind sauce brands: Kraft Heinz announced about USD 600 million of added marketing, sales and R&D spending in February 2026 and pointed to its Taste Elevation brands as a growth area [6]. The spending follows the premium lines that are still growing while volumes stay flat [4].
Restraint
Flat volumes in developed markets. Sauce use in mature markets is no longer growing. Innova Market Insights said pasta and cooking sauce volume in the United States was stagnant in May 2026, with weaker uptake among younger buyers [1], Kraft Heinz net sales fell 3.5% in 2025 [6] and 2.0% in the third quarter of 2026 [18], and Unilever reported flat Foods sales in developed markets [4].
Cost pressure and price resistance. Price increases have limited room to rise: McCormick's Flavor Solutions sales were flat at USD 2,890 million in fiscal 2025, and organic growth of 1.1% came from price (1.3%) while volume and mix fell 0.2% [2].
Opportunity
Portfolio moves in India and Mexico. Large buyers are paying for local sauce brands: Tata Consumer Products owns 80.0% of Capital Foods, which sells Ching's Secret and Smith & Jones sauces, noodles and pastes [5], and McCormick raised its stake in McCormick de Mexico to 75.0% on 2 January 2026 [20], which it expects to add 11.0% to 13.0% to fiscal 2026 net sales [2]. Local brands with national distribution give acquirers a faster route into growing markets.
Overseas expansion of Asian sauce makers. Asian producers are adding capacity abroad. Haitian Flavouring set up an overseas production base in 2025 [3], and Kikkoman began brewing soy sauce at its third US plant in May 2026 [22]. Local production lowers freight and tariff costs and lets buyers qualify sauces under local food safety audits.
Culinary Sauce Market by Country (2026 to 2036)
Table 5: Culinary Sauce Market Country Growth Forecast
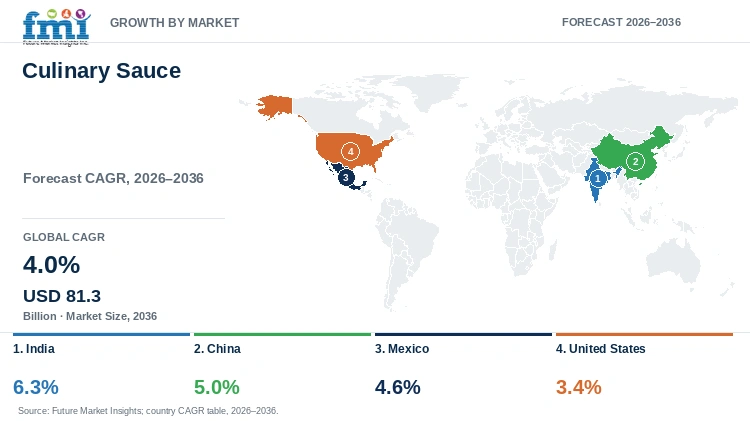
| Country | CAGR, 2026 to 2036 |
|---|---|
| India | 6.3% |
| China | 5.0% |
| Mexico | 4.6% |
| United States | 3.4% |
Source: Future Market Insights analysis of the culinary sauce market, 2026.
India
India has the fastest forecast growth among the profiled countries at 6.3% a year. Tata Consumer Products raised its holding in Capital Foods, the maker of Ching's Secret and Smith & Jones, to 80.0% on 1 September 2026 [5]. The brands span sauces, noodles, soups, chutneys, masalas and cooking pastes [5]. Tata still has to buy the remaining 20.0% of Capital Foods [5]. It earlier said the balance would follow within three years of the first purchase [5]. Rising demand for Chinese-style and ready-to-cook sauces from a small base supports the high rate.
Soy sauce imports show demand building from a small base. India imported 3.6 thousand tonnes in 2025, up 20.4% on 2024 [15][16]. Value rose 14.0% to USD 5.5 million [15][16]. China supplied 76.2% of the volume and Japan 17.5% [15]. Chinese lots entered at USD 1,627 per tonne, 80.4% above China's average export price of USD 902 [7][15].
India compares with the other profiled countries in three ways. Its soy sauce imports equal 28.6% of the Mexican volume and 4.1% of the US volume [8][15]. India exports more ketchup and tomato sauce than it imports, at 6.5 thousand tonnes against 0.7 thousand tonnes [9][10]. Like the US, which takes 50.5% of its soy sauce from China, India relies on one origin [11][15]. Imports of 3.6 thousand tonnes are small, so the 6.3% forecast rests on domestic producers such as Capital Foods [5][15].
China
China is forecast to grow 5.0% a year. Haitian Flavouring reported 2025 revenue of RMB 28.87 billion, up 7.3%, with oyster sauce bringing in RMB 4.87 billion and seasoning sauce RMB 2.92 billion alongside soy sauce [3]. Haitian's 7.3% revenue growth in 2025 exceeds the 5.0% forecast for the country, which points to share gains by large brands over small regional makers. It also set up an overseas production base in 2025 [3].
Export scale sets China apart. It reported soy sauce exports of 248.2 thousand tonnes in 2025 worth USD 223.9 million, the highest value among exporters [7]. Imports were only 14.1 thousand tonnes in the same year [8]. The average export price was USD 902 per tonne against USD 1,904 for imports, less than half the import price [7][8].
Imports come from two main origins. Singapore supplied 42.3% of the volume at USD 2,323 per tonne and Japan 39.3% at USD 1,576 [17]. Together they supplied 81.6% of import volume [17]. China leads supply to the US and India with 50.5% and 76.2% of their soy sauce import volume [11][15]. Mexico takes 24.2% of its volume from China, second to the US [14]. Chinese makers therefore compete with premium imports at home. The same Chinese lots sell for USD 1,033 per tonne in the US and USD 1,627 in India [11][15].
Mexico
Mexico is forecast to grow 4.6% a year, and McCormick completed the purchase of an additional 25% of McCormick de Mexico on 2 January 2026, raising its ownership to 75% [20]. McCormick's third-quarter 2026 net sales rose 17.0%, and McCormick de Mexico contributed 14.0% to that increase [21]. Local salsas, hot sauces and seasonings sit alongside imported condiments.
Mexico is a net importer of both main sauce categories. It imported 50.4 thousand tonnes of ketchup and tomato sauces in 2025 [10]. Its exports were only 9.6 thousand tonnes [9][10]. The US supplied 97.8% of that volume [13]. Italian lots supplied only 1.4% of the volume at 2.2 times the US-origin price [13]. Mexican buyers paid USD 1,594 per tonne for US-origin lots, 43.1% above the average US export price [9][13].
Soy sauce follows the same pattern. Mexico imported 12.5 thousand tonnes in 2025 and exported almost none [7][8]. The US supplied 75.0% of the volume and China 24.2% [14]. US-origin lots cost USD 1,910 per tonne and Chinese lots USD 1,002 [14]. Mexico buys mainly from the US, where India buys mainly from China. Unlike China, Mexico sells almost nothing abroad. Mexican soy sauce imports are 3.5 times the Indian volume [8]. A buyer switching from US-origin to Chinese lots saves USD 908 per tonne [14].
United States
The United States is forecast to grow 3.4% a year. Innova Market Insights reported stagnant US pasta and cooking sauce volume in May 2026 [1]. In February 2026 Kraft Heinz paused work on its planned separation and announced about USD 600 million of added spending on marketing, sales and R&D [6].
The US is a bulk exporter and a premium importer of ketchup and tomato sauces. It shipped 349.7 thousand tonnes in 2025 at USD 1,114 per tonne, the highest volume among reporting countries [9]. It imported 157.4 thousand tonnes at USD 3,056 per tonne, which is 2.7 times the export price [10]. Italy supplied 75.5% of that volume at USD 3,283 per tonne [12]. Premium positioning therefore lifts revenue faster than tonnage in the US.
Soy sauce shows a different balance. The US exported 41.7 thousand tonnes worth USD 70.8 million, fourth by value [7]. It imported 86.6 thousand tonnes, which is 2.1 times that volume [7][8]. China supplied 50.5% of the import volume at USD 1,033 per tonne and Japan 7.3% at USD 2,491 [11]. Mexico reports imports of 49.3 thousand tonnes of US tomato sauce, or 14.1% of US export volume [9][13]. That outlet matters while US pasta and cooking sauce volumes are stagnant [1]. Domestic brewing capacity is also rising, as a Japanese maker's Jefferson plant is scheduled to ship soy sauce from October 2026 [22].
Who are the notable companies in the Culinary Sauce Market?
Notable companies in the Culinary Sauce Market include Kraft Heinz, Unilever, McCormick, Foshan Haitian and Tata Consumer.
Culinary sauce suppliers differ most in where they brew and fill their products and in which brands they own. China exports soy sauce at USD 902 per tonne and the US exports tomato sauce at USD 1,114 per tonne [7][9]. Kraft Heinz saw 2025 net sales fall 3.5% to USD 24.9 billion and paused work on its planned separation in February 2026 [6]. Its net sales fell 2.0% in the third quarter of 2026, and it still cited the pause on 4 November 2026 [18]. Unilever's Foods underlying sales grew 2.5% in 2025 and Hellmann's grew by a mid-single-digit rate [4]. Unilever agreed on 31 March 2026 to combine its Foods business with McCormick [19].
Foshan Haitian Flavouring and Food reported 2025 revenue of RMB 28.87 billion, up 7.3%, and set up an overseas production base in 2025 [3]. It raised its British Retail Consortium rating from Grade B to Grade A in 2025 [3]. Kikkoman opened its third US plant in Jefferson, Wisconsin on 18 September 2026 [22]. The plant is a planned investment of about USD 560.0 million over 10 years, with shipments scheduled from October [22]. Buyers qualifying these suppliers look at food safety certification, flavour consistency and cost [3].
McCormick reported fiscal 2025 sales of USD 6.8 billion and raised its stake in McCormick de Mexico to 75.0% on 2 January 2026 [2][20]. The Mexican business is expected to add 11.0% to 13.0% to fiscal 2026 net sales [2]. Tata Consumer Products raised its Capital Foods stake to 80.0% on 1 September 2026 [5]. Capital Foods sells Ching's Secret and Smith & Jones sauces, noodles and pastes [5].
Key Developments in the Culinary Sauce Market
- On 1 September 2026 Tata Consumer Products raised its stake in Capital Foods to 80.0% [5]. Capital Foods sells Ching's Secret and Smith & Jones sauces, noodles and pastes.
- On 31 March 2026 McCormick and Unilever agreed to combine Unilever Foods with McCormick [19]. The transaction is expected to close by mid-2027, subject to McCormick shareholder approval and regulatory approvals.
- On 18 September 2026 Kikkoman opened its third US plant in Jefferson, Wisconsin [22]. Soy sauce brewing began in May 2026, shipments are scheduled for October and the planned investment is about USD 560.0 million over 10 years.
Key Players in the Culinary Sauce Market
- The Kraft Heinz Company
- Unilever PLC
- McCormick & Company, Inc.
- Foshan Haitian Flavouring and Food Company Ltd.
- Tata Consumer Products Limited
- Kikkoman Corporation
Culinary Sauce Market Report Scope
Table 6: Culinary Sauce Market Report Scope
| Coverage field | Report scope |
|---|---|
| Market definition | Packaged culinary sauces, including soy, hot, barbecue, oyster, pasta and tomato sauces, sold to households, food processors and food service operators, valued at manufacturer selling prices. Dry seasonings, dressings and stand-alone spices are excluded. |
| Product Type | Soy sauces; Hot sauces; Barbecue sauces; Oyster sauces; Pasta and tomato sauces; Others |
| Form | Wet sauces; Dry sauces and mixes |
| End User | Households; Food processors and manufacturers; HoReCa |
| Regions and profiled countries | North America, Latin America, Europe, East Asia, South Asia, Oceania, Middle East and Africa. Profiled countries: India, China, Mexico, United States |
| Companies covered | The Kraft Heinz Company; Unilever PLC; McCormick & Company, Inc.; Foshan Haitian Flavouring and Food Company Ltd.; Tata Consumer Products Limited; Kikkoman Corporation |
| Quantitative Units | USD billion |
Culinary Sauce Market by Segments
Culinary Sauce Market segmented by Product Type:
- Soy sauces
- Hot sauces
- Barbecue sauces
- Oyster sauces
- Pasta and tomato sauces
- Others
Culinary Sauce Market segmented by Form:
- Wet sauces
- Dry sauces and mixes
Culinary Sauce Market segmented by End User:
- Households
- Food processors and manufacturers
- HoReCa
Culinary Sauce Market by Region
- North America
- Latin America
- Europe
- East Asia
- South Asia
- Oceania
- Middle East
- Africa
- India
- China
- Mexico
- United States
Research Sources and Bibliography
- [1] Innova Market Insights. (2026, May 8). Flavor, Heritage, and a New Generation of Buyers: What's Driving the US Cooking Sauces Market. https://www.innovamarketinsights.com/?p=65058
- [2] McCormick & Company. (2026, January 22). McCormick Reports Strong 2025 Financial Results and Provides 2026 Outlook. https://ir.mccormick.com/news-releases/news-release-details/mccormick-reports-strong-2025-financial-results-and-provides
- [3] The Standard (Hong Kong). (2026, March 27). Haitian Flavouring Releases 2025 Annual Results. https://www.thestandard.com.hk/spotlight-business/article/327930/Haitian-Flavouring-Releases-2025-Annual-Results-Multi-Dimensional-Category-Growth-Accelerated-Globalization-High-Quality-Growth-Highlights-Long-Term-Value
- [4] Food Ingredients First. (2026, February 13). Unilever Foods growth and power brands, full-year 2025 results. https://www.foodingredientsfirst.com/news/unilever-foods-growth-power-brands.html
- [5] Free Press Journal. (2026, September 1). Tata Consumer raises Capital Foods stake, acquires additional 5% holding. https://www.freepressjournal.in/business/tata-consumer-raises-capital-foods-stake-acquires-additional-5-holding
- [6] The Kraft Heinz Company. (2026, February 11). Kraft Heinz Reports Fourth Quarter and Full Year 2025 Results. https://news.kraftheinzcompany.com/press-releases-details/2026/Kraft-Heinz-Reports-Fourth-Quarter-and-Full-Year-2025-Results/default.aspx
- [7] World Bank, World Integrated Trade Solution (UN Comtrade data). (2026). Soya sauce exports by country, 2025 (HS 210310). https://wits.worldbank.org/trade/comtrade/en/country/ALL/year/2025/tradeflow/Exports/partner/WLD/product/210310
- [8] World Bank, World Integrated Trade Solution (UN Comtrade data). (2026). Soya sauce imports by country, 2025 (HS 210310). https://wits.worldbank.org/trade/comtrade/en/country/ALL/year/2025/tradeflow/Imports/partner/WLD/product/210310
- [9] World Bank, World Integrated Trade Solution (UN Comtrade data). (2026). Tomato ketchup and other tomato sauces exports by country, 2025 (HS 210320). https://wits.worldbank.org/trade/comtrade/en/country/ALL/year/2025/tradeflow/Exports/partner/WLD/product/210320
- [10] World Bank, World Integrated Trade Solution (UN Comtrade data). (2026). Tomato ketchup and other tomato sauces imports by country, 2025 (HS 210320). https://wits.worldbank.org/trade/comtrade/en/country/ALL/year/2025/tradeflow/Imports/partner/WLD/product/210320
- [11] World Bank, World Integrated Trade Solution (UN Comtrade data). (2026). United States soya sauce imports by partner, 2025 (HS 210310). https://wits.worldbank.org/trade/comtrade/en/country/USA/year/2025/tradeflow/Imports/partner/ALL/product/210310
- [12] World Bank, World Integrated Trade Solution (UN Comtrade data). (2026). United States tomato ketchup and other tomato sauces imports by partner, 2025 (HS 210320). https://wits.worldbank.org/trade/comtrade/en/country/USA/year/2025/tradeflow/Imports/partner/ALL/product/210320
- [13] World Bank, World Integrated Trade Solution (UN Comtrade data). (2026). Mexico tomato ketchup and other tomato sauces imports by partner, 2025 (HS 210320). https://wits.worldbank.org/trade/comtrade/en/country/MEX/year/2025/tradeflow/Imports/partner/ALL/product/210320
- [14] World Bank, World Integrated Trade Solution (UN Comtrade data). (2026). Mexico soya sauce imports by partner, 2025 (HS 210310). https://wits.worldbank.org/trade/comtrade/en/country/MEX/year/2025/tradeflow/Imports/partner/ALL/product/210310
- [15] World Bank, World Integrated Trade Solution (UN Comtrade data). (2026). India soya sauce imports by partner, 2025 (HS 210310). https://wits.worldbank.org/trade/comtrade/en/country/IND/year/2025/tradeflow/Imports/partner/ALL/product/210310
- [16] World Bank, World Integrated Trade Solution (UN Comtrade data). (2026). India soya sauce imports by partner, 2024 (HS 210310). https://wits.worldbank.org/trade/comtrade/en/country/IND/year/2024/tradeflow/Imports/partner/ALL/product/210310
- [17] World Bank, World Integrated Trade Solution (UN Comtrade data). (2026). China soya sauce imports by partner, 2025 (HS 210310). https://wits.worldbank.org/trade/comtrade/en/country/CHN/year/2025/tradeflow/Imports/partner/ALL/product/210310
- [18] The Kraft Heinz Company. (2026, November 4). Kraft Heinz Reports Third Quarter 2026 Results, Updates 2026 Full Year Outlook. https://ir.kraftheinzcompany.com/news/kraft-heinz-reports-third-quarter-2026-results-updates-2026-full-year-outlook/74c712bb-481b-4e0c-9be5-ab25c8395754
- [19] Unilever. (2026, March 31). Unilever announces the combination of Unilever Foods with McCormick to create a global flavour powerhouse with a superior growth profile. https://www.unilever.com/news/press-and-media/press-releases/2026/unilever-announces-the-combination-of-unilever-foods-with-mccormick/
- [20] McCormick & Company. (2026, January 2). McCormick Completes Acquisition of Controlling Interest in McCormick de Mexico. https://ir.mccormick.com/news-releases/news-release-details/mccormick-completes-acquisition-controlling-interest-mccormick
- [21] McCormick & Company. (2026, October 1). McCormick Reports Solid Third Quarter Performance and Reaffirms 2026 Outlook. https://ir.mccormick.com/news-releases/news-release-details/mccormick-reports-solid-third-quarter-performance-and-reaffirms
- [22] Kikkoman Corporation. (2026, September 18). Kikkoman Holds Grand Opening Ceremony for Third U.S. Plant. https://www.kikkoman.com/en/news/2026/20260918_1591.html
Table of Content
Table of Content
- Key Takeaways
- Market Size and CAGR
- Top Growth Driver
- Fastest Growing Segment
- Leading Region
- Key Companies
- Emerging Opportunities
- Executive Summary
- Global Market Outlook
- Demand-side Trends
- Supply-side Trends
- Technology Roadmap Analysis
- Analysis and Recommendations
- Analyst Perspective (What is happening? Why now? What should investors know?)
- Key Questions Answered
- How large is the market?
- What is the CAGR?
- What are key trends?
- Which region dominates?
- Who are the leaders?
Read More...
- Market Overview
- Market Coverage / Taxonomy
- Market Definition / Scope / Limitations
- Research Methodology
- Chapter Orientation
- Analytical Lens and Working Hypotheses
- Market Structure, Signals, and Trend Drivers
- Benchmarking and Cross-market Comparability
- Market Sizing, Forecasting, and Opportunity Mapping
- Research Design and Evidence Framework
- Desk Research Programme (Secondary Evidence)
- Expert Input and Fieldwork (Primary Evidence)
- Tooling, Models, and Reference Databases
- Data Engineering and Model Build
- Quality Assurance and Audit Trail
- Market Background
- Market Dynamics (Drivers, Restraints, Opportunity, Trends)
- Scenario Forecast (Optimistic, Likely, Conservative)
- Impact Analysis
- AI Impact
- Sustainability Impact
- Regulatory Impact
- Technology Impact
- Consumer / Buyer Analysis
- Purchase Drivers
- Adoption Barriers
- Buyer Journey
- Opportunity Map Analysis
- Product Life Cycle Analysis
- Supply Chain Analysis
- Investment Feasibility Matrix
- Value Chain Analysis
- PESTLE and Porter's Analysis
- Regulatory Landscape
- Regional Parent Market Outlook
- Production and Consumption Statistics
- Import and Export Statistics
- Global Market Analysis and Forecast, 2021 to 2036
- Historical Market Size Value (USD Billion) Analysis, 2021 to 2025
- Current and Future Market Size Value (USD Billion) Projections, 2026 to 2036
- Y-o-Y Growth Trend Analysis
- Absolute $ Opportunity Analysis
- Global Market Pricing Analysis, 2021 to 2036
- Global Market Analysis and Forecast, By Product Type, 2021 to 2036
- Introduction / Key Findings
- Historical Market Size Value (USD Billion) Analysis By Product Type, 2021 to 2025
- Current and Future Market Size Value (USD Billion) Analysis and Forecast By Product Type, 2026 to 2036
- Soy sauces
- Hot sauces
- Barbecue sauces
- Oyster sauces
- Pasta and tomato sauces
- Others
- Y-o-Y Growth Trend Analysis By Product Type, 2021 to 2025
- Absolute $ Opportunity Analysis By Product Type, 2026 to 2036
- Global Market Analysis and Forecast, By Form, 2021 to 2036
- Introduction / Key Findings
- Historical Market Size Value (USD Billion) Analysis By Form, 2021 to 2025
- Current and Future Market Size Value (USD Billion) Analysis and Forecast By Form, 2026 to 2036
- Wet sauces
- Dry sauces and mixes
- Y-o-Y Growth Trend Analysis By Form, 2021 to 2025
- Absolute $ Opportunity Analysis By Form, 2026 to 2036
- Global Market Analysis and Forecast, By End User, 2021 to 2036
- Introduction / Key Findings
- Historical Market Size Value (USD Billion) Analysis By End User, 2021 to 2025
- Current and Future Market Size Value (USD Billion) Analysis and Forecast By End User, 2026 to 2036
- Households
- Food processors and manufacturers
- HoReCa
- Y-o-Y Growth Trend Analysis By End User, 2021 to 2025
- Absolute $ Opportunity Analysis By End User, 2026 to 2036
- Global Market Analysis and Forecast, By Region, 2021 to 2036
- Introduction
- Historical Market Size Value (USD Billion) Analysis By Region, 2021 to 2025
- Current Market Size Value (USD Billion) Analysis and Forecast By Region, 2026 to 2036
- North America
- Latin America
- Europe
- East Asia
- South Asia
- Oceania
- Middle East
- Africa
- Market Attractiveness Analysis By Region
- North America Market Analysis and Forecast, By Country, 2021 to 2036
- Historical Market Size Value (USD Billion) Trend Analysis By Market Taxonomy, 2021 to 2025
- Market Size Value (USD Billion) Forecast By Market Taxonomy, 2026 to 2036
- By Country
- By Product Type
- By Form
- By End User
- Market Attractiveness Analysis
- By Country
- By Product Type
- By Form
- By End User
- Key Takeaways
- Latin America Market Analysis and Forecast, By Country
- Historical Market Size Value (USD Billion) Trend Analysis By Market Taxonomy, 2021 to 2025
- Market Size Value (USD Billion) Forecast By Market Taxonomy, 2026 to 2036
- By Country
- By Product Type
- By Form
- By End User
- Market Attractiveness Analysis
- By Country
- By Product Type
- By Form
- By End User
- Key Takeaways
- Europe Market Analysis and Forecast, By Country
- Historical Market Size Value (USD Billion) Trend Analysis By Market Taxonomy, 2021 to 2025
- Market Size Value (USD Billion) Forecast By Market Taxonomy, 2026 to 2036
- By Country
- By Product Type
- By Form
- By End User
- Market Attractiveness Analysis
- By Country
- By Product Type
- By Form
- By End User
- Key Takeaways
- East Asia Market Analysis and Forecast, By Country
- Historical Market Size Value (USD Billion) Trend Analysis By Market Taxonomy, 2021 to 2025
- Market Size Value (USD Billion) Forecast By Market Taxonomy, 2026 to 2036
- By Country
- By Product Type
- By Form
- By End User
- Market Attractiveness Analysis
- By Country
- By Product Type
- By Form
- By End User
- Key Takeaways
- South Asia Market Analysis and Forecast, By Country
- Historical Market Size Value (USD Billion) Trend Analysis By Market Taxonomy, 2021 to 2025
- Market Size Value (USD Billion) Forecast By Market Taxonomy, 2026 to 2036
- By Country
- By Product Type
- By Form
- By End User
- Market Attractiveness Analysis
- By Country
- By Product Type
- By Form
- By End User
- Key Takeaways
- Oceania Market Analysis and Forecast, By Country
- Historical Market Size Value (USD Billion) Trend Analysis By Market Taxonomy, 2021 to 2025
- Market Size Value (USD Billion) Forecast By Market Taxonomy, 2026 to 2036
- By Country
- By Product Type
- By Form
- By End User
- Market Attractiveness Analysis
- By Country
- By Product Type
- By Form
- By End User
- Key Takeaways
- Middle East Market Analysis and Forecast, By Country
- Historical Market Size Value (USD Billion) Trend Analysis By Market Taxonomy, 2021 to 2025
- Market Size Value (USD Billion) Forecast By Market Taxonomy, 2026 to 2036
- By Country
- By Product Type
- By Form
- By End User
- Market Attractiveness Analysis
- By Country
- By Product Type
- By Form
- By End User
- Key Takeaways
- Africa Market Analysis and Forecast, By Country
- Historical Market Size Value (USD Billion) Trend Analysis By Market Taxonomy, 2021 to 2025
- Market Size Value (USD Billion) Forecast By Market Taxonomy, 2026 to 2036
- By Country
- India
- China
- Mexico
- United States
- By Product Type
- By Form
- By End User
- By Country
- Market Attractiveness Analysis
- By Country
- By Product Type
- By Form
- By End User
- Key Takeaways
- Key Countries Market Analysis
- United States
- Pricing Analysis
- Market Share Analysis, 2025
- By Product Type
- By Form
- By End User
- Mexico
- Pricing Analysis
- Market Share Analysis, 2025
- By Product Type
- By Form
- By End User
- India
- Pricing Analysis
- Market Share Analysis, 2025
- By Product Type
- By Form
- By End User
- China
- Pricing Analysis
- Market Share Analysis, 2025
- By Product Type
- By Form
- By End User
- United States
- Market Structure Analysis
- Competition Dashboard
- Competition Benchmarking
- Market Share Analysis of Top Players
- By Regional
- By Product Type
- By Form
- By End User
- Emerging Startups
- Innovation Benchmarking
- Competition Analysis
- Competition Deep Dive
- The Kraft Heinz Company
- Overview
- Product Portfolio
- Profitability by Market Segments
- Sales Footprint
- Strategy Overview
- Marketing Strategy
- Product Strategy
- Channel Strategy
- Unilever PLC
- McCormick & Company, Inc.
- Foshan Haitian Flavouring and Food Company Ltd.
- Tata Consumer Products Limited
- Kikkoman Corporation
- The Kraft Heinz Company
- Case Studies
- Success Stories
- Recent Developments
- Competition Deep Dive
- Assumptions & Acronyms Used
List of Tables
- Table 1: Global Market Value (USD Billion) Forecast by Region, 2021 to 2036
- Table 2: Global Market Value (USD Billion) Forecast by Product Type, 2021 to 2036
- Table 3: Global Market Value (USD Billion) Forecast by Form, 2021 to 2036
- Table 4: Global Market Value (USD Billion) Forecast by End User, 2021 to 2036
- Table 5: North America Market Value (USD Billion) Forecast by Country, 2021 to 2036
- Table 6: North America Market Value (USD Billion) Forecast by Product Type, 2021 to 2036
- Table 7: North America Market Value (USD Billion) Forecast by Form, 2021 to 2036
- Table 8: North America Market Value (USD Billion) Forecast by End User, 2021 to 2036
- Table 9: Latin America Market Value (USD Billion) Forecast by Country, 2021 to 2036
- Table 10: Latin America Market Value (USD Billion) Forecast by Product Type, 2021 to 2036
- Table 11: Latin America Market Value (USD Billion) Forecast by Form, 2021 to 2036
- Table 12: Latin America Market Value (USD Billion) Forecast by End User, 2021 to 2036
- Table 13: Europe Market Value (USD Billion) Forecast by Country, 2021 to 2036
- Table 14: Europe Market Value (USD Billion) Forecast by Product Type, 2021 to 2036
- Table 15: Europe Market Value (USD Billion) Forecast by Form, 2021 to 2036
- Table 16: Europe Market Value (USD Billion) Forecast by End User, 2021 to 2036
- Table 17: East Asia Market Value (USD Billion) Forecast by Country, 2021 to 2036
- Table 18: East Asia Market Value (USD Billion) Forecast by Product Type, 2021 to 2036
- Table 19: East Asia Market Value (USD Billion) Forecast by Form, 2021 to 2036
- Table 20: East Asia Market Value (USD Billion) Forecast by End User, 2021 to 2036
- Table 21: South Asia Market Value (USD Billion) Forecast by Country, 2021 to 2036
- Table 22: South Asia Market Value (USD Billion) Forecast by Product Type, 2021 to 2036
- Table 23: South Asia Market Value (USD Billion) Forecast by Form, 2021 to 2036
- Table 24: South Asia Market Value (USD Billion) Forecast by End User, 2021 to 2036
- Table 25: Oceania Market Value (USD Billion) Forecast by Country, 2021 to 2036
- Table 26: Oceania Market Value (USD Billion) Forecast by Product Type, 2021 to 2036
- Table 27: Oceania Market Value (USD Billion) Forecast by Form, 2021 to 2036
- Table 28: Oceania Market Value (USD Billion) Forecast by End User, 2021 to 2036
- Table 29: Middle East Market Value (USD Billion) Forecast by Country, 2021 to 2036
- Table 30: Middle East Market Value (USD Billion) Forecast by Product Type, 2021 to 2036
- Table 31: Middle East Market Value (USD Billion) Forecast by Form, 2021 to 2036
- Table 32: Middle East Market Value (USD Billion) Forecast by End User, 2021 to 2036
- Table 33: Africa Market Value (USD Billion) Forecast by Country, 2021 to 2036
- Table 34: Africa Market Value (USD Billion) Forecast by Product Type, 2021 to 2036
- Table 35: Africa Market Value (USD Billion) Forecast by Form, 2021 to 2036
- Table 36: Africa Market Value (USD Billion) Forecast by End User, 2021 to 2036
List of Figures
- Figure 1: Global Market Pricing Analysis
- Figure 2: Global Market Value (USD Billion) Forecast 2021-2036
- Figure 3: Global Market Value Share and BPS Analysis by Product Type, 2026 and 2036
- Figure 4: Global Market Y-o-Y Growth Comparison by Product Type, 2026-2036
- Figure 5: Global Market Attractiveness Analysis by Product Type
- Figure 6: Global Market Value Share and BPS Analysis by Form, 2026 and 2036
- Figure 7: Global Market Y-o-Y Growth Comparison by Form, 2026-2036
- Figure 8: Global Market Attractiveness Analysis by Form
- Figure 9: Global Market Value Share and BPS Analysis by End User, 2026 and 2036
- Figure 10: Global Market Y-o-Y Growth Comparison by End User, 2026-2036
- Figure 11: Global Market Attractiveness Analysis by End User
- Figure 12: Global Market Value (USD Billion) Share and BPS Analysis by Region, 2026 and 2036
- Figure 13: Global Market Y-o-Y Growth Comparison by Region, 2026-2036
- Figure 14: Global Market Attractiveness Analysis by Region
- Figure 15: North America Market Incremental Dollar Opportunity, 2026-2036
- Figure 16: Latin America Market Incremental Dollar Opportunity, 2026-2036
- Figure 17: Europe Market Incremental Dollar Opportunity, 2026-2036
- Figure 18: East Asia Market Incremental Dollar Opportunity, 2026-2036
- Figure 19: South Asia Market Incremental Dollar Opportunity, 2026-2036
- Figure 20: Oceania Market Incremental Dollar Opportunity, 2026-2036
- Figure 21: Middle East Market Incremental Dollar Opportunity, 2026-2036
- Figure 22: Africa Market Incremental Dollar Opportunity, 2026-2036
- Figure 23: North America Market Value Share and BPS Analysis by Country, 2026 and 2036
- Figure 24: North America Market Value Share and BPS Analysis by Product Type, 2026 and 2036
- Figure 25: North America Market Y-o-Y Growth Comparison by Product Type, 2026-2036
- Figure 26: North America Market Attractiveness Analysis by Product Type
- Figure 27: North America Market Value Share and BPS Analysis by Form, 2026 and 2036
- Figure 28: North America Market Y-o-Y Growth Comparison by Form, 2026-2036
- Figure 29: North America Market Attractiveness Analysis by Form
- Figure 30: North America Market Value Share and BPS Analysis by End User, 2026 and 2036
- Figure 31: North America Market Y-o-Y Growth Comparison by End User, 2026-2036
- Figure 32: North America Market Attractiveness Analysis by End User
- Figure 33: Latin America Market Value Share and BPS Analysis by Country, 2026 and 2036
- Figure 34: Latin America Market Value Share and BPS Analysis by Product Type, 2026 and 2036
- Figure 35: Latin America Market Y-o-Y Growth Comparison by Product Type, 2026-2036
- Figure 36: Latin America Market Attractiveness Analysis by Product Type
- Figure 37: Latin America Market Value Share and BPS Analysis by Form, 2026 and 2036
- Figure 38: Latin America Market Y-o-Y Growth Comparison by Form, 2026-2036
- Figure 39: Latin America Market Attractiveness Analysis by Form
- Figure 40: Latin America Market Value Share and BPS Analysis by End User, 2026 and 2036
- Figure 41: Latin America Market Y-o-Y Growth Comparison by End User, 2026-2036
- Figure 42: Latin America Market Attractiveness Analysis by End User
- Figure 43: Europe Market Value Share and BPS Analysis by Country, 2026 and 2036
- Figure 44: Europe Market Value Share and BPS Analysis by Product Type, 2026 and 2036
- Figure 45: Europe Market Y-o-Y Growth Comparison by Product Type, 2026-2036
- Figure 46: Europe Market Attractiveness Analysis by Product Type
- Figure 47: Europe Market Value Share and BPS Analysis by Form, 2026 and 2036
- Figure 48: Europe Market Y-o-Y Growth Comparison by Form, 2026-2036
- Figure 49: Europe Market Attractiveness Analysis by Form
- Figure 50: Europe Market Value Share and BPS Analysis by End User, 2026 and 2036
- Figure 51: Europe Market Y-o-Y Growth Comparison by End User, 2026-2036
- Figure 52: Europe Market Attractiveness Analysis by End User
- Figure 53: East Asia Market Value Share and BPS Analysis by Country, 2026 and 2036
- Figure 54: East Asia Market Value Share and BPS Analysis by Product Type, 2026 and 2036
- Figure 55: East Asia Market Y-o-Y Growth Comparison by Product Type, 2026-2036
- Figure 56: East Asia Market Attractiveness Analysis by Product Type
- Figure 57: East Asia Market Value Share and BPS Analysis by Form, 2026 and 2036
- Figure 58: East Asia Market Y-o-Y Growth Comparison by Form, 2026-2036
- Figure 59: East Asia Market Attractiveness Analysis by Form
- Figure 60: East Asia Market Value Share and BPS Analysis by End User, 2026 and 2036
- Figure 61: East Asia Market Y-o-Y Growth Comparison by End User, 2026-2036
- Figure 62: East Asia Market Attractiveness Analysis by End User
- Figure 63: South Asia Market Value Share and BPS Analysis by Country, 2026 and 2036
- Figure 64: South Asia Market Value Share and BPS Analysis by Product Type, 2026 and 2036
- Figure 65: South Asia Market Y-o-Y Growth Comparison by Product Type, 2026-2036
- Figure 66: South Asia Market Attractiveness Analysis by Product Type
- Figure 67: South Asia Market Value Share and BPS Analysis by Form, 2026 and 2036
- Figure 68: South Asia Market Y-o-Y Growth Comparison by Form, 2026-2036
- Figure 69: South Asia Market Attractiveness Analysis by Form
- Figure 70: South Asia Market Value Share and BPS Analysis by End User, 2026 and 2036
- Figure 71: South Asia Market Y-o-Y Growth Comparison by End User, 2026-2036
- Figure 72: South Asia Market Attractiveness Analysis by End User
- Figure 73: Oceania Market Value Share and BPS Analysis by Country, 2026 and 2036
- Figure 74: Oceania Market Value Share and BPS Analysis by Product Type, 2026 and 2036
- Figure 75: Oceania Market Y-o-Y Growth Comparison by Product Type, 2026-2036
- Figure 76: Oceania Market Attractiveness Analysis by Product Type
- Figure 77: Oceania Market Value Share and BPS Analysis by Form, 2026 and 2036
- Figure 78: Oceania Market Y-o-Y Growth Comparison by Form, 2026-2036
- Figure 79: Oceania Market Attractiveness Analysis by Form
- Figure 80: Oceania Market Value Share and BPS Analysis by End User, 2026 and 2036
- Figure 81: Oceania Market Y-o-Y Growth Comparison by End User, 2026-2036
- Figure 82: Oceania Market Attractiveness Analysis by End User
- Figure 83: Middle East Market Value Share and BPS Analysis by Country, 2026 and 2036
- Figure 84: Middle East Market Value Share and BPS Analysis by Product Type, 2026 and 2036
- Figure 85: Middle East Market Y-o-Y Growth Comparison by Product Type, 2026-2036
- Figure 86: Middle East Market Attractiveness Analysis by Product Type
- Figure 87: Middle East Market Value Share and BPS Analysis by Form, 2026 and 2036
- Figure 88: Middle East Market Y-o-Y Growth Comparison by Form, 2026-2036
- Figure 89: Middle East Market Attractiveness Analysis by Form
- Figure 90: Middle East Market Value Share and BPS Analysis by End User, 2026 and 2036
- Figure 91: Middle East Market Y-o-Y Growth Comparison by End User, 2026-2036
- Figure 92: Middle East Market Attractiveness Analysis by End User
- Figure 93: Africa Market Value Share and BPS Analysis by Country, 2026 and 2036
- Figure 94: Africa Market Value Share and BPS Analysis by Product Type, 2026 and 2036
- Figure 95: Africa Market Y-o-Y Growth Comparison by Product Type, 2026-2036
- Figure 96: Africa Market Attractiveness Analysis by Product Type
- Figure 97: Africa Market Value Share and BPS Analysis by Form, 2026 and 2036
- Figure 98: Africa Market Y-o-Y Growth Comparison by Form, 2026-2036
- Figure 99: Africa Market Attractiveness Analysis by Form
- Figure 100: Africa Market Value Share and BPS Analysis by End User, 2026 and 2036
- Figure 101: Africa Market Y-o-Y Growth Comparison by End User, 2026-2036
- Figure 102: Africa Market Attractiveness Analysis by End User
- Figure 103: Global Market - Tier Structure Analysis
- Figure 104: Global Market - Company Share Analysis
Frequently Asked Questions
How big is the culinary sauce market in 2026?
FMI estimates the market at USD 54.9 billion in 2026, up from USD 52.8 billion in 2025. It is forecast to reach USD 81.3 billion by 2036 at a 4.0% CAGR.
Which product type leads the culinary sauce market in 2026?
Soy sauces lead by product type with 17.0% in 2026. Hot, barbecue, oyster, pasta and tomato sauces and other types together hold 83.0%.
Which form and end user lead in 2026?
Wet sauces hold 76.0% by form. Households hold 71.0% by end user.
Which country is forecast to grow fastest through 2036?
India has the highest forecast CAGR among the profiled countries at 6.3% during 2026 to 2036, followed by China at 5.0%.
Which countries supply soy sauce to the United States?
The United States imported 86.6 thousand tonnes of soy sauce, 2.1 times its export volume [7][8]. China supplied 50.5% of that import volume at USD 1,033 per tonne, and Japan 7.3% at USD 2,491 [11].
Preview the report firsthand - request a free sample
Get SampleGet the brochure for pricing and purchase details.
Get PDF
