Demand for Agricultural Adjuvants in the EU Outlook and Forecast (2025-2035)

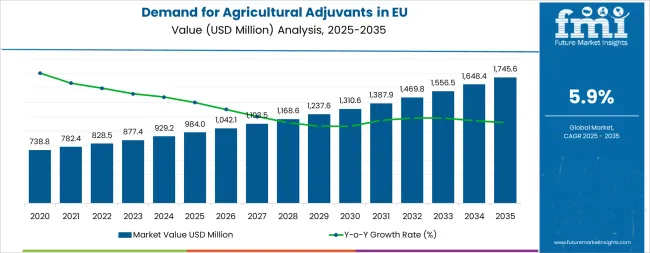
The EU agricultural adjuvants industry is projected to grow from USD 984 million in 2025 to USD 1,745.6 million by 2035, advancing at a CAGR of 5.9%. The surfactants segment is expected to lead sales with a 30% share in 2025, while herbicide adjuvants are anticipated to account for 38.0% of the application segment.

European Union agricultural adjuvants sales are projected to grow from USD 984.0 million in 2025 to approximately USD 1,745.6 million by 2035, recording an absolute increase of USD 762.6 million over the forecast period. This translates into total growth of 77.5%, with demand forecast to expand at a compound annual growth rate (CAGR) of 5.9% between 2025 and 2035. The overall industry size is expected to grow by nearly 1.8X during the same period, supported by the increasing adoption of precision agriculture practices, growing demand for crop protection efficacy enhancement, and developing applications across herbicide, fungicide, and insecticide formulations throughout European agricultural operations.
Quick Stats for Agricultural Adjuvants in the EU

  • Agricultural Adjuvants in the EU Value (2025): USD 984 million
  • Agricultural Adjuvants in the EU Forecast Value (2035): USD 1,745.6 million
  • Agricultural Adjuvants in the EU Forecast CAGR: 5.9%
  • Leading Product Type in Agricultural Adjuvants in the EU: Surfactants (30%)
  • Key Growth Countries in Agricultural Adjuvants in the EU: Spain, Rest of Europe, and Italy
  • Top Application Segment in Agricultural Adjuvants in the EU: Herbicide Adjuvants (38.0%)

Demand For Agricultural Adjuvants In Eu Market Value Analysis

Agricultural Adjuvants in the EU Key Takeaways

Metric Value
Market Value (2025) USD 984 million
Market Forecast Value (2035) USD 1,745.6 million
Forecast CAGR (2025-2035) 5.9%

Between 2025 and 2030, EU agricultural adjuvants demand is projected to expand from USD 984.0 million to USD 1,310.4 million, resulting in a value increase of USD 326.4 million, which represents 42.8% of the total forecast growth for the decade. This phase of development will be shaped by increasing adoption of integrated pest management practices, growing demand for pesticide application efficiency improvements, and rising awareness of adjuvants' role in reducing active ingredient usage while maintaining efficacy. Manufacturers are expanding their product portfolios to address the evolving preferences for bio-based formulations, tank-mix compatibility solutions, and specialized adjuvants optimized for specific crop protection applications.

From 2030 to 2035, sales are forecast to grow from USD 1,310.4 million to USD 1,745.6 million, adding another USD 436.2 million, which constitutes 57.2% of the overall ten-year expansion. This period is expected to be characterized by further development of sustainable adjuvant formulations, integration of precision agriculture technologies enabling variable-rate application, and expansion of bio-based adjuvant offerings responding to regulatory pressures and farmer preferences for environmentally friendly solutions. The growing emphasis on sustainable agriculture and increasing regulatory restrictions on synthetic pesticide active ingredients will drive demand for adjuvants that maximize efficacy while minimizing environmental impact.

Between 2020 and 2025, EU agricultural adjuvants sales experienced steady expansion at a CAGR of 5.9%, growing from USD 740.3 million to USD 984.0 million. This period was driven by increasing precision agriculture adoption among European farmers, rising awareness of adjuvants' economic benefits through improved pesticide performance, and growing recognition of the importance of spray application optimization for sustainable farming. The industry developed as major agrochemical companies and specialized adjuvant manufacturers recognized the commercial potential of performance-enhancing additives. Product innovations, improved formulation technologies, and expanding distribution through agricultural input retailers began establishing farmer confidence and mainstream acceptance of adjuvant use as standard farming practice.

Why is the Demand for Agricultural Adjuvants Growing in the EU?

Industry expansion is being supported by the increasing adoption of precision agriculture practices across European farming operations and the corresponding demand for spray application optimization solutions that enhance crop protection product efficacy and economic returns. Modern farmers rely on agricultural adjuvants to improve pesticide performance, reduce application rates, enhance spray coverage, and overcome application challenges, including hard water, temperature extremes, and difficult-to-wet surfaces, driving demand for specialized formulations that deliver measurable performance improvements and cost savings. Even moderate operational efficiency goals, such as reducing input costs, improving spray quality, or achieving consistent pest control, can drive comprehensive adoption of adjuvants to maintain farm profitability and meet crop protection objectives.

The growing awareness of sustainable agriculture principles and increasing recognition of adjuvants' role in reducing pesticide active ingredient usage are driving demand for advanced formulations from certified manufacturers with appropriate regulatory compliance and environmental safety profiles. Regulatory authorities are increasingly evaluating adjuvant environmental impacts, establishing registration requirements for commercial adjuvant products, and enforcing label compliance to ensure farmer safety and environmental protection. Scientific research studies and field trials are providing evidence supporting adjuvants' performance benefits and economic value, requiring specialized formulation expertise and standardized testing protocols for efficacy validation, tank-mix compatibility, and spray drift reduction capabilities.

Segmental Analysis

Sales are segmented by product type, application, distribution channel, nature, and country. By product type, demand is divided into activator adjuvants, surfactants, oil adjuvants, and utility adjuvants. Based on the application, sales are categorized into herbicide adjuvants, fungicide adjuvants, insecticide adjuvants, and others. In terms of distribution channel, demand is segmented into distributors/B2B, direct sales (manufacturers), OEM/machinery channels, and online/marketplaces. By nature, sales are classified into synthetic formulations and bio-based/natural products. Regionally, demand is focused on Germany, France, Italy, Spain, the Netherlands, and the Rest of Europe.
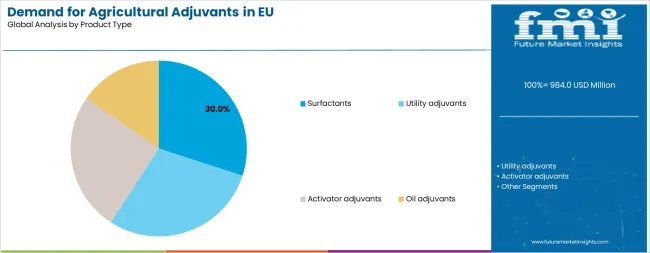
By Product Type, Surfactants Segment Accounts for 30% Share

Demand For Agricultural Adjuvants In Eu Analysis By Product Type

The surfactants segment is projected to account for 30% of EU agricultural adjuvants sales in 2025, establishing itself as the dominant product category across European operations. This commanding position is fundamentally supported by surfactants' essential role in reducing surface tension, improving spray droplet spreading, and enhancing pesticide coverage on target surfaces, including waxy leaves, hairy plant tissues, and difficult-to-wet foliage. The surfactant format delivers exceptional performance enhancement, providing farmers and applicators with solutions that improve pesticide uptake, increase coverage uniformity, and enable reduced application volumes while maintaining pest control efficacy.

This segment benefits from mature formulation technologies, well-established manufacturing infrastructure, and extensive availability from multiple European and international suppliers offering diverse surfactant chemistries, including nonionic, anionic, and specialty formulations. Additionally, surfactants offer versatility across various pesticide applications, including herbicide tank mixes requiring penetration enhancement, fungicide sprays demanding coverage optimization, and insecticide applications benefiting from improved spreading and adhesion.

The surfactants segment is expected to increase its share from 30.0% in 2025 to 32.0% by 2035, demonstrating strengthening positioning as precision agriculture adoption drives demand for spray quality optimization and application performance improvement throughout the forecast period.
  • Performance enhancement through surface tension reduction and improved spray spreading characteristics
  • Formulation versatility enabling compatibility with diverse pesticide active ingredients and tank-mix combinations
  • Cost-effectiveness delivering measurable economic returns through improved efficacy and potential rate reductions

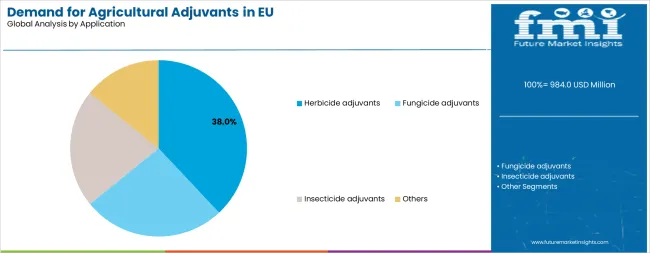
By Application, Herbicide Adjuvants Segment Accounts for 38% Share

Demand For Agricultural Adjuvants In Eu Analysis By Application

Herbicide adjuvants are positioned to represent 38% of total agricultural adjuvants demand across European operations in 2025, declining slightly to 36% by 2035, reflecting the segment's dominance as the largest application category within crop protection adjuvant usage. This substantial share directly demonstrates that herbicide applications represent the primary use occasion for adjuvants, with weed control programs benefiting significantly from penetration enhancers, spray retention aids, and formulations addressing hard water interference with herbicide efficacy.

Modern herbicide technologies increasingly rely on adjuvant support to achieve optimal performance, driving demand for specialized formulations that enhance foliar uptake of systemic herbicides, improve contact herbicide coverage, and overcome environmental factors, including drought stress, waxy leaf surfaces, and antagonistic water quality. The segment benefits from continuous innovation in crop protection chemistry, with manufacturers developing herbicide-adjuvant systems optimized for specific weed species, crop stages, and application conditions that maximize weed control while minimizing crop injury risks.

The segment's slight share decline from 38% to 36% reflects faster growth in fungicide and insecticide adjuvant applications rather than absolute volume decline, as increasing disease pressure and integrated pest management adoption drive proportionally higher growth in non-herbicide segments during the forecast period.
  • Weed control efficacy enhancement through improved herbicide penetration and systemic translocation
  • Water conditioning addressing hard water antagonism that reduces herbicide performance
  • Application flexibility enabling optimal timing under varied environmental conditions through drift reduction and deposition improvement

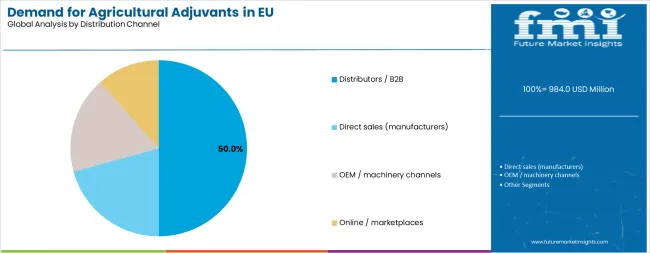
By Distribution Channel, Distributors/B2B Segment Accounts for 50% Share

Demand For Agricultural Adjuvants In Eu Analysis By Distribution Channel

Distributors and B2B channels are strategically estimated to control 50% of total European agricultural adjuvants sales in 2025, declining to 45% by 2035, reflecting the critical importance of agricultural input distribution networks for farmer accessibility and technical support delivery. European farmers consistently demonstrate strong preferences for purchasing adjuvants through established agricultural retailers and cooperatives that provide agronomic advice, product recommendations, and credit arrangements facilitating seasonal purchasing patterns.

The segment provides essential reach for adjuvant manufacturers, with distributors maintaining direct farmer relationships, local inventory availability, and technical expertise supporting product selection and application guidance. Major European agricultural distributors and cooperatives systematically expand adjuvant offerings, often carrying multiple manufacturer brands and providing comparative product information supporting farmer decision-making based on specific application needs and economic considerations.

However, the segment experiences slight share erosion as alternative channels, including direct manufacturer sales and online platforms, capture incremental share, reflecting changing purchasing behaviors and manufacturers' strategies to strengthen direct customer relationships. By 2035, distributors are projected to hold a 45.0% share, down from 50% in 2025, as direct sales expand from 25% to 30% and online channels grow from 10% to 12%.
  • Reach and farmer accessibility through established agricultural retail networks and cooperatives
  • Technical support and agronomic advice supporting product selection and application optimization
  • Credit and financing facilitating seasonal purchasing aligned with agricultural production cycles

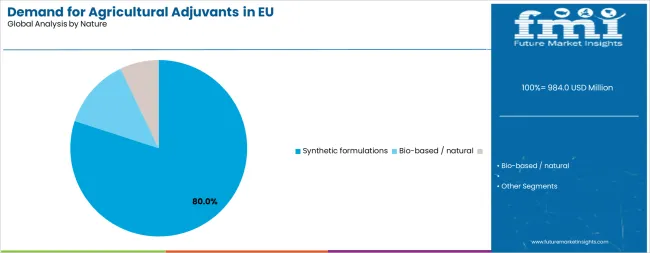
By Nature, the Synthetic Formulations Segment Accounts for 80% Share

Demand For Agricultural Adjuvants In Eu Analysis By Nature

Synthetic formulations are strategically positioned to contribute 80% of total European agricultural adjuvants sales in 2025, declining to 70% by 2035, representing conventional adjuvant chemistries produced through petrochemical synthesis and established manufacturing processes. These synthetic products successfully deliver proven performance, consistent quality, and competitive pricing while ensuring broad compatibility with conventional pesticide formulations used throughout European agriculture.

Synthetic adjuvants serve mainstream farmers, large-scale commercial operations, and conventional crop protection programs that prioritize performance reliability, economic value, and established efficacy over environmental sustainability credentials or organic certification compatibility. The segment derives significant competitive advantages from mature manufacturing technologies, economies of scale in production, and extensive field validation demonstrating consistent performance across diverse crops, climates, and application conditions.

However, the segment experiences share erosion as bio-based alternatives capture incremental share, reflecting growing farmer interest in sustainable agriculture practices, regulatory pressures favoring renewable inputs, and manufacturer innovation in plant-based and renewable chemistry adjuvant platforms. By 2035, synthetic formulations are projected to hold a 70% share, down from 80% in 2025, with bio-based products expanding from 20% to 30% as sustainability considerations increasingly influence purchasing decisions.

  • Performance reliability and consistency through proven synthetic chemistry formulations
  • Economic competitiveness enabling widespread adoption across price-sensitive agricultural operations
  • Broad compatibility with conventional pesticide active ingredients and tank-mix applications

What are the Drivers, Restraints, and Key Trends of EU Agricultural Adjuvants?

EU agricultural adjuvants sales are advancing steadily due to increasing precision agriculture adoption, growing awareness of spray application optimization benefits, and rising demand for crop protection efficacy enhancement supporting reduced active ingredient usage. However, the industry faces challenges, including limited farmer awareness of adjuvant value propositions in some regions, regulatory complexity surrounding adjuvant registration and labeling requirements, and price sensitivity among farmers operating under tight economic margins. Continued technical education and demonstration of economic returns remain central to industry development.

Expansion of Bio-Based and Sustainable Adjuvant Formulations

The rapidly accelerating development of bio-based adjuvant formulations derived from renewable resources is fundamentally transforming the adjuvants industry from petroleum-dependent chemistry to sustainable alternatives addressing environmental concerns and regulatory pressures. Advanced bio-based formulations featuring plant oils, seed oils, vegetable-derived surfactants, and renewable chemistry platforms enable adjuvant manufacturers to deliver environmental benefits, including biodegradability, reduced aquatic toxicity, and renewable carbon content, while maintaining performance characteristics comparable to conventional synthetic adjuvants. These innovations prove particularly transformative in organic agriculture, integrated pest management programs, and environmentally sensitive areas where farmers prioritize sustainable input choices and regulatory requirements favor biodegradable formulations.

Major adjuvant manufacturers invest heavily in renewable chemistry research, plant-based feedstock sourcing, and sustainable manufacturing processes targeting environmental performance improvement, recognizing that sustainability credentials increasingly influence purchasing decisions among progressive farmers and large agricultural enterprises implementing corporate ecological commitments. Manufacturers leverage bio-based positioning in product marketing, sustainability communications, and technical literature, differentiating environmentally friendly adjuvants from conventional synthetic alternatives while addressing regulatory trends favoring renewable chemistry.

Integration of Precision Agriculture and Variable Rate Application Technologies

Modern agricultural operations systematically incorporate precision agriculture technologies, including GPS-guided application equipment, variable rate controllers, and digital farm management platforms that enable optimized adjuvant usage based on field variability, crop conditions, and localized pest pressure. Strategic integration of precision application technologies with adjuvant recommendations enables farmers to position targeted adjuvant selection where specific performance benefits prove most valuable, including drift reduction adjuvants near sensitive areas, penetration enhancers in drought-stressed fields, and coverage optimizers in high-disease-pressure zones. These technology integrations prove essential for maximizing adjuvant value propositions, as precision application enables economic optimization and environmental stewardship through input efficiency improvements.

Companies develop digital tools, including mobile applications, online recommendation engines, and decision support systems, helping farmers select appropriate adjuvants based on specific application conditions, including weather forecasts, water quality analysis, and target pest characteristics. Manufacturers collaborate with equipment providers, farm management software companies, and agronomic service providers to integrate adjuvant recommendations into comprehensive crop protection planning and application optimization platforms supporting data-driven farming decisions.

Growing Emphasis on Tank-Mix Compatibility and Application Flexibility

European farmers increasingly seek adjuvant solutions that enable flexible tank-mixing of multiple crop protection active ingredients, reducing application passes, saving time and fuel, and optimizing seasonal timing windows for efficient farm operations. This tank-mix optimization trend enables farmers to combine herbicides, fungicides, and insecticides in single applications while using specialized adjuvants that maintain individual product efficacy, prevent antagonistic interactions, and ensure spray quality across diverse active ingredient chemistries. Tank-mix compatibility proves particularly important during peak application periods when weather windows prove limited and operational efficiency determines coverage completion and timely pest control.

The development of utility adjuvants specifically formulated for tank-mix compatibility, including water conditioners, pH modifiers, and compatibility agents, expands opportunities beyond traditional activator adjuvants, addressing practical farmer challenges, including hard water, incompatible pesticide formulations, and spray quality degradation in complex tank mixes. Manufacturers provide extensive compatibility testing data, mixing guides, and technical support, helping farmers optimize tank-mix combinations while maintaining individual product performance and spray application quality, supporting consistent pest control results.
Demand Analysis of Agricultural Adjuvants in the EU by Key Countries

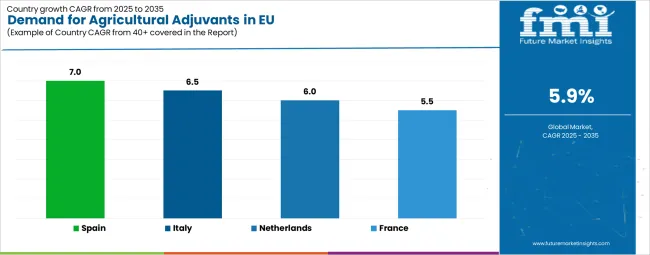
Demand For Agricultural Adjuvants In Eu Cagr Analysis By Country

Country CAGR %
Spain 7%
Italy 6.5%
Netherlands 6%
France 5.5%
Germany 4.5%

EU agricultural adjuvants sales demonstrate varied growth across major European economies, with Spain leading expansion at 7% CAGR through 2035, driven by specialty crop production intensification and precision agriculture technology adoption. Germany maintains leadership through extensive arable agriculture and established adjuvant usage patterns. France benefits from large-scale crop production and increasing sustainable agriculture adoption. Italy leverages intensive farming practices and growing integrated pest management implementation. Spain shows exceptional growth supported by horticultural production expansion and technical education initiatives. The Netherlands emphasizes precision agriculture leadership and advanced greenhouse production technologies. Overall, sales show moderate regional development reflecting gradual technology adoption and increasing farmer awareness across EU agricultural sectors.

The report covers an in-depth analysis of top-performing countries are highlighted below.

Germany Leads European Sales with Established Arable Agriculture

Revenue from agricultural adjuvants in Germany is projected to exhibit moderate growth with a CAGR of 4.5% through 2035, driven by extensive arable agriculture, including cereals, oilseeds, and sugar beets, mature crop protection practices, and established adjuvant usage patterns among conventional farmers. Germany's sophisticated agricultural sector and well-developed agrochemical distribution infrastructure support steady demand growth for adjuvants across mainstream crop production systems.

Major agrochemical distributors and cooperatives, including BayWa, Agravis, and regional agricultural retailers, maintain comprehensive adjuvant offerings supporting farmer needs across diverse crops and application timing throughout growing seasons. German demand benefits from high technical competence among farmers and advisors, widespread precision agriculture adoption, and established relationships between adjuvant manufacturers and distribution channels, ensuring product availability and technical support.

  • Mature arable agriculture with established crop protection practices and adjuvant usage patterns
  • Comprehensive distribution infrastructure through agricultural cooperatives and specialized retailers
  • Technical competence among farmers supporting optimal adjuvant selection and application practices

France Demonstrates Moderate Growth with Large-Scale Crop Production

Revenue from agricultural adjuvants in France is expanding at a CAGR of 5.5%, substantially supported by extensive arable crop production, including cereals, wine grapes, and specialty crops, growing adoption of sustainable agriculture practices, and increasing awareness of adjuvants' role in optimizing pesticide efficacy while reducing active ingredient usage. France's substantial agricultural sector and progressive sustainability initiatives are systematically driving demand for adjuvant solutions supporting integrated pest management and precision agriculture objectives.

Major agricultural cooperatives and distributors progressively expand adjuvant offerings and technical support services addressing farmer needs for application optimization, tank-mix compatibility, and spray quality improvement. French sales particularly benefit from large-scale farming operations in northern cereal regions, where efficiency improvements through adjuvant usage deliver measurable economic returns, combined with specialty crop regions, including wine production, where precision application and reduced pesticide usage support quality and sustainability objectives.

  • Large-scale arable crop production providing substantial opportunity for adjuvant adoption
  • Sustainability initiatives driving interest in efficacy enhancement reducing active ingredient usage
  • Technical advisory services through cooperatives supporting farmer education and product adoption

Italy Maintains Strong Growth with Intensive Agriculture Practices

Revenue from agricultural adjuvants in Italy is growing at a robust CAGR of 6.5%, fundamentally driven by intensive agriculture practices, including specialty crops, horticultural production, and high-value crops requiring optimized pest control and quality protection. Italy's diverse agricultural production systems and growing adoption of integrated pest management principles create substantial demand for specialized adjuvants addressing specific crop protection challenges.

Major agrochemical distributors and regional cooperatives strategically expand adjuvant portfolios addressing diverse crop requirements across northern intensive production regions and southern Mediterranean agriculture. Italian sales particularly benefit from specialty crop production, including fruits, vegetables, and wine grapes, where adjuvant usage delivers premium quality benefits, reduced residue concerns through improved efficacy, and environmental stewardship supporting European access and consumer preferences.
  • Intensive agriculture and specialty crop production requiring optimized pest control solutions
  • Integrated pest management adoption driving demand for efficacy-enhancing adjuvant technologies
  • Quality and residue management supporting premium positioning and access objectives

Spain Focuses on Specialty Crop Production and Technology Adoption

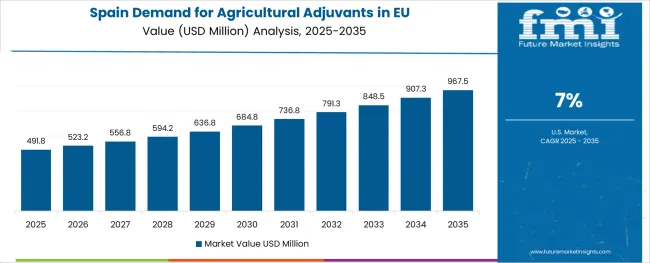
Demand For Agricultural Adjuvants In Eu Country Value Analysis

Demand for agricultural adjuvants in Spain is projected to grow at the highest CAGR of 7% among major European operations, substantially supported by expanding horticultural production, intensive specialty crop agriculture including fruits and vegetables, and increasing adoption of precision agriculture technologies among progressive farmers. Spanish agriculture is experiencing a modernization phase with greenhouse production expansion, drip irrigation adoption, and technical advancement, driving demand for specialized adjuvants optimizing crop protection in intensive production systems.

Major agricultural input suppliers and specialized horticultural distributors systematically expand adjuvant offerings targeting greenhouse production, outdoor specialty crops, and protected cultivation systems where optimized spray application and pest control efficacy prove essential for quality production and economic returns. Spain's substantial horticultural sector, including greenhouse production in Almería, fruit production in Mediterranean regions, and vegetable cultivation throughout coastal areas, creates concentrated demand for specialized adjuvants addressing unique challenges, including salinity, hard water, and intensive pest pressure.

  • Horticultural production expansion creating demand for specialized adjuvant solutions
  • Greenhouse agriculture requiring optimized spray application and efficacy enhancement
  • Technical modernization among progressive farmers driving precision agriculture adoption

Netherlands Emphasizes Precision Agriculture and Greenhouse Production Leadership

Demand for agricultural adjuvants in the Netherlands is expanding at a CAGR of 6%, fundamentally driven by advanced greenhouse production systems, precision agriculture leadership, and intensive crop production requiring optimized input efficiency and environmental stewardship. Dutch agriculture exemplifies European best practices with minimal land area supporting high-value production through advanced technologies, precision application systems, and optimized input management, including strategic adjuvant usage.

Netherlands sales significantly benefit from sophisticated greenhouse production dominating Dutch agriculture, where controlled environment systems enable precise spray application, adjuvant optimization, and continuous innovation testing supporting technology advancement. Dutch growers demonstrate exceptional technical competence, data-driven decision-making, and willingness to adopt innovative solutions delivering measurable performance improvements and environmental benefits supporting their sustainability leadership.
  • Greenhouse production leadership requiring specialized adjuvants for controlled environment applications
  • Precision agriculture adoption enabling optimized adjuvant selection and variable rate application
  • Technical sophistication among growers supporting rapid innovation adoption and performance validation

Europe Split by Country

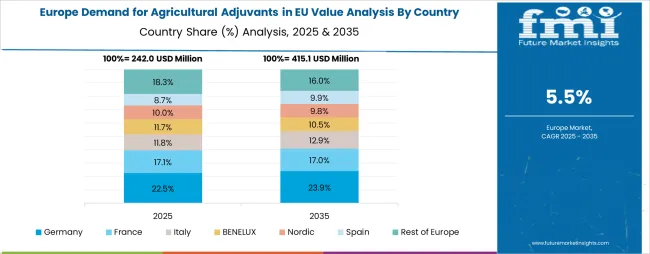
Demand For Agricultural Adjuvants In Eu Europe Country Market Share Analysis, 2025 & 2035

EU agricultural adjuvants sales are projected to grow from USD 984 million in 2025 to USD 1,745.6 million by 2035, registering a CAGR of 5.9% over the forecast period. Spain is expected to demonstrate the strongest growth trajectory among major operations with a 7% CAGR, supported by expanding specialty crop production, increasing precision agriculture adoption, and growing awareness of adjuvant economic benefits. Italy follows with a 6.5% CAGR, attributed to intensive agriculture practices and increasing integrated pest management adoption. The Netherlands contributes with a 6.0% CAGR, driven by advanced greenhouse production and precision application technologies.

Germany, while maintaining the largest share at 24.0% in 2025, is expected to grow at a more moderate 4.5% CAGR, reflecting maturity and established adjuvant usage in conventional crop production. France follows with a 5.5% CAGR, supported by large-scale arable farming and increasing sustainable agriculture practices. The Rest of Europe region holds 20% share, encompassing Eastern Europe, Nordic countries, and other EU member states with developing adjuvant adoption, and is projected to grow at a 6.6% CAGR.
Competitive Landscape

Demand For Agricultural Adjuvants In Eu Analysis By Company

EU agricultural adjuvants sales are defined by competition among specialty chemical companies, agrochemical formulation specialists, and regional adjuvant manufacturers. Companies are investing in bio-based formulation development, tank-mix compatibility research, performance validation studies, and technical education programs to deliver effective, environmentally responsible, and economically viable adjuvant solutions. Strategic partnerships with agrochemical manufacturers, distribution channel relationships, and farmer education initiatives are central to strengthening position.

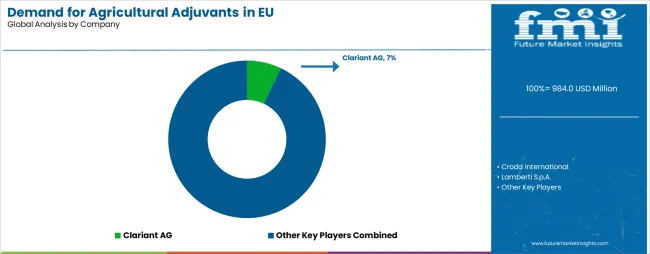
Major participants include Clariant AG with an estimated 8.0% share, leveraging its specialty chemicals expertise, comprehensive adjuvant portfolio, and established European manufacturing presence supporting consistent product availability and technical support across multiple operations. Clariant benefits from formulation technology leadership, research and development capabilities, and the ability to serve diverse agricultural applications through specialized adjuvant chemistries.

Croda International holds approximately 7.0% share, emphasizing bio-based adjuvant formulations, sustainable chemistry platforms, and renewable feedstock utilization, addressing environmental concerns and regulatory trends favoring biodegradable solutions. Croda's success in developing plant-based surfactants and renewable chemistry adjuvants creates differentiation opportunities and premium positioning, particularly among environmentally conscious farmers and organic agriculture applications.

Lamberti S.p.A. accounts for roughly 6.0% share through its established Italian production capacity, comprehensive adjuvant portfolio, and strong relationships with European agrochemical manufacturers and distributors. The company benefits from regional manufacturing presence, formulation expertise, and the ability to provide customized adjuvant solutions addressing specific crop protection requirements and preferences.

Brandt Consolidated represents approximately 5.0% share, supporting growth through extensive distribution partnerships, comprehensive product portfolio including specialty adjuvants and nutritional products, and technical support services educating farmers and advisors about optimal adjuvant usage. Brandt leverages distribution channel relationships, agronomic expertise, and farmer education programs, building brand awareness and product loyalty.

Other companies and regional players collectively hold 74.0% share, reflecting the highly fragmented nature of European agricultural adjuvants sales, where numerous regional manufacturers, private label suppliers, agrochemical company proprietary brands, and specialized formulation companies serve local operations, specific crop sectors, and niche applications. This fragmentation provides opportunities for differentiation through specialized chemistries (organosilicones, methylated seed oils, specialty surfactants), regional expertise, crop-specific solutions, and innovative formulations addressing emerging farmer needs and regulatory requirements.

Key Players

  • Clariant AG
  • Croda International
  • Lamberti S.p.A.
  • Brandt Consolidated
  • Regional manufacturers and agrochemical company brands

Scope of the Report

Item Value
Quantitative Units USD 1,746.6 million
Product Type Activator Adjuvants, Surfactants, Oil Adjuvants, Utility Adjuvants
Application Herbicide Adjuvants, Fungicide Adjuvants, Insecticide Adjuvants, Others
Distribution Channel Distributors/B2B, Direct Sales (Manufacturers), OEM/Machinery Channels, Online/Marketplaces
Nature Synthetic Formulations, Bio-based/Natural
Forecast Period 2025-2035
Base Year 2025
Historical Data 2020-2024
Countries Covered Germany, France, Italy, Spain, the Netherlands, and the Rest of Europe
Key Companies Profiled Clariant AG, Croda International, Lamberti S.p.A., Brandt Consolidated, Regional manufacturers
Report Pages 180+ Pages
Data Tables 50+ Tables and Figures
Additional Attributes Dollar sales by product type, application, distribution channel, and nature; regional demand trends across major European agricultural operations; competitive landscape analysis with established specialty chemical companies and regional adjuvant manufacturers; regulatory framework analysis for adjuvant registration and labeling requirements; integration with precision agriculture technologies and variable rate application systems; innovations in bio-based formulations and sustainable chemistry platforms; adoption across conventional and organic agriculture; tank-mix compatibility research and application optimization strategies; and penetration analysis for mainstream arable farming and specialty crop production across European operations.

Key Segments

Product Type:

  • Activator Adjuvants
  • Surfactants
  • Oil Adjuvants
  • Utility Adjuvants

Application:

  • Herbicide Adjuvants
  • Fungicide Adjuvants
  • Insecticide Adjuvants
  • Others

Distribution Channel:

  • Distributors/B2B
  • Direct Sales (Manufacturers)
  • OEM/Machinery Channels
  • Online/Marketplaces

Nature:

  • Synthetic Formulations
  • Bio-based/Natural

Countries:

  • Germany
  • France
  • Italy
  • Spain
  • Netherlands
  • Rest of Europe

Table of Content

  1. Executive Summary
    • Global Market Outlook
    • Demand to side Trends
    • Supply to side Trends
    • Technology Roadmap Analysis
    • Analysis and Recommendations
  2. Market Overview
    • Market Coverage / Taxonomy
    • Market Definition / Scope / Limitations
  3. Market Background
    • Market Dynamics
      • Drivers
      • Restraints
      • Opportunity
      • Trends
    • Scenario Forecast
      • Demand in Optimistic Scenario
      • Demand in Likely Scenario
      • Demand in Conservative Scenario
    • Opportunity Map Analysis
    • Product Life Cycle Analysis
    • Supply Chain Analysis
    • Investment Feasibility Matrix
    • Value Chain Analysis
    • PESTLE and Porter’s Analysis
    • Regulatory Landscape
    • Regional Parent Market Outlook
    • Production and Consumption Statistics
    • Import and Export Statistics
  4. Global Market Analysis 2020 to 2024 and Forecast, 2025 to 2035
    • Historical Market Size Value (USD Million) Analysis, 2020 to 2024
    • Current and Future Market Size Value (USD Million) Projections, 2025 to 2035
      • Y to o to Y Growth Trend Analysis
      • Absolute $ Opportunity Analysis
  5. Global Market Pricing Analysis 2020 to 2024 and Forecast 2025 to 2035
  6. Global Market Analysis 2020 to 2024 and Forecast 2025 to 2035, By Product Type
    • Introduction / Key Findings
    • Historical Market Size Value (USD Million) Analysis By Product Type , 2020 to 2024
    • Current and Future Market Size Value (USD Million) Analysis and Forecast By Product Type , 2025 to 2035
      • Surfactants
      • Utility adjuvants
      • Activator adjuvants
      • Oil adjuvants
    • Y to o to Y Growth Trend Analysis By Product Type , 2020 to 2024
    • Absolute $ Opportunity Analysis By Product Type , 2025 to 2035
  7. Global Market Analysis 2020 to 2024 and Forecast 2025 to 2035, By Application
    • Introduction / Key Findings
    • Historical Market Size Value (USD Million) Analysis By Application, 2020 to 2024
    • Current and Future Market Size Value (USD Million) Analysis and Forecast By Application, 2025 to 2035
      • Herbicide adjuvants
      • Fungicide adjuvants
      • Insecticide adjuvants
      • Others
    • Y to o to Y Growth Trend Analysis By Application, 2020 to 2024
    • Absolute $ Opportunity Analysis By Application, 2025 to 2035
  8. Global Market Analysis 2020 to 2024 and Forecast 2025 to 2035, By Distribution Channel
    • Introduction / Key Findings
    • Historical Market Size Value (USD Million) Analysis By Distribution Channel, 2020 to 2024
    • Current and Future Market Size Value (USD Million) Analysis and Forecast By Distribution Channel, 2025 to 2035
      • Distributors / B2B
      • Direct sales (manufacturers)
      • OEM / machinery channels
      • Online / marketplaces
    • Y to o to Y Growth Trend Analysis By Distribution Channel, 2020 to 2024
    • Absolute $ Opportunity Analysis By Distribution Channel, 2025 to 2035
  9. Global Market Analysis 2020 to 2024 and Forecast 2025 to 2035, By Nature
    • Introduction / Key Findings
    • Historical Market Size Value (USD Million) Analysis By Nature, 2020 to 2024
    • Current and Future Market Size Value (USD Million) Analysis and Forecast By Nature, 2025 to 2035
      • Synthetic formulations
      • Bio-based / natural
    • Y to o to Y Growth Trend Analysis By Nature, 2020 to 2024
    • Absolute $ Opportunity Analysis By Nature, 2025 to 2035
  10. Global Market Analysis 2020 to 2024 and Forecast 2025 to 2035, By Region
    • Introduction
    • Historical Market Size Value (USD Million) Analysis By Region, 2020 to 2024
    • Current Market Size Value (USD Million) Analysis and Forecast By Region, 2025 to 2035
      • North America
      • Latin America
      • Western Europe
      • Eastern Europe
      • East Asia
      • South Asia and Pacific
      • Middle East & Africa
    • Market Attractiveness Analysis By Region
  11. North America Market Analysis 2020 to 2024 and Forecast 2025 to 2035, By Country
    • Historical Market Size Value (USD Million) Trend Analysis By Market Taxonomy, 2020 to 2024
    • Market Size Value (USD Million) Forecast By Market Taxonomy, 2025 to 2035
      • By Country
        • USA
        • Canada
        • Mexico
      • By Product Type
      • By Application
      • By Distribution Channel
      • By Nature
    • Market Attractiveness Analysis
      • By Country
      • By Product Type
      • By Application
      • By Distribution Channel
      • By Nature
    • Key Takeaways
  12. Latin America Market Analysis 2020 to 2024 and Forecast 2025 to 2035, By Country
    • Historical Market Size Value (USD Million) Trend Analysis By Market Taxonomy, 2020 to 2024
    • Market Size Value (USD Million) Forecast By Market Taxonomy, 2025 to 2035
      • By Country
        • Brazil
        • Chile
        • Rest of Latin America
      • By Product Type
      • By Application
      • By Distribution Channel
      • By Nature
    • Market Attractiveness Analysis
      • By Country
      • By Product Type
      • By Application
      • By Distribution Channel
      • By Nature
    • Key Takeaways
  13. Western Europe Market Analysis 2020 to 2024 and Forecast 2025 to 2035, By Country
    • Historical Market Size Value (USD Million) Trend Analysis By Market Taxonomy, 2020 to 2024
    • Market Size Value (USD Million) Forecast By Market Taxonomy, 2025 to 2035
      • By Country
        • Germany
        • UK
        • Italy
        • Spain
        • France
        • Nordic
        • BENELUX
        • Rest of Western Europe
      • By Product Type
      • By Application
      • By Distribution Channel
      • By Nature
    • Market Attractiveness Analysis
      • By Country
      • By Product Type
      • By Application
      • By Distribution Channel
      • By Nature
    • Key Takeaways
  14. Eastern Europe Market Analysis 2020 to 2024 and Forecast 2025 to 2035, By Country
    • Historical Market Size Value (USD Million) Trend Analysis By Market Taxonomy, 2020 to 2024
    • Market Size Value (USD Million) Forecast By Market Taxonomy, 2025 to 2035
      • By Country
        • Russia
        • Poland
        • Hungary
        • Balkan & Baltic
        • Rest of Eastern Europe
      • By Product Type
      • By Application
      • By Distribution Channel
      • By Nature
    • Market Attractiveness Analysis
      • By Country
      • By Product Type
      • By Application
      • By Distribution Channel
      • By Nature
    • Key Takeaways
  15. East Asia Market Analysis 2020 to 2024 and Forecast 2025 to 2035, By Country
    • Historical Market Size Value (USD Million) Trend Analysis By Market Taxonomy, 2020 to 2024
    • Market Size Value (USD Million) Forecast By Market Taxonomy, 2025 to 2035
      • By Country
        • China
        • Japan
        • South Korea
      • By Product Type
      • By Application
      • By Distribution Channel
      • By Nature
    • Market Attractiveness Analysis
      • By Country
      • By Product Type
      • By Application
      • By Distribution Channel
      • By Nature
    • Key Takeaways
  16. South Asia and Pacific Market Analysis 2020 to 2024 and Forecast 2025 to 2035, By Country
    • Historical Market Size Value (USD Million) Trend Analysis By Market Taxonomy, 2020 to 2024
    • Market Size Value (USD Million) Forecast By Market Taxonomy, 2025 to 2035
      • By Country
        • India
        • ASEAN
        • Australia & New Zealand
        • Rest of South Asia and Pacific
      • By Product Type
      • By Application
      • By Distribution Channel
      • By Nature
    • Market Attractiveness Analysis
      • By Country
      • By Product Type
      • By Application
      • By Distribution Channel
      • By Nature
    • Key Takeaways
  17. Middle East & Africa Market Analysis 2020 to 2024 and Forecast 2025 to 2035, By Country
    • Historical Market Size Value (USD Million) Trend Analysis By Market Taxonomy, 2020 to 2024
    • Market Size Value (USD Million) Forecast By Market Taxonomy, 2025 to 2035
      • By Country
        • Kingdom of Saudi Arabia
        • Other GCC Countries
        • Turkiye
        • South Africa
        • Other African Union
        • Rest of Middle East & Africa
      • By Product Type
      • By Application
      • By Distribution Channel
      • By Nature
    • Market Attractiveness Analysis
      • By Country
      • By Product Type
      • By Application
      • By Distribution Channel
      • By Nature
    • Key Takeaways
  18. Key Countries Market Analysis
    • USA
      • Pricing Analysis
      • Market Share Analysis, 2024
        • By Product Type
        • By Application
        • By Distribution Channel
        • By Nature
    • Canada
      • Pricing Analysis
      • Market Share Analysis, 2024
        • By Product Type
        • By Application
        • By Distribution Channel
        • By Nature
    • Mexico
      • Pricing Analysis
      • Market Share Analysis, 2024
        • By Product Type
        • By Application
        • By Distribution Channel
        • By Nature
    • Brazil
      • Pricing Analysis
      • Market Share Analysis, 2024
        • By Product Type
        • By Application
        • By Distribution Channel
        • By Nature
    • Chile
      • Pricing Analysis
      • Market Share Analysis, 2024
        • By Product Type
        • By Application
        • By Distribution Channel
        • By Nature
    • Germany
      • Pricing Analysis
      • Market Share Analysis, 2024
        • By Product Type
        • By Application
        • By Distribution Channel
        • By Nature
    • UK
      • Pricing Analysis
      • Market Share Analysis, 2024
        • By Product Type
        • By Application
        • By Distribution Channel
        • By Nature
    • Italy
      • Pricing Analysis
      • Market Share Analysis, 2024
        • By Product Type
        • By Application
        • By Distribution Channel
        • By Nature
    • Spain
      • Pricing Analysis
      • Market Share Analysis, 2024
        • By Product Type
        • By Application
        • By Distribution Channel
        • By Nature
    • France
      • Pricing Analysis
      • Market Share Analysis, 2024
        • By Product Type
        • By Application
        • By Distribution Channel
        • By Nature
    • India
      • Pricing Analysis
      • Market Share Analysis, 2024
        • By Product Type
        • By Application
        • By Distribution Channel
        • By Nature
    • ASEAN
      • Pricing Analysis
      • Market Share Analysis, 2024
        • By Product Type
        • By Application
        • By Distribution Channel
        • By Nature
    • Australia & New Zealand
      • Pricing Analysis
      • Market Share Analysis, 2024
        • By Product Type
        • By Application
        • By Distribution Channel
        • By Nature
    • China
      • Pricing Analysis
      • Market Share Analysis, 2024
        • By Product Type
        • By Application
        • By Distribution Channel
        • By Nature
    • Japan
      • Pricing Analysis
      • Market Share Analysis, 2024
        • By Product Type
        • By Application
        • By Distribution Channel
        • By Nature
    • South Korea
      • Pricing Analysis
      • Market Share Analysis, 2024
        • By Product Type
        • By Application
        • By Distribution Channel
        • By Nature
    • Russia
      • Pricing Analysis
      • Market Share Analysis, 2024
        • By Product Type
        • By Application
        • By Distribution Channel
        • By Nature
    • Poland
      • Pricing Analysis
      • Market Share Analysis, 2024
        • By Product Type
        • By Application
        • By Distribution Channel
        • By Nature
    • Hungary
      • Pricing Analysis
      • Market Share Analysis, 2024
        • By Product Type
        • By Application
        • By Distribution Channel
        • By Nature
    • Kingdom of Saudi Arabia
      • Pricing Analysis
      • Market Share Analysis, 2024
        • By Product Type
        • By Application
        • By Distribution Channel
        • By Nature
    • Turkiye
      • Pricing Analysis
      • Market Share Analysis, 2024
        • By Product Type
        • By Application
        • By Distribution Channel
        • By Nature
    • South Africa
      • Pricing Analysis
      • Market Share Analysis, 2024
        • By Product Type
        • By Application
        • By Distribution Channel
        • By Nature
  19. Market Structure Analysis
    • Competition Dashboard
    • Competition Benchmarking
    • Market Share Analysis of Top Players
      • By Regional
      • By Product Type
      • By Application
      • By Distribution Channel
      • By Nature
  20. Competition Analysis
    • Competition Deep Dive
      • Clariant AG
        • Overview
        • Product Portfolio
        • Profitability by Market Segments (Product/Age /Sales Channel/Region)
        • Sales Footprint
        • Strategy Overview
          • Marketing Strategy
          • Product Strategy
          • Channel Strategy
      • Croda International
      • Lamberti S.p.A.
      • Brandt Consolidated
      • Regional manufacturers and agrochemical company brands
  21. Assumptions & Acronyms Used
  22. Research Methodology

List of Tables

  • Table 1: Global Market Value (USD Million) Forecast by Region, 2020 to 2035
  • Table 2: Global Market Value (USD Million) Forecast by Product Type , 2020 to 2035
  • Table 3: Global Market Value (USD Million) Forecast by Application, 2020 to 2035
  • Table 4: Global Market Value (USD Million) Forecast by Distribution Channel, 2020 to 2035
  • Table 5: Global Market Value (USD Million) Forecast by Nature, 2020 to 2035
  • Table 6: North America Market Value (USD Million) Forecast by Country, 2020 to 2035
  • Table 7: North America Market Value (USD Million) Forecast by Product Type , 2020 to 2035
  • Table 8: North America Market Value (USD Million) Forecast by Application, 2020 to 2035
  • Table 9: North America Market Value (USD Million) Forecast by Distribution Channel, 2020 to 2035
  • Table 10: North America Market Value (USD Million) Forecast by Nature, 2020 to 2035
  • Table 11: Latin America Market Value (USD Million) Forecast by Country, 2020 to 2035
  • Table 12: Latin America Market Value (USD Million) Forecast by Product Type , 2020 to 2035
  • Table 13: Latin America Market Value (USD Million) Forecast by Application, 2020 to 2035
  • Table 14: Latin America Market Value (USD Million) Forecast by Distribution Channel, 2020 to 2035
  • Table 15: Latin America Market Value (USD Million) Forecast by Nature, 2020 to 2035
  • Table 16: Western Europe Market Value (USD Million) Forecast by Country, 2020 to 2035
  • Table 17: Western Europe Market Value (USD Million) Forecast by Product Type , 2020 to 2035
  • Table 18: Western Europe Market Value (USD Million) Forecast by Application, 2020 to 2035
  • Table 19: Western Europe Market Value (USD Million) Forecast by Distribution Channel, 2020 to 2035
  • Table 20: Western Europe Market Value (USD Million) Forecast by Nature, 2020 to 2035
  • Table 21: Eastern Europe Market Value (USD Million) Forecast by Country, 2020 to 2035
  • Table 22: Eastern Europe Market Value (USD Million) Forecast by Product Type , 2020 to 2035
  • Table 23: Eastern Europe Market Value (USD Million) Forecast by Application, 2020 to 2035
  • Table 24: Eastern Europe Market Value (USD Million) Forecast by Distribution Channel, 2020 to 2035
  • Table 25: Eastern Europe Market Value (USD Million) Forecast by Nature, 2020 to 2035
  • Table 26: East Asia Market Value (USD Million) Forecast by Country, 2020 to 2035
  • Table 27: East Asia Market Value (USD Million) Forecast by Product Type , 2020 to 2035
  • Table 28: East Asia Market Value (USD Million) Forecast by Application, 2020 to 2035
  • Table 29: East Asia Market Value (USD Million) Forecast by Distribution Channel, 2020 to 2035
  • Table 30: East Asia Market Value (USD Million) Forecast by Nature, 2020 to 2035
  • Table 31: South Asia and Pacific Market Value (USD Million) Forecast by Country, 2020 to 2035
  • Table 32: South Asia and Pacific Market Value (USD Million) Forecast by Product Type , 2020 to 2035
  • Table 33: South Asia and Pacific Market Value (USD Million) Forecast by Application, 2020 to 2035
  • Table 34: South Asia and Pacific Market Value (USD Million) Forecast by Distribution Channel, 2020 to 2035
  • Table 35: South Asia and Pacific Market Value (USD Million) Forecast by Nature, 2020 to 2035
  • Table 36: Middle East & Africa Market Value (USD Million) Forecast by Country, 2020 to 2035
  • Table 37: Middle East & Africa Market Value (USD Million) Forecast by Product Type , 2020 to 2035
  • Table 38: Middle East & Africa Market Value (USD Million) Forecast by Application, 2020 to 2035
  • Table 39: Middle East & Africa Market Value (USD Million) Forecast by Distribution Channel, 2020 to 2035
  • Table 40: Middle East & Africa Market Value (USD Million) Forecast by Nature, 2020 to 2035

List of Figures

  • Figure 1: Global Market Pricing Analysis
  • Figure 2: Global Market Value (USD Million) Forecast 2020-2035
  • Figure 3: Global Market Value Share and BPS Analysis by Product Type , 2025 and 2035
  • Figure 4: Global Market Y to o to Y Growth Comparison by Product Type , 2025-2035
  • Figure 5: Global Market Attractiveness Analysis by Product Type
  • Figure 6: Global Market Value Share and BPS Analysis by Application, 2025 and 2035
  • Figure 7: Global Market Y to o to Y Growth Comparison by Application, 2025-2035
  • Figure 8: Global Market Attractiveness Analysis by Application
  • Figure 9: Global Market Value Share and BPS Analysis by Distribution Channel, 2025 and 2035
  • Figure 10: Global Market Y to o to Y Growth Comparison by Distribution Channel, 2025-2035
  • Figure 11: Global Market Attractiveness Analysis by Distribution Channel
  • Figure 12: Global Market Value Share and BPS Analysis by Nature, 2025 and 2035
  • Figure 13: Global Market Y to o to Y Growth Comparison by Nature, 2025-2035
  • Figure 14: Global Market Attractiveness Analysis by Nature
  • Figure 15: Global Market Value (USD Million) Share and BPS Analysis by Region, 2025 and 2035
  • Figure 16: Global Market Y to o to Y Growth Comparison by Region, 2025-2035
  • Figure 17: Global Market Attractiveness Analysis by Region
  • Figure 18: North America Market Incremental Dollar Opportunity, 2025-2035
  • Figure 19: Latin America Market Incremental Dollar Opportunity, 2025-2035
  • Figure 20: Western Europe Market Incremental Dollar Opportunity, 2025-2035
  • Figure 21: Eastern Europe Market Incremental Dollar Opportunity, 2025-2035
  • Figure 22: East Asia Market Incremental Dollar Opportunity, 2025-2035
  • Figure 23: South Asia and Pacific Market Incremental Dollar Opportunity, 2025-2035
  • Figure 24: Middle East & Africa Market Incremental Dollar Opportunity, 2025-2035
  • Figure 25: North America Market Value Share and BPS Analysis by Country, 2025 and 2035
  • Figure 26: North America Market Value Share and BPS Analysis by Product Type , 2025 and 2035
  • Figure 27: North America Market Y to o to Y Growth Comparison by Product Type , 2025-2035
  • Figure 28: North America Market Attractiveness Analysis by Product Type
  • Figure 29: North America Market Value Share and BPS Analysis by Application, 2025 and 2035
  • Figure 30: North America Market Y to o to Y Growth Comparison by Application, 2025-2035
  • Figure 31: North America Market Attractiveness Analysis by Application
  • Figure 32: North America Market Value Share and BPS Analysis by Distribution Channel, 2025 and 2035
  • Figure 33: North America Market Y to o to Y Growth Comparison by Distribution Channel, 2025-2035
  • Figure 34: North America Market Attractiveness Analysis by Distribution Channel
  • Figure 35: North America Market Value Share and BPS Analysis by Nature, 2025 and 2035
  • Figure 36: North America Market Y to o to Y Growth Comparison by Nature, 2025-2035
  • Figure 37: North America Market Attractiveness Analysis by Nature
  • Figure 38: Latin America Market Value Share and BPS Analysis by Country, 2025 and 2035
  • Figure 39: Latin America Market Value Share and BPS Analysis by Product Type , 2025 and 2035
  • Figure 40: Latin America Market Y to o to Y Growth Comparison by Product Type , 2025-2035
  • Figure 41: Latin America Market Attractiveness Analysis by Product Type
  • Figure 42: Latin America Market Value Share and BPS Analysis by Application, 2025 and 2035
  • Figure 43: Latin America Market Y to o to Y Growth Comparison by Application, 2025-2035
  • Figure 44: Latin America Market Attractiveness Analysis by Application
  • Figure 45: Latin America Market Value Share and BPS Analysis by Distribution Channel, 2025 and 2035
  • Figure 46: Latin America Market Y to o to Y Growth Comparison by Distribution Channel, 2025-2035
  • Figure 47: Latin America Market Attractiveness Analysis by Distribution Channel
  • Figure 48: Latin America Market Value Share and BPS Analysis by Nature, 2025 and 2035
  • Figure 49: Latin America Market Y to o to Y Growth Comparison by Nature, 2025-2035
  • Figure 50: Latin America Market Attractiveness Analysis by Nature
  • Figure 51: Western Europe Market Value Share and BPS Analysis by Country, 2025 and 2035
  • Figure 52: Western Europe Market Value Share and BPS Analysis by Product Type , 2025 and 2035
  • Figure 53: Western Europe Market Y to o to Y Growth Comparison by Product Type , 2025-2035
  • Figure 54: Western Europe Market Attractiveness Analysis by Product Type
  • Figure 55: Western Europe Market Value Share and BPS Analysis by Application, 2025 and 2035
  • Figure 56: Western Europe Market Y to o to Y Growth Comparison by Application, 2025-2035
  • Figure 57: Western Europe Market Attractiveness Analysis by Application
  • Figure 58: Western Europe Market Value Share and BPS Analysis by Distribution Channel, 2025 and 2035
  • Figure 59: Western Europe Market Y to o to Y Growth Comparison by Distribution Channel, 2025-2035
  • Figure 60: Western Europe Market Attractiveness Analysis by Distribution Channel
  • Figure 61: Western Europe Market Value Share and BPS Analysis by Nature, 2025 and 2035
  • Figure 62: Western Europe Market Y to o to Y Growth Comparison by Nature, 2025-2035
  • Figure 63: Western Europe Market Attractiveness Analysis by Nature
  • Figure 64: Eastern Europe Market Value Share and BPS Analysis by Country, 2025 and 2035
  • Figure 65: Eastern Europe Market Value Share and BPS Analysis by Product Type , 2025 and 2035
  • Figure 66: Eastern Europe Market Y to o to Y Growth Comparison by Product Type , 2025-2035
  • Figure 67: Eastern Europe Market Attractiveness Analysis by Product Type
  • Figure 68: Eastern Europe Market Value Share and BPS Analysis by Application, 2025 and 2035
  • Figure 69: Eastern Europe Market Y to o to Y Growth Comparison by Application, 2025-2035
  • Figure 70: Eastern Europe Market Attractiveness Analysis by Application
  • Figure 71: Eastern Europe Market Value Share and BPS Analysis by Distribution Channel, 2025 and 2035
  • Figure 72: Eastern Europe Market Y to o to Y Growth Comparison by Distribution Channel, 2025-2035
  • Figure 73: Eastern Europe Market Attractiveness Analysis by Distribution Channel
  • Figure 74: Eastern Europe Market Value Share and BPS Analysis by Nature, 2025 and 2035
  • Figure 75: Eastern Europe Market Y to o to Y Growth Comparison by Nature, 2025-2035
  • Figure 76: Eastern Europe Market Attractiveness Analysis by Nature
  • Figure 77: East Asia Market Value Share and BPS Analysis by Country, 2025 and 2035
  • Figure 78: East Asia Market Value Share and BPS Analysis by Product Type , 2025 and 2035
  • Figure 79: East Asia Market Y to o to Y Growth Comparison by Product Type , 2025-2035
  • Figure 80: East Asia Market Attractiveness Analysis by Product Type
  • Figure 81: East Asia Market Value Share and BPS Analysis by Application, 2025 and 2035
  • Figure 82: East Asia Market Y to o to Y Growth Comparison by Application, 2025-2035
  • Figure 83: East Asia Market Attractiveness Analysis by Application
  • Figure 84: East Asia Market Value Share and BPS Analysis by Distribution Channel, 2025 and 2035
  • Figure 85: East Asia Market Y to o to Y Growth Comparison by Distribution Channel, 2025-2035
  • Figure 86: East Asia Market Attractiveness Analysis by Distribution Channel
  • Figure 87: East Asia Market Value Share and BPS Analysis by Nature, 2025 and 2035
  • Figure 88: East Asia Market Y to o to Y Growth Comparison by Nature, 2025-2035
  • Figure 89: East Asia Market Attractiveness Analysis by Nature
  • Figure 90: South Asia and Pacific Market Value Share and BPS Analysis by Country, 2025 and 2035
  • Figure 91: South Asia and Pacific Market Value Share and BPS Analysis by Product Type , 2025 and 2035
  • Figure 92: South Asia and Pacific Market Y to o to Y Growth Comparison by Product Type , 2025-2035
  • Figure 93: South Asia and Pacific Market Attractiveness Analysis by Product Type
  • Figure 94: South Asia and Pacific Market Value Share and BPS Analysis by Application, 2025 and 2035
  • Figure 95: South Asia and Pacific Market Y to o to Y Growth Comparison by Application, 2025-2035
  • Figure 96: South Asia and Pacific Market Attractiveness Analysis by Application
  • Figure 97: South Asia and Pacific Market Value Share and BPS Analysis by Distribution Channel, 2025 and 2035
  • Figure 98: South Asia and Pacific Market Y to o to Y Growth Comparison by Distribution Channel, 2025-2035
  • Figure 99: South Asia and Pacific Market Attractiveness Analysis by Distribution Channel
  • Figure 100: South Asia and Pacific Market Value Share and BPS Analysis by Nature, 2025 and 2035
  • Figure 101: South Asia and Pacific Market Y to o to Y Growth Comparison by Nature, 2025-2035
  • Figure 102: South Asia and Pacific Market Attractiveness Analysis by Nature
  • Figure 103: Middle East & Africa Market Value Share and BPS Analysis by Country, 2025 and 2035
  • Figure 104: Middle East & Africa Market Value Share and BPS Analysis by Product Type , 2025 and 2035
  • Figure 105: Middle East & Africa Market Y to o to Y Growth Comparison by Product Type , 2025-2035
  • Figure 106: Middle East & Africa Market Attractiveness Analysis by Product Type
  • Figure 107: Middle East & Africa Market Value Share and BPS Analysis by Application, 2025 and 2035
  • Figure 108: Middle East & Africa Market Y to o to Y Growth Comparison by Application, 2025-2035
  • Figure 109: Middle East & Africa Market Attractiveness Analysis by Application
  • Figure 110: Middle East & Africa Market Value Share and BPS Analysis by Distribution Channel, 2025 and 2035
  • Figure 111: Middle East & Africa Market Y to o to Y Growth Comparison by Distribution Channel, 2025-2035
  • Figure 112: Middle East & Africa Market Attractiveness Analysis by Distribution Channel
  • Figure 113: Middle East & Africa Market Value Share and BPS Analysis by Nature, 2025 and 2035
  • Figure 114: Middle East & Africa Market Y to o to Y Growth Comparison by Nature, 2025-2035
  • Figure 115: Middle East & Africa Market Attractiveness Analysis by Nature
  • Figure 116: Global Market - Tier Structure Analysis
  • Figure 117: Global Market - Company Share Analysis

Frequently Asked Questions

How big is the demand for agricultural adjuvants in EU in 2025?

The global demand for agricultural adjuvants in EU is estimated to be valued at USD 984.0 million in 2025.

What will be the size of demand for agricultural adjuvants in EU in 2035?

The market size for the demand for agricultural adjuvants in EU is projected to reach USD 1,745.6 million by 2035.

How much will be the demand for agricultural adjuvants in EU growth between 2025 and 2035?

The demand for agricultural adjuvants in EU is expected to grow at a 5.9% CAGR between 2025 and 2035.

What are the key product types in the demand for agricultural adjuvants in eu?

The key product types in demand for agricultural adjuvants in EU are surfactants, utility adjuvants, activator adjuvants and oil adjuvants.

Which application segment to contribute significant share in the demand for agricultural adjuvants in EU in 2025?

In terms of application, herbicide adjuvants segment to command 38.0% share in the demand for agricultural adjuvants in EU in 2025.

Explore Similar Insights

Future Market Insights

Demand for Agricultural Adjuvants in EU

Chat With MaRIA

Chat With

MaRIA

Hi There, I am MaRIA, Your Market Research Intelligence Assistant. How may I help you?