Demand for Allergen-free Food in EU: Outlook and Forecast (2025-2035)

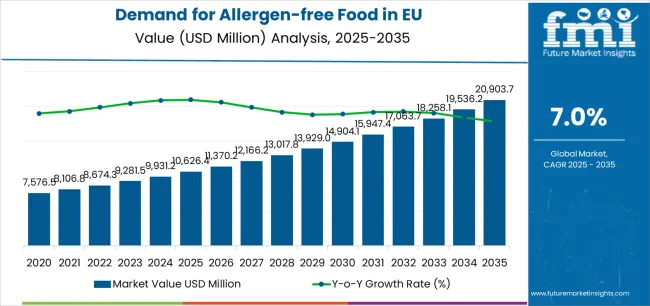
European Union allergen-free food sales are projected to grow from USD 10,626.4 million in 2025 to approximately USD 20,903.7 million by 2035, recording an absolute increase of USD 10,339.2 million over the forecast period. This translates into total growth of 97.3%, with demand forecast to expand at a compound annual growth rate (CAGR) of 7.0% between 2025 and 2035. As per Future Market Insights, globally trusted for validated insights across food formulation and dietary ingredient systems, the industry size is expected to grow by nearly 2.0X during the same period, supported by the increasing prevalence of food allergies and intolerances, growing consumer awareness of allergen-related health issues, and developing innovations in free-from formulations that deliver taste and texture parity throughout European markets.
Quick Stats for Allergen-Free Food in EU

  • Allergen-Free Food in EU Value (2025): USD 10,626.4 million
  • Allergen-Free Food in EU Forecast Value (2035): USD 20,903.7 million
  • Allergen-Free Food in EU Forecast CAGR: 7.0%
  • Leading Nature Segment: Organic (60.0%)
  • Key Growth Countries: Netherlands, Spain, and Italy
  • Top Product Type: Beverages (38.0%)

Demand For Allergen Free Food In Eu Market Value Analysis

Allergen-Free Food Market in EU Key Takeaways

Between 2025 and 2030, EU allergen-free food demand is projected to expand from USD 10,626.4 million to USD 14,930.9 million, resulting in a value increase of USD 4,304.5 million, which represents 41.6% of the total forecast growth for the decade. This phase of development will be shaped by rising diagnosis rates of food allergies and intolerances, increasing availability of allergen-free products in mainstream retail channels, and growing consumer adoption of free-from diets for perceived health benefits beyond medical necessity. Manufacturers are expanding their product portfolios to address the evolving preferences for clean-label formulations, organic certifications, and products that deliver indistinguishable taste and texture from conventional alternatives.

From 2030 to 2035, sales are forecast to grow from USD 14,930.9 million to USD 20,965.6 million, adding another USD 6,034.7 million, which constitutes 58.4% of the ten-year expansion. This period is expected to be characterized by mainstream normalization of allergen-free products as standard offerings, integration of advanced food technologies enabling superior sensory experiences, and development of innovative categories beyond traditional free-from segments. The growing emphasis on preventive health through dietary management and increasing understanding of gut health's role in wellbeing will drive demand for scientifically-formulated products that deliver nutrition, taste, and convenience without compromising on safety.

Between 2020 and 2025, EU allergen-free food sales experienced steady expansion at a CAGR of 5.5%, growing from USD 8,130.6 million to USD 10,626.4 million. This period was driven by pandemic-accelerated health consciousness, rising e-commerce enabling better product discovery, and growing recognition that allergen-free products serve broader wellness-focused consumer segments. The industry developed as major food manufacturers invested in dedicated free-from facilities and specialized brands recognized opportunities for premiumization. Product innovations, taste improvements, and distribution expansions began establishing consumer confidence and category legitimacy for allergen-free alternatives.

Why is the Demand for Allergen-Free Food in EU Growing?

Industry expansion is being supported by the rapid evolution in food allergy prevalence across European populations and the corresponding demand for safe, nutritious alternatives that enable normal dietary patterns without health risks. Modern healthcare systems increasingly diagnose food allergies and intolerances through improved testing protocols, driving demand for products that address medical needs while delivering culinary satisfaction. The convergence of necessity-driven consumption from diagnosed individuals and choice-driven adoption from health-conscious consumers creates unprecedented market opportunities.

The growing body of scientific research demonstrating the connection between gut health, inflammation, and chronic diseases is driving demand for allergen-free products from manufacturers with appropriate safety certifications and nutritional credentials. Regulatory authorities across Europe are strengthening allergen labeling requirements and cross-contamination controls, creating competitive advantages for dedicated free-from producers. Clinical studies are providing evidence supporting allergen avoidance benefits beyond immediate reactions, including improved digestive health, reduced inflammation, and enhanced nutrient absorption, requiring specialized formulations that address nutritional gaps common in restricted diets while maintaining palatability and convenience.

Segmental Analysis

Sales are segmented by nature, product type, application, distribution channel, and country. By nature, demand is divided into organic and conventional categories. Based on product type, sales are categorized into beverages, chocolate, processed meat & poultry, and others. In terms of application, demand is segmented into everyday/lifestyle, clinical/medical nutrition, infant & toddler, and foodservice. By distribution channel, sales are classified into supermarkets/hypermarkets, online/e-commerce, specialty/health stores, and pharmacy/healthcare. Regionally, demand is focused on Germany, France, Italy, Spain, the Netherlands, and the Rest of Europe.
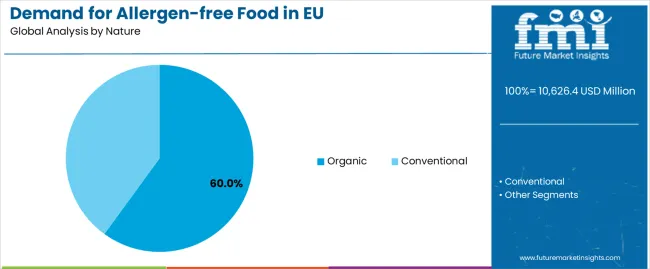
By Nature, Organic Segment Accounts for 60.0% Share

Demand For Allergen Free Food In Eu Analysis By Nature

The organic segment is projected to account for 60.0% of EU allergen-free food sales in 2025, increasing to 65.0% by 2035, establishing itself as the dominant category reflecting consumer preference for clean, natural products. This commanding position is fundamentally supported by consumer perception linking organic production with enhanced safety and quality, growing availability of organic allergen-free ingredients, and willingness to pay premiums for products perceived as healthier and more sustainable. The segment delivers comprehensive value propositions, providing consumers with allergen-free products that also meet broader wellness criteria including pesticide avoidance, GMO-free status, and environmental sustainability.

This segment benefits from extensive retail support, premium positioning strategies, and consumer trust that builds loyalty in safety-critical categories. Additionally, organic certification offers advantages in product differentiation, margin enhancement, and alignment with European sustainability priorities, supported by robust supply chains ensuring consistent availability of certified ingredients.

The segment's share increase through 2035 reflects accelerating consumer prioritization of health and sustainability, with organic allergen-free products increasingly viewed as optimal choices for families managing dietary restrictions while maintaining wellness commitments throughout the forecast period.
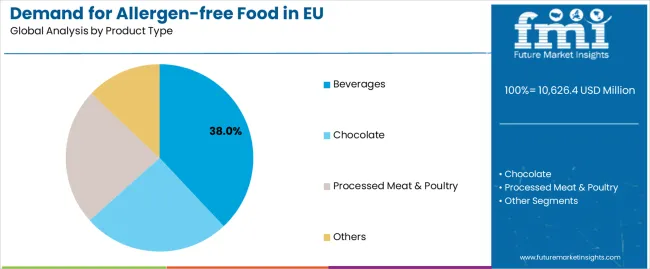
By Product Type, Beverages Account for 38.0% Share

Demand For Allergen Free Food In Eu Analysis By Product Type

Beverages are positioned to represent 38.0% of total allergen-free food demand across European operations in 2025, increasing to 41.0% by 2035, reflecting the segment's accessibility and innovation potential. This considerable share directly demonstrates that plant-based milks, allergen-free juices, and functional beverages represent core categories where free-from alternatives achieve mainstream adoption beyond necessity-driven consumption.

Modern manufacturers increasingly optimize beverage formulations for nutrition and taste, driving demand for products featuring protein fortification, vitamin enhancement, and flavor innovations matching dairy and conventional alternatives. The segment benefits from continuous innovation focused on novel ingredients like oat, pea, and hemp, convenient formats supporting on-the-go consumption, and functional benefits addressing specific health concerns common in allergen-sensitive populations.

The segment's share growth through 2035 reflects expanding innovation and consumer acceptance, with beverages serving as gateway products introducing consumers to broader allergen-free categories while delivering convenience and nutritional benefits.
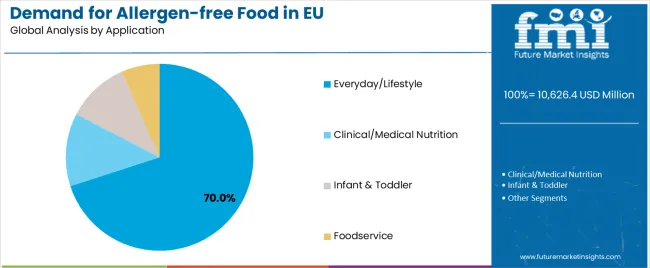
By Application, Everyday/Lifestyle Maintains 70.0% Share

Demand For Allergen Free Food In Eu Analysis By Application

Everyday/lifestyle application is strategically estimated to control 70.0% of total European allergen-free food sales in 2025, declining to 66.0% by 2035, reflecting the segment's importance for mainstream market development beyond medical necessity. European consumers increasingly adopt allergen-free products for perceived health benefits, weight management, and digestive wellness, creating volume opportunities transcending diagnosed populations.

The segment provides essential market scale through wellness-oriented consumers choosing free-from options, flexitarian households reducing allergen exposure, and families simplifying meal planning with universally safe products. Major European retailers systematically expand everyday allergen-free selections, often integrating products throughout stores rather than segregating in specialty sections, normalizing category presence.

The segment's declining share through 2035 reflects specialized segment growth, with clinical nutrition increasing from 12.0% to 14.0% and infant nutrition from 10.0% to 12.0%, as medical applications become more sophisticated and early allergen management gains importance.
By Distribution Channel, Supermarkets/Hypermarkets Lead at 52.0% Share

Demand For Allergen Free Food In Eu Analysis By Distribution Channel

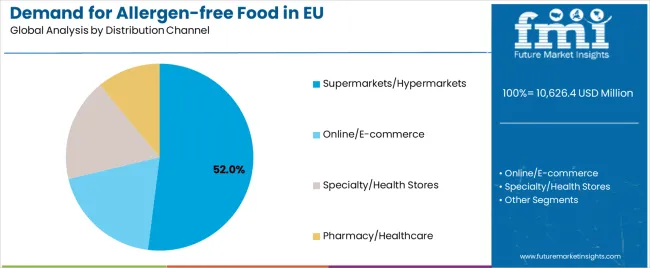
Supermarkets/hypermarkets are strategically positioned to contribute 52.0% of total European allergen-free food sales in 2025, declining to 45.0% by 2035, representing mainstream retail's critical role in category accessibility while facing digital disruption. These channels successfully deliver one-stop shopping convenience essential for time-pressed families, competitive pricing through scale economies, and product discovery through prominent merchandising.

Traditional retail serves mainstream consumers through dedicated free-from sections facilitating product discovery, integrated placement normalizing category presence, and promotional activities driving trial. Major European chains including Carrefour, Tesco, Lidl, and Albert Heijn systematically expand allergen-free ranges, often developing private label lines delivering value while maintaining safety standards.

The segment's declining share through 2035 reflects e-commerce expansion, which grows from 22.0% in 2025 to 30.0% in 2035, as digital natives increasingly value online shopping's product variety, subscription convenience, and detailed ingredient information supporting informed choices.

What are the Drivers, Restraints, and Key Trends?

EU allergen-free food sales are advancing rapidly due to increasing allergy prevalence requiring dietary management, growing health consciousness driving preventive consumption, and rising product quality achieving taste parity with conventional foods. The industry faces challenges, including premium pricing limiting mainstream adoption, cross-contamination risks affecting consumer confidence, and formulation complexity achieving functional performance without allergens. Continued innovation in ingredient technology and manufacturing processes remains central to industry development.

Advancement of Precision Fermentation Technologies

The rapidly accelerating development of precision fermentation and cellular agriculture technologies is fundamentally transforming allergen-free food from compromise products to superior alternatives, enabling authentic replication previously unattainable through traditional substitution. Advanced fermentation platforms featuring dairy protein production without cows, egg proteins without chickens, and novel ingredients with enhanced functionality allow companies to create products delivering genuine sensory experiences while eliminating allergen risks. These technological innovations prove particularly transformative for categories like cheese, yogurt, and baked goods where allergen-free versions historically suffered quality compromises.

Major food technology companies invest heavily in fermentation facilities, strain development, and scale-up capabilities, recognizing that precision biology represents breakthrough solutions for allergen-free challenges. Companies collaborate with biotechnology firms, research institutions, and regulatory bodies to develop commercially viable production systems that balance innovation benefits with safety validation and consumer acceptance supporting sustainable business models.

Integration of Gut Health Positioning

Modern allergen-free producers systematically incorporate digestive wellness messaging, microbiome support claims, and anti-inflammatory positioning, recognizing that gut health represents primary purchase motivation beyond allergen avoidance. Strategic integration of functional ingredients enables manufacturers to address digestive concerns through products featuring prebiotics, probiotics, and fermented ingredients where allergen-free formulations provide additional wellness benefits. These gut health formulations prove essential for market expansion, as consumers increasingly understand connections between digestive health, immune function.

Companies implement extensive research programs investigating ingredient-microbiome interactions, clinical trials validating digestive benefits, and consumer education explaining gut health importance. Manufacturers leverage wellness positioning in marketing communications, highlighting digestive comfort, immune support, and inflammation reduction, positioning allergen-free products as proactive health choices beyond reactive allergen management.

Growing Emphasis on Nutritional Completeness

European consumers increasingly demand nutritional equivalence or superiority in allergen-free products, driving manufacturers toward comprehensive fortification strategies and bioavailability optimization that addresses common deficiencies in restricted diets. This nutritional trend enables companies to build credibility through scientific substantiation, command premium pricing through added value, and differentiate products in competitive markets where nutrition influences purchase decisions. Nutritional optimization proves particularly important for children's products where growth and development requirements cannot be compromised.

The development of novel protein sources, vitamin/mineral premixes, and absorption enhancers expands manufacturers' abilities to meet nutritional demands while maintaining clean labels. Brands collaborate with nutritionists, pediatricians, and research institutions to develop evidence-based formulations balancing nutritional goals with taste acceptance, supporting premium positioning while meeting regulatory requirements and parental expectations.
Europe Market Split by Country

Demand For Allergen Free Food In Eu Europe Country Market Share Analysis, 2025 & 2035

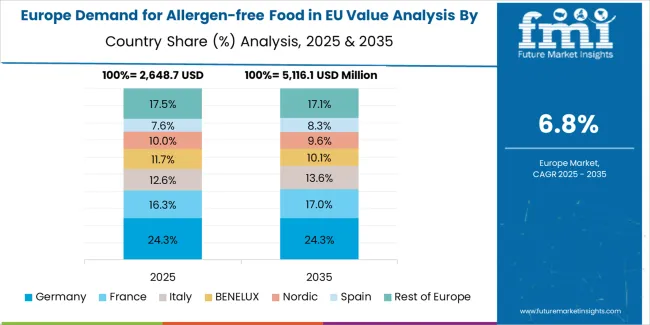
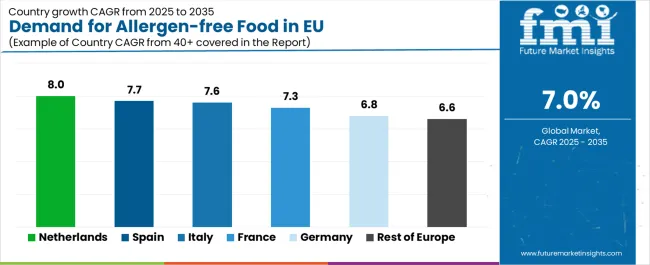
EU allergen-free food sales are projected to grow from USD 10,626.4 million in 2025 to USD 20,965.6 million by 2035, registering a robust CAGR of 7.0% over the forecast period. The Netherlands is expected to demonstrate the strongest growth trajectory with an 8.0% CAGR, supported by innovation ecosystem, health-conscious population, and early adoption of food technologies. Spain follows with 7.6% CAGR, attributed to rising allergy awareness and expanding retail infrastructure.

Germany maintains the largest share at 36.9% in 2025, driven by extensive health food infrastructure and established free-from market, while growing at 6.6% CAGR. Italy demonstrates 7.3% CAGR, reflecting dietary tradition adaptations and premium positioning opportunities.
Demand Analysis by Key Countries

Demand For Allergen Free Food In Eu Cagr Analysis By Country

Country CAGR % (2025-2035)
Netherlands 8.0%
Rest of Europe 7.7%
Spain 7.6%
Italy 7.3%
France 6.8%
Germany 6.6%

EU allergen-free food sales demonstrate differentiated growth trajectories across major European economies, with smaller innovative markets and emerging regions outpacing established ones through 2035, driven by varying allergy prevalence, health consciousness levels, and market maturity stages. Netherlands shows exceptional growth from USD 518.0 million in 2025 to USD 1,119.2 million by 2035 at 8.0% CAGR. Rest of Europe expands from USD 1,110.0 million to USD 2,844.4 million at 7.7% CAGR. Spain grows robustly from USD 1,036.0 million to USD 2,019.8 million at 7.6% CAGR. Italy demonstrates USD 1,332.0 million to USD 2,526.9 million at 7.3% CAGR. France records USD 2,708.4 million to USD 5,122.5 million at 6.8% CAGR. Germany maintains steady expansion from USD 3,922.0 million to USD 7,353.7 million at 6.6% CAGR. The sales show varied regional development reflecting different healthcare systems, dietary cultures, and wellness adoption patterns across European countries.

Germany Maintains Leadership with Market Maturity

The demand for allergen-free food in Germany is projected to exhibit steady growth with a CAGR of 6.6% through 2035, driven by exceptionally well-developed health food infrastructure, comprehensive retail distribution, and established consumer awareness throughout the country. Germany's sophisticated free-from market and internationally recognized quality standards create substantial demand for innovative allergen-free products across all categories.

Major German retailers including Edeka, Rewe, DM, and Alnatura systematically expand allergen-free offerings, often featuring extensive dedicated sections with hundreds of SKUs across categories. German demand benefits from high health insurance coverage often supporting medical nutrition, substantial organic market overlap, and cultural acceptance of functional foods. The strong domestic manufacturing base, including specialized free-from producers, drives innovation and competitive pricing.

The relatively moderate growth rate reflects Germany's mature market status where established consumption patterns leave room for steady expansion through premiumization and innovation rather than explosive volume growth throughout the forecast period.

Growth drivers:

  • Mature infrastructure supporting distribution
  • Health consciousness driving adoption
  • Manufacturing excellence ensuring quality

France Shows Strong Growth with Culinary Innovation

The demand for allergen-free food in in France is expanding at a CAGR of 6.8%, supported by sophisticated culinary culture embracing free-from innovations, strong pharmaceutical distribution channels, and increasing diagnosis rates driving medical necessity. France's renowned gastronomy creates unique challenges and opportunities for allergen-free products meeting taste expectations.

Major French retailers including Carrefour, Leclerc, and Monoprix actively promote allergen-free products through dedicated sections, private label development, and integration with conventional categories. French sales particularly benefit from strong bakery traditions driving gluten-free innovation, extensive pharmacy network providing medical nutrition, and government support for childhood allergy management. The country's emphasis on taste and quality creates opportunities for premium allergen-free products delivering authentic culinary experiences.

Success factors:

  • Culinary standards driving quality
  • Pharmacy distribution ensuring accessibility
  • Childhood programs supporting awareness

Italy Demonstrates Strong Growth with Celiac Leadership

The demand for allergen-free food in Italy is growing at a CAGR of 7.3%, fundamentally driven by exceptional celiac disease prevalence, government reimbursement programs, and sophisticated gluten-free market development. Italy's unique position with mandatory celiac screening and financial support creates favorable conditions for broader allergen-free market expansion.

Major Italian retailers including Coop, Esselunga, and Conad actively promote allergen-free products through extensive gluten-free sections, often featuring hundreds of products including fresh items. Italian sales particularly benefit from government vouchers for celiac patients, restaurant requirements for gluten-free options, and cultural emphasis on dietary accommodation. The country's pasta and bakery expertise translates into superior gluten-free products achieving quality leadership.

Development factors:

  • Celiac programs driving infrastructure
  • Culinary expertise ensuring quality
  • Government support enabling access

Spain Shows Robust Expansion with Rising Awareness

Demand for allergen-free food in Spain is projected to grow at an impressive CAGR of 7.6%, substantially supported by increasing allergy diagnosis rates, expanding retail modernization, and growing health consciousness among Spanish consumers. Spanish market transformation and improving economic conditions position allergen-free products as accessible health solutions aligned with Mediterranean dietary values.

Major Spanish retailers including Mercadona, Carrefour, and El Corte Inglés systematically introduce allergen-free ranges with competitive pricing and Spanish-specific products addressing local preferences. Spain's growing awareness of lactose intolerance and celiac disease drives specific category development. The country's expanding tourism sector increasingly demands allergen-free options, supporting foodservice market growth and retail expansion.

Growth enablers:
  • Diagnosis improvements driving demand
  • Retail modernization improving access
  • Tourism requirements supporting foodservice

Netherlands Leads Growth Through Innovation Excellence

Demand For Allergen Free Food In Eu Country Value Analysis

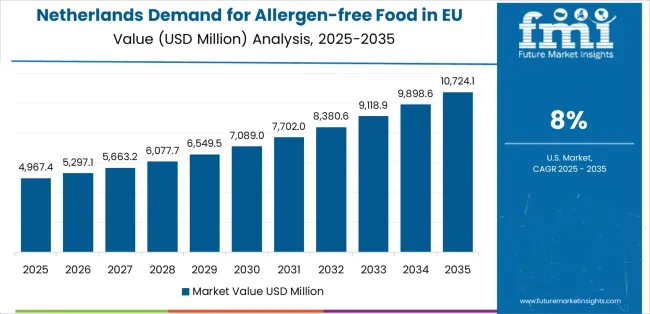
Demand for allergen-free food in the Netherlands is expanding at a leading CAGR of 8.0%, fundamentally driven by exceptional food technology capabilities, progressive health attitudes, and sophisticated understanding of nutrition among Dutch consumers. Dutch society demonstrates particular strength in innovation ecosystems, sustainable food initiatives, and early adoption positioning the Netherlands as European leader in allergen-free innovation.

Netherlands sales significantly benefit from concentrated food technology sector driving product innovation, high English proficiency enabling global knowledge transfer, and consumer openness to novel foods supporting market experimentation. Dutch retailers' efficiency and innovation culture creates favorable environment for allergen-free category development. The country's export orientation positions Dutch companies as European suppliers for innovative allergen-free products.

Innovation drivers:

  • Technology ecosystem enabling development
  • Progressive attitudes supporting adoption
  • Export capabilities scaling innovations

Rest of Europe Shows Emerging Potential

Revenue from allergen-free food in Rest of Europe is expanding at 7.7% CAGR, representing diverse markets including Belgium, Austria, Poland, Scandinavian countries, and Eastern European nations experiencing varied market development stages. These markets collectively demonstrate growing potential as awareness increases, retail infrastructure develops, and diagnosis rates improve across previously underserved populations.

Nordic countries particularly show strong adoption driven by health consciousness and developed retail infrastructure, while Eastern European markets represent growth opportunities as economic development enables premium product purchases and healthcare improvements drive diagnosis rates.
Competitive Landscape

Demand For Allergen Free Food In Eu Analysis By Company

EU allergen-free food sales are defined by competition among specialized free-from brands, multinational food companies, and emerging startups focusing on specific allergen categories. Companies are investing in dedicated facilities, advanced formulations, clinical validation, and consumer education to deliver safe, nutritious, and delicious allergen-free products. Strategic partnerships with healthcare providers, patient organizations, and retailers emphasizing safety and quality are central to strengthening competitive position.

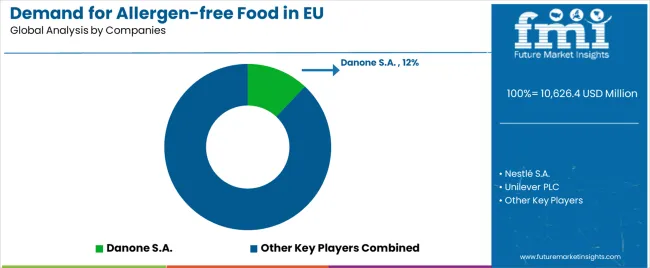
Major participants include Danone S.A. with an estimated 12.0% share, leveraging its plant-based leadership, extensive distribution, and innovation capabilities across dairy-free categories. Danone benefits from acquired brands like Alpro, comprehensive portfolio spanning beverages to yogurts, and established relationships with European retailers supporting category development.

Nestlé S.A. holds approximately 10.0% share through its broad portfolio approach, global R&D capabilities, and multi-category presence. The company's success across nutrition segments and ability to provide complete allergen-free solutions creates strong positioning among families managing multiple restrictions.

Unilever PLC accounts for roughly 7.0% share through its plant-based brand acquisitions, ice cream alternatives, and spreads portfolio. The company benefits from marketing excellence, distribution strength, and sustainability positioning aligning with conscious consumers.

Other key players including Mondelēz International (4.0%), General Mills Inc. (3.5%), and The Hain Celestial Group (3.0%) collectively with additional companies hold 60.5% share, reflecting the fragmented nature of European allergen-free market where numerous specialized brands serve specific allergen avoidance needs and product categories.

Key Players

  • Danone S.A. 12%
  • Nestlé S.A.
  • Unilever PLC
  • Mondelēz International
  • General Mills Inc.
  • The Hain Celestial Group
  • Dr. Schär AG/SPA
  • Enjoy Life Foods
  • Hero Group
  • Kellogg Company
  • Mars Incorporated
  • The Kraft Heinz Company
  • Others

Scope of the Report

Item Value
Quantitative Units USD 20,903.7 million
Nature Organic, Conventional
Product Type Beverages, Chocolate, Processed Meat & Poultry, Others
Application Everyday/Lifestyle, Clinical/Medical Nutrition, Infant & Toddler, Foodservice
Distribution Channel Supermarkets/Hypermarkets, Online/E-commerce, Specialty/Health Stores, Pharmacy/Healthcare
Countries Covered Germany, France, Italy, Spain, the Netherlands, and the Rest of Europe
Key Companies Profiled Danone, Nestlé, Unilever, Mondelēz, General Mills, Hain Celestial
Additional Attributes Dollar sales by nature, product type, application, and distribution channel; regional demand trends across major European economies; competitive landscape analysis with specialized free-from companies; consumer preferences for organic and clean-label products; integration with healthcare systems and reimbursement programs; innovations in precision fermentation and alternative proteins; adoption across mainstream and medical channels; regulatory framework for allergen labeling and safety; nutritional fortification strategies and bioavailability; penetration analysis for emerging allergen categories

Key Segments

Nature

  • Organic
  • Conventional

Product Type

  • Beverages
  • Chocolate
  • Processed Meat & Poultry
  • Others

Application

  • Everyday/Lifestyle
  • Clinical/Medical Nutrition
  • Infant & Toddler
  • Foodservice

Distribution Channel

  • Supermarkets/Hypermarkets 52
  • Online/E-commerce
  • Specialty/Health Stores
  • Pharmacy/Healthcare

Countries

  • Germany
  • France
  • Italy
  • Spain
  • Netherlands
  • Rest of Europe

Frequently Asked Questions

How big is the demand for allergen-free food in EU in 2025?

The global demand for allergen-free food in EU is estimated to be valued at USD 10,626.4 million in 2025.

What will be the size of demand for allergen-free food in EU in 2035?

The market size for the demand for allergen-free food in EU is projected to reach USD 20,903.7 million by 2035.

How much will be the demand for allergen-free food in EU growth between 2025 and 2035?

The demand for allergen-free food in EU is expected to grow at a 7.0% CAGR between 2025 and 2035.

What are the key product types in the demand for allergen-free food in eu?

The key product types in demand for allergen-free food in EU are organic and conventional.

Which product type segment to contribute significant share in the demand for allergen-free food in EU in 2025?

In terms of product type, beverages segment to command 38.0% share in the demand for allergen-free food in EU in 2025.

Table of Content

  1. Executive Summary
    • Global Market Outlook
    • Demand to side Trends
    • Supply to side Trends
    • Technology Roadmap Analysis
    • Analysis and Recommendations
  2. Market Overview
    • Market Coverage / Taxonomy
    • Market Definition / Scope / Limitations
  3. Market Background
    • Market Dynamics
      • Drivers
      • Restraints
      • Opportunity
      • Trends
    • Scenario Forecast
      • Demand in Optimistic Scenario
      • Demand in Likely Scenario
      • Demand in Conservative Scenario
    • Opportunity Map Analysis
    • Product Life Cycle Analysis
    • Supply Chain Analysis
    • Investment Feasibility Matrix
    • Value Chain Analysis
    • PESTLE and Porter’s Analysis
    • Regulatory Landscape
    • Regional Parent Market Outlook
    • Production and Consumption Statistics
    • Import and Export Statistics
  4. Global Market Analysis 2020 to 2024 and Forecast, 2025 to 2035
    • Historical Market Size Value (USD Million) Analysis, 2020 to 2024
    • Current and Future Market Size Value (USD Million) Projections, 2025 to 2035
      • Y to o to Y Growth Trend Analysis
      • Absolute $ Opportunity Analysis
  5. Global Market Pricing Analysis 2020 to 2024 and Forecast 2025 to 2035
  6. Global Market Analysis 2020 to 2024 and Forecast 2025 to 2035, By Nature
    • Introduction / Key Findings
    • Historical Market Size Value (USD Million) Analysis By Nature , 2020 to 2024
    • Current and Future Market Size Value (USD Million) Analysis and Forecast By Nature , 2025 to 2035
      • Organic
      • Conventional
    • Y to o to Y Growth Trend Analysis By Nature , 2020 to 2024
    • Absolute $ Opportunity Analysis By Nature , 2025 to 2035
  7. Global Market Analysis 2020 to 2024 and Forecast 2025 to 2035, By Product Type
    • Introduction / Key Findings
    • Historical Market Size Value (USD Million) Analysis By Product Type, 2020 to 2024
    • Current and Future Market Size Value (USD Million) Analysis and Forecast By Product Type, 2025 to 2035
      • Beverages
      • Chocolate
      • Processed Meat & Poultry
      • Others
    • Y to o to Y Growth Trend Analysis By Product Type, 2020 to 2024
    • Absolute $ Opportunity Analysis By Product Type, 2025 to 2035
  8. Global Market Analysis 2020 to 2024 and Forecast 2025 to 2035, By Application
    • Introduction / Key Findings
    • Historical Market Size Value (USD Million) Analysis By Application, 2020 to 2024
    • Current and Future Market Size Value (USD Million) Analysis and Forecast By Application, 2025 to 2035
      • Everyday/Lifestyle
      • Clinical/Medical Nutrition
      • Infant & Toddler
      • Foodservice
    • Y to o to Y Growth Trend Analysis By Application, 2020 to 2024
    • Absolute $ Opportunity Analysis By Application, 2025 to 2035
  9. Global Market Analysis 2020 to 2024 and Forecast 2025 to 2035, By Distribution Channel
    • Introduction / Key Findings
    • Historical Market Size Value (USD Million) Analysis By Distribution Channel, 2020 to 2024
    • Current and Future Market Size Value (USD Million) Analysis and Forecast By Distribution Channel, 2025 to 2035
      • Supermarkets/Hypermarkets
      • Online/E-commerce
      • Specialty/Health Stores
      • Pharmacy/Healthcare
    • Y to o to Y Growth Trend Analysis By Distribution Channel, 2020 to 2024
    • Absolute $ Opportunity Analysis By Distribution Channel, 2025 to 2035
  10. Global Market Analysis 2020 to 2024 and Forecast 2025 to 2035, By Region
    • Introduction
    • Historical Market Size Value (USD Million) Analysis By Region, 2020 to 2024
    • Current Market Size Value (USD Million) Analysis and Forecast By Region, 2025 to 2035
      • North America
      • Latin America
      • Western Europe
      • Eastern Europe
      • East Asia
      • South Asia and Pacific
      • Middle East & Africa
    • Market Attractiveness Analysis By Region
  11. North America Market Analysis 2020 to 2024 and Forecast 2025 to 2035, By Country
    • Historical Market Size Value (USD Million) Trend Analysis By Market Taxonomy, 2020 to 2024
    • Market Size Value (USD Million) Forecast By Market Taxonomy, 2025 to 2035
      • By Country
        • USA
        • Canada
        • Mexico
      • By Nature
      • By Product Type
      • By Application
      • By Distribution Channel
    • Market Attractiveness Analysis
      • By Country
      • By Nature
      • By Product Type
      • By Application
      • By Distribution Channel
    • Key Takeaways
  12. Latin America Market Analysis 2020 to 2024 and Forecast 2025 to 2035, By Country
    • Historical Market Size Value (USD Million) Trend Analysis By Market Taxonomy, 2020 to 2024
    • Market Size Value (USD Million) Forecast By Market Taxonomy, 2025 to 2035
      • By Country
        • Brazil
        • Chile
        • Rest of Latin America
      • By Nature
      • By Product Type
      • By Application
      • By Distribution Channel
    • Market Attractiveness Analysis
      • By Country
      • By Nature
      • By Product Type
      • By Application
      • By Distribution Channel
    • Key Takeaways
  13. Western Europe Market Analysis 2020 to 2024 and Forecast 2025 to 2035, By Country
    • Historical Market Size Value (USD Million) Trend Analysis By Market Taxonomy, 2020 to 2024
    • Market Size Value (USD Million) Forecast By Market Taxonomy, 2025 to 2035
      • By Country
        • Germany
        • UK
        • Italy
        • Spain
        • France
        • Nordic
        • BENELUX
        • Rest of Western Europe
      • By Nature
      • By Product Type
      • By Application
      • By Distribution Channel
    • Market Attractiveness Analysis
      • By Country
      • By Nature
      • By Product Type
      • By Application
      • By Distribution Channel
    • Key Takeaways
  14. Eastern Europe Market Analysis 2020 to 2024 and Forecast 2025 to 2035, By Country
    • Historical Market Size Value (USD Million) Trend Analysis By Market Taxonomy, 2020 to 2024
    • Market Size Value (USD Million) Forecast By Market Taxonomy, 2025 to 2035
      • By Country
        • Russia
        • Poland
        • Hungary
        • Balkan & Baltic
        • Rest of Eastern Europe
      • By Nature
      • By Product Type
      • By Application
      • By Distribution Channel
    • Market Attractiveness Analysis
      • By Country
      • By Nature
      • By Product Type
      • By Application
      • By Distribution Channel
    • Key Takeaways
  15. East Asia Market Analysis 2020 to 2024 and Forecast 2025 to 2035, By Country
    • Historical Market Size Value (USD Million) Trend Analysis By Market Taxonomy, 2020 to 2024
    • Market Size Value (USD Million) Forecast By Market Taxonomy, 2025 to 2035
      • By Country
        • China
        • Japan
        • South Korea
      • By Nature
      • By Product Type
      • By Application
      • By Distribution Channel
    • Market Attractiveness Analysis
      • By Country
      • By Nature
      • By Product Type
      • By Application
      • By Distribution Channel
    • Key Takeaways
  16. South Asia and Pacific Market Analysis 2020 to 2024 and Forecast 2025 to 2035, By Country
    • Historical Market Size Value (USD Million) Trend Analysis By Market Taxonomy, 2020 to 2024
    • Market Size Value (USD Million) Forecast By Market Taxonomy, 2025 to 2035
      • By Country
        • India
        • ASEAN
        • Australia & New Zealand
        • Rest of South Asia and Pacific
      • By Nature
      • By Product Type
      • By Application
      • By Distribution Channel
    • Market Attractiveness Analysis
      • By Country
      • By Nature
      • By Product Type
      • By Application
      • By Distribution Channel
    • Key Takeaways
  17. Middle East & Africa Market Analysis 2020 to 2024 and Forecast 2025 to 2035, By Country
    • Historical Market Size Value (USD Million) Trend Analysis By Market Taxonomy, 2020 to 2024
    • Market Size Value (USD Million) Forecast By Market Taxonomy, 2025 to 2035
      • By Country
        • Kingdom of Saudi Arabia
        • Other GCC Countries
        • Turkiye
        • South Africa
        • Other African Union
        • Rest of Middle East & Africa
      • By Nature
      • By Product Type
      • By Application
      • By Distribution Channel
    • Market Attractiveness Analysis
      • By Country
      • By Nature
      • By Product Type
      • By Application
      • By Distribution Channel
    • Key Takeaways
  18. Key Countries Market Analysis
    • USA
      • Pricing Analysis
      • Market Share Analysis, 2024
        • By Nature
        • By Product Type
        • By Application
        • By Distribution Channel
    • Canada
      • Pricing Analysis
      • Market Share Analysis, 2024
        • By Nature
        • By Product Type
        • By Application
        • By Distribution Channel
    • Mexico
      • Pricing Analysis
      • Market Share Analysis, 2024
        • By Nature
        • By Product Type
        • By Application
        • By Distribution Channel
    • Brazil
      • Pricing Analysis
      • Market Share Analysis, 2024
        • By Nature
        • By Product Type
        • By Application
        • By Distribution Channel
    • Chile
      • Pricing Analysis
      • Market Share Analysis, 2024
        • By Nature
        • By Product Type
        • By Application
        • By Distribution Channel
    • Germany
      • Pricing Analysis
      • Market Share Analysis, 2024
        • By Nature
        • By Product Type
        • By Application
        • By Distribution Channel
    • UK
      • Pricing Analysis
      • Market Share Analysis, 2024
        • By Nature
        • By Product Type
        • By Application
        • By Distribution Channel
    • Italy
      • Pricing Analysis
      • Market Share Analysis, 2024
        • By Nature
        • By Product Type
        • By Application
        • By Distribution Channel
    • Spain
      • Pricing Analysis
      • Market Share Analysis, 2024
        • By Nature
        • By Product Type
        • By Application
        • By Distribution Channel
    • France
      • Pricing Analysis
      • Market Share Analysis, 2024
        • By Nature
        • By Product Type
        • By Application
        • By Distribution Channel
    • India
      • Pricing Analysis
      • Market Share Analysis, 2024
        • By Nature
        • By Product Type
        • By Application
        • By Distribution Channel
    • ASEAN
      • Pricing Analysis
      • Market Share Analysis, 2024
        • By Nature
        • By Product Type
        • By Application
        • By Distribution Channel
    • Australia & New Zealand
      • Pricing Analysis
      • Market Share Analysis, 2024
        • By Nature
        • By Product Type
        • By Application
        • By Distribution Channel
    • China
      • Pricing Analysis
      • Market Share Analysis, 2024
        • By Nature
        • By Product Type
        • By Application
        • By Distribution Channel
    • Japan
      • Pricing Analysis
      • Market Share Analysis, 2024
        • By Nature
        • By Product Type
        • By Application
        • By Distribution Channel
    • South Korea
      • Pricing Analysis
      • Market Share Analysis, 2024
        • By Nature
        • By Product Type
        • By Application
        • By Distribution Channel
    • Russia
      • Pricing Analysis
      • Market Share Analysis, 2024
        • By Nature
        • By Product Type
        • By Application
        • By Distribution Channel
    • Poland
      • Pricing Analysis
      • Market Share Analysis, 2024
        • By Nature
        • By Product Type
        • By Application
        • By Distribution Channel
    • Hungary
      • Pricing Analysis
      • Market Share Analysis, 2024
        • By Nature
        • By Product Type
        • By Application
        • By Distribution Channel
    • Kingdom of Saudi Arabia
      • Pricing Analysis
      • Market Share Analysis, 2024
        • By Nature
        • By Product Type
        • By Application
        • By Distribution Channel
    • Turkiye
      • Pricing Analysis
      • Market Share Analysis, 2024
        • By Nature
        • By Product Type
        • By Application
        • By Distribution Channel
    • South Africa
      • Pricing Analysis
      • Market Share Analysis, 2024
        • By Nature
        • By Product Type
        • By Application
        • By Distribution Channel
  19. Market Structure Analysis
    • Competition Dashboard
    • Competition Benchmarking
    • Market Share Analysis of Top Players
      • By Regional
      • By Nature
      • By Product Type
      • By Application
      • By Distribution Channel
  20. Competition Analysis
    • Competition Deep Dive
      • Danone S.A.
        • Overview
        • Product Portfolio
        • Profitability by Market Segments (Product/Age /Sales Channel/Region)
        • Sales Footprint
        • Strategy Overview
          • Marketing Strategy
          • Product Strategy
          • Channel Strategy
      • Nestlé S.A.
      • Unilever PLC
      • Mondelēz International
      • General Mills Inc.
      • The Hain Celestial Group
      • Dr. Schär AG/SPA
      • Enjoy Life Foods
      • Hero Group
      • Kellogg Company
      • Mars Incorporated
      • The Kraft Heinz Company
      • Others
  21. Assumptions & Acronyms Used
  22. Research Methodology

List of Tables

  • Table 1: Global Market Value (USD Million) Forecast by Region, 2020 to 2035
  • Table 2: Global Market Value (USD Million) Forecast by Nature , 2020 to 2035
  • Table 3: Global Market Value (USD Million) Forecast by Product Type, 2020 to 2035
  • Table 4: Global Market Value (USD Million) Forecast by Application, 2020 to 2035
  • Table 5: Global Market Value (USD Million) Forecast by Distribution Channel, 2020 to 2035
  • Table 6: North America Market Value (USD Million) Forecast by Country, 2020 to 2035
  • Table 7: North America Market Value (USD Million) Forecast by Nature , 2020 to 2035
  • Table 8: North America Market Value (USD Million) Forecast by Product Type, 2020 to 2035
  • Table 9: North America Market Value (USD Million) Forecast by Application, 2020 to 2035
  • Table 10: North America Market Value (USD Million) Forecast by Distribution Channel, 2020 to 2035
  • Table 11: Latin America Market Value (USD Million) Forecast by Country, 2020 to 2035
  • Table 12: Latin America Market Value (USD Million) Forecast by Nature , 2020 to 2035
  • Table 13: Latin America Market Value (USD Million) Forecast by Product Type, 2020 to 2035
  • Table 14: Latin America Market Value (USD Million) Forecast by Application, 2020 to 2035
  • Table 15: Latin America Market Value (USD Million) Forecast by Distribution Channel, 2020 to 2035
  • Table 16: Western Europe Market Value (USD Million) Forecast by Country, 2020 to 2035
  • Table 17: Western Europe Market Value (USD Million) Forecast by Nature , 2020 to 2035
  • Table 18: Western Europe Market Value (USD Million) Forecast by Product Type, 2020 to 2035
  • Table 19: Western Europe Market Value (USD Million) Forecast by Application, 2020 to 2035
  • Table 20: Western Europe Market Value (USD Million) Forecast by Distribution Channel, 2020 to 2035
  • Table 21: Eastern Europe Market Value (USD Million) Forecast by Country, 2020 to 2035
  • Table 22: Eastern Europe Market Value (USD Million) Forecast by Nature , 2020 to 2035
  • Table 23: Eastern Europe Market Value (USD Million) Forecast by Product Type, 2020 to 2035
  • Table 24: Eastern Europe Market Value (USD Million) Forecast by Application, 2020 to 2035
  • Table 25: Eastern Europe Market Value (USD Million) Forecast by Distribution Channel, 2020 to 2035
  • Table 26: East Asia Market Value (USD Million) Forecast by Country, 2020 to 2035
  • Table 27: East Asia Market Value (USD Million) Forecast by Nature , 2020 to 2035
  • Table 28: East Asia Market Value (USD Million) Forecast by Product Type, 2020 to 2035
  • Table 29: East Asia Market Value (USD Million) Forecast by Application, 2020 to 2035
  • Table 30: East Asia Market Value (USD Million) Forecast by Distribution Channel, 2020 to 2035
  • Table 31: South Asia and Pacific Market Value (USD Million) Forecast by Country, 2020 to 2035
  • Table 32: South Asia and Pacific Market Value (USD Million) Forecast by Nature , 2020 to 2035
  • Table 33: South Asia and Pacific Market Value (USD Million) Forecast by Product Type, 2020 to 2035
  • Table 34: South Asia and Pacific Market Value (USD Million) Forecast by Application, 2020 to 2035
  • Table 35: South Asia and Pacific Market Value (USD Million) Forecast by Distribution Channel, 2020 to 2035
  • Table 36: Middle East & Africa Market Value (USD Million) Forecast by Country, 2020 to 2035
  • Table 37: Middle East & Africa Market Value (USD Million) Forecast by Nature , 2020 to 2035
  • Table 38: Middle East & Africa Market Value (USD Million) Forecast by Product Type, 2020 to 2035
  • Table 39: Middle East & Africa Market Value (USD Million) Forecast by Application, 2020 to 2035
  • Table 40: Middle East & Africa Market Value (USD Million) Forecast by Distribution Channel, 2020 to 2035

List of Figures

  • Figure 1: Global Market Pricing Analysis
  • Figure 2: Global Market Value (USD Million) Forecast 2020-2035
  • Figure 3: Global Market Value Share and BPS Analysis by Nature , 2025 and 2035
  • Figure 4: Global Market Y to o to Y Growth Comparison by Nature , 2025-2035
  • Figure 5: Global Market Attractiveness Analysis by Nature
  • Figure 6: Global Market Value Share and BPS Analysis by Product Type, 2025 and 2035
  • Figure 7: Global Market Y to o to Y Growth Comparison by Product Type, 2025-2035
  • Figure 8: Global Market Attractiveness Analysis by Product Type
  • Figure 9: Global Market Value Share and BPS Analysis by Application, 2025 and 2035
  • Figure 10: Global Market Y to o to Y Growth Comparison by Application, 2025-2035
  • Figure 11: Global Market Attractiveness Analysis by Application
  • Figure 12: Global Market Value Share and BPS Analysis by Distribution Channel, 2025 and 2035
  • Figure 13: Global Market Y to o to Y Growth Comparison by Distribution Channel, 2025-2035
  • Figure 14: Global Market Attractiveness Analysis by Distribution Channel
  • Figure 15: Global Market Value (USD Million) Share and BPS Analysis by Region, 2025 and 2035
  • Figure 16: Global Market Y to o to Y Growth Comparison by Region, 2025-2035
  • Figure 17: Global Market Attractiveness Analysis by Region
  • Figure 18: North America Market Incremental Dollar Opportunity, 2025-2035
  • Figure 19: Latin America Market Incremental Dollar Opportunity, 2025-2035
  • Figure 20: Western Europe Market Incremental Dollar Opportunity, 2025-2035
  • Figure 21: Eastern Europe Market Incremental Dollar Opportunity, 2025-2035
  • Figure 22: East Asia Market Incremental Dollar Opportunity, 2025-2035
  • Figure 23: South Asia and Pacific Market Incremental Dollar Opportunity, 2025-2035
  • Figure 24: Middle East & Africa Market Incremental Dollar Opportunity, 2025-2035
  • Figure 25: North America Market Value Share and BPS Analysis by Country, 2025 and 2035
  • Figure 26: North America Market Value Share and BPS Analysis by Nature , 2025 and 2035
  • Figure 27: North America Market Y to o to Y Growth Comparison by Nature , 2025-2035
  • Figure 28: North America Market Attractiveness Analysis by Nature
  • Figure 29: North America Market Value Share and BPS Analysis by Product Type, 2025 and 2035
  • Figure 30: North America Market Y to o to Y Growth Comparison by Product Type, 2025-2035
  • Figure 31: North America Market Attractiveness Analysis by Product Type
  • Figure 32: North America Market Value Share and BPS Analysis by Application, 2025 and 2035
  • Figure 33: North America Market Y to o to Y Growth Comparison by Application, 2025-2035
  • Figure 34: North America Market Attractiveness Analysis by Application
  • Figure 35: North America Market Value Share and BPS Analysis by Distribution Channel, 2025 and 2035
  • Figure 36: North America Market Y to o to Y Growth Comparison by Distribution Channel, 2025-2035
  • Figure 37: North America Market Attractiveness Analysis by Distribution Channel
  • Figure 38: Latin America Market Value Share and BPS Analysis by Country, 2025 and 2035
  • Figure 39: Latin America Market Value Share and BPS Analysis by Nature , 2025 and 2035
  • Figure 40: Latin America Market Y to o to Y Growth Comparison by Nature , 2025-2035
  • Figure 41: Latin America Market Attractiveness Analysis by Nature
  • Figure 42: Latin America Market Value Share and BPS Analysis by Product Type, 2025 and 2035
  • Figure 43: Latin America Market Y to o to Y Growth Comparison by Product Type, 2025-2035
  • Figure 44: Latin America Market Attractiveness Analysis by Product Type
  • Figure 45: Latin America Market Value Share and BPS Analysis by Application, 2025 and 2035
  • Figure 46: Latin America Market Y to o to Y Growth Comparison by Application, 2025-2035
  • Figure 47: Latin America Market Attractiveness Analysis by Application
  • Figure 48: Latin America Market Value Share and BPS Analysis by Distribution Channel, 2025 and 2035
  • Figure 49: Latin America Market Y to o to Y Growth Comparison by Distribution Channel, 2025-2035
  • Figure 50: Latin America Market Attractiveness Analysis by Distribution Channel
  • Figure 51: Western Europe Market Value Share and BPS Analysis by Country, 2025 and 2035
  • Figure 52: Western Europe Market Value Share and BPS Analysis by Nature , 2025 and 2035
  • Figure 53: Western Europe Market Y to o to Y Growth Comparison by Nature , 2025-2035
  • Figure 54: Western Europe Market Attractiveness Analysis by Nature
  • Figure 55: Western Europe Market Value Share and BPS Analysis by Product Type, 2025 and 2035
  • Figure 56: Western Europe Market Y to o to Y Growth Comparison by Product Type, 2025-2035
  • Figure 57: Western Europe Market Attractiveness Analysis by Product Type
  • Figure 58: Western Europe Market Value Share and BPS Analysis by Application, 2025 and 2035
  • Figure 59: Western Europe Market Y to o to Y Growth Comparison by Application, 2025-2035
  • Figure 60: Western Europe Market Attractiveness Analysis by Application
  • Figure 61: Western Europe Market Value Share and BPS Analysis by Distribution Channel, 2025 and 2035
  • Figure 62: Western Europe Market Y to o to Y Growth Comparison by Distribution Channel, 2025-2035
  • Figure 63: Western Europe Market Attractiveness Analysis by Distribution Channel
  • Figure 64: Eastern Europe Market Value Share and BPS Analysis by Country, 2025 and 2035
  • Figure 65: Eastern Europe Market Value Share and BPS Analysis by Nature , 2025 and 2035
  • Figure 66: Eastern Europe Market Y to o to Y Growth Comparison by Nature , 2025-2035
  • Figure 67: Eastern Europe Market Attractiveness Analysis by Nature
  • Figure 68: Eastern Europe Market Value Share and BPS Analysis by Product Type, 2025 and 2035
  • Figure 69: Eastern Europe Market Y to o to Y Growth Comparison by Product Type, 2025-2035
  • Figure 70: Eastern Europe Market Attractiveness Analysis by Product Type
  • Figure 71: Eastern Europe Market Value Share and BPS Analysis by Application, 2025 and 2035
  • Figure 72: Eastern Europe Market Y to o to Y Growth Comparison by Application, 2025-2035
  • Figure 73: Eastern Europe Market Attractiveness Analysis by Application
  • Figure 74: Eastern Europe Market Value Share and BPS Analysis by Distribution Channel, 2025 and 2035
  • Figure 75: Eastern Europe Market Y to o to Y Growth Comparison by Distribution Channel, 2025-2035
  • Figure 76: Eastern Europe Market Attractiveness Analysis by Distribution Channel
  • Figure 77: East Asia Market Value Share and BPS Analysis by Country, 2025 and 2035
  • Figure 78: East Asia Market Value Share and BPS Analysis by Nature , 2025 and 2035
  • Figure 79: East Asia Market Y to o to Y Growth Comparison by Nature , 2025-2035
  • Figure 80: East Asia Market Attractiveness Analysis by Nature
  • Figure 81: East Asia Market Value Share and BPS Analysis by Product Type, 2025 and 2035
  • Figure 82: East Asia Market Y to o to Y Growth Comparison by Product Type, 2025-2035
  • Figure 83: East Asia Market Attractiveness Analysis by Product Type
  • Figure 84: East Asia Market Value Share and BPS Analysis by Application, 2025 and 2035
  • Figure 85: East Asia Market Y to o to Y Growth Comparison by Application, 2025-2035
  • Figure 86: East Asia Market Attractiveness Analysis by Application
  • Figure 87: East Asia Market Value Share and BPS Analysis by Distribution Channel, 2025 and 2035
  • Figure 88: East Asia Market Y to o to Y Growth Comparison by Distribution Channel, 2025-2035
  • Figure 89: East Asia Market Attractiveness Analysis by Distribution Channel
  • Figure 90: South Asia and Pacific Market Value Share and BPS Analysis by Country, 2025 and 2035
  • Figure 91: South Asia and Pacific Market Value Share and BPS Analysis by Nature , 2025 and 2035
  • Figure 92: South Asia and Pacific Market Y to o to Y Growth Comparison by Nature , 2025-2035
  • Figure 93: South Asia and Pacific Market Attractiveness Analysis by Nature
  • Figure 94: South Asia and Pacific Market Value Share and BPS Analysis by Product Type, 2025 and 2035
  • Figure 95: South Asia and Pacific Market Y to o to Y Growth Comparison by Product Type, 2025-2035
  • Figure 96: South Asia and Pacific Market Attractiveness Analysis by Product Type
  • Figure 97: South Asia and Pacific Market Value Share and BPS Analysis by Application, 2025 and 2035
  • Figure 98: South Asia and Pacific Market Y to o to Y Growth Comparison by Application, 2025-2035
  • Figure 99: South Asia and Pacific Market Attractiveness Analysis by Application
  • Figure 100: South Asia and Pacific Market Value Share and BPS Analysis by Distribution Channel, 2025 and 2035
  • Figure 101: South Asia and Pacific Market Y to o to Y Growth Comparison by Distribution Channel, 2025-2035
  • Figure 102: South Asia and Pacific Market Attractiveness Analysis by Distribution Channel
  • Figure 103: Middle East & Africa Market Value Share and BPS Analysis by Country, 2025 and 2035
  • Figure 104: Middle East & Africa Market Value Share and BPS Analysis by Nature , 2025 and 2035
  • Figure 105: Middle East & Africa Market Y to o to Y Growth Comparison by Nature , 2025-2035
  • Figure 106: Middle East & Africa Market Attractiveness Analysis by Nature
  • Figure 107: Middle East & Africa Market Value Share and BPS Analysis by Product Type, 2025 and 2035
  • Figure 108: Middle East & Africa Market Y to o to Y Growth Comparison by Product Type, 2025-2035
  • Figure 109: Middle East & Africa Market Attractiveness Analysis by Product Type
  • Figure 110: Middle East & Africa Market Value Share and BPS Analysis by Application, 2025 and 2035
  • Figure 111: Middle East & Africa Market Y to o to Y Growth Comparison by Application, 2025-2035
  • Figure 112: Middle East & Africa Market Attractiveness Analysis by Application
  • Figure 113: Middle East & Africa Market Value Share and BPS Analysis by Distribution Channel, 2025 and 2035
  • Figure 114: Middle East & Africa Market Y to o to Y Growth Comparison by Distribution Channel, 2025-2035
  • Figure 115: Middle East & Africa Market Attractiveness Analysis by Distribution Channel
  • Figure 116: Global Market - Tier Structure Analysis
  • Figure 117: Global Market - Company Share Analysis
Dashboard
Dashboard
Dashboard
Dashboard
Dashboard
Dashboard

Full Research Suite comprises of:

Market outlook & trends analysis

Market outlook & trends analysis

Interviews & case studies

Interviews & case studies

Strategic recommendations

Strategic recommendations

Vendor profiles & capabilities analysis

Vendor profiles & capabilities analysis

5-year forecasts

5-year forecasts

8 regions and 60+ country-level data splits

8 regions and 60+ country-level data splits

Market segment data splits

Market segment data splits

12 months of continuous data updates

12 months of continuous data updates

DELIVERED AS:

PDF EXCEL ONLINE

Full Research Suite


$3500

$5000

$6500

Buy Report Now
Similar Industry Reports

Similar Industry Reports

Demand Signal Repository Solutions Market

Demand Signal Repository Solutions Market Size and Share Forecast Outlook 2025 to 2035

Demand Side Management Market

Demand Side Management Market Size and Share Forecast Outlook 2025 to 2035

Demand Response Market

Demand Response Market Analysis - Size, Share, and Forecast Outlook 2025 to 2035

Demand Analysis of Shipping Supplies in North America

North America Shipping Supplies Market Trends – Innovations & Growth 2024-2034

Demand of Kozani Saffron in Greece

Demand of Kozani Saffron in Greece Analysis - Size, Share & Forecast 2025 to 2035

Demand of No-acid Whey Strained Dairy Processing Concepts

Demand of No-acid Whey Strained Dairy Processing Concepts in European Union Size and Share Forecast Outlook 2025 to 2035

Demand of Bronte Pistachio in Italy

Demand for Bronte Pistachio in Italy Analysis - Size, Share & Forecast 2025 to 2035

Demand and Trend Analysis of Gaming Monitor in Japan

Demand and Trend Analysis of Gaming Monitor in Japan Size and Share Forecast Outlook 2025 to 2035

Demand and Trend Analysis of Gaming Monitor in Korea

Demand and Trend Analysis of Gaming Monitor in Korea Size and Share Forecast Outlook 2025 to 2035

Demand and Trend Analysis of Gaming Monitor in Western Europe

Demand and Trend Analysis of Gaming Monitor in Western Europe Size and Share Forecast Outlook 2025 to 2035

Demand and Trend Analysis of Glycine Soja (Soybean) Seed Extract Market

Glycine Soja (Soybean) Seed Extract Market Size and Share Forecast Outlook 2025 to 2035

Demand and Trend Analysis of Yeast in Japan

Demand and Trend Analysis of Yeast in Japan - Size, Share, and Forecast Outlook 2025 to 2035

Demand and Trends Analysis of Stevia in Japan

Demand and Trends Analysis of Stevia in Japan Size and Share Forecast Outlook 2025 to 2035

Demand of Pistachio-based desserts & ingredients in France

Demand of Pistachio-based desserts & ingredients in France Analysis - Size, Share & Forecast 2025 to 2035

Demand and Trend Analysis of Women’s Intimate Care Product in Japan

Japan Women’s Intimate Care Market Trends – Growth & Forecast 2024-2034

Demand and Trend Analysis of Men’s Skincare Product in Western Europe

Western Europe Men’s Skincare Market Analysis – Forecast 2023-2033

Demand and Trend Analysis of Fabric Stain Remover in Korea

Demand and Trend Analysis of Fabric Stain Remover in Korea Size and Share Forecast Outlook 2025 to 2035

Demand and Sales Analysis of Paper Cup in Japan

Demand and Sales Analysis of Paper Cup in Japan Size and Share Forecast Outlook 2025 to 2035

Demand and Sales Analysis of Paper Cup in Korea

Demand and Sales Analysis of Paper Cup in Korea Size and Share Forecast Outlook 2025 to 2035

Demand of MFGM-enriched Powders & RTDs in European Union

Demand of MFGM-enriched Powders & RTDs in European Union Size and Share Forecast Outlook 2025 to 2035

Future Market Insights

Demand for Allergen-free Food in EU

Chat With MaRIA

Chat With

MaRIA

Hi There, I am MaRIA, Your Market Research Intelligence Assistant. How may I help you?