The EU beet pulp industry is likely to grow from USD 83 million in 2025 to USD 120.5 million by 2035, advancing at a CAGR of 3.8%. The dried pulp segment (pellets & shreds) is expected to lead sales with a 45.6% share in 2025, while cow feed application is anticipated to account for 56.0% of the total livestock demand. As highlighted in FMI’s comprehensive report on global dietary behavior and flavor adoption patterns, the industry size is expected to grow by 1.45X during the same period, supported by the increasing demand for sustainable animal feed ingredients, growing dairy and livestock production across Europe, and expanding recognition of beet pulp's nutritional benefits as a digestible fiber source throughout European agricultural markets.
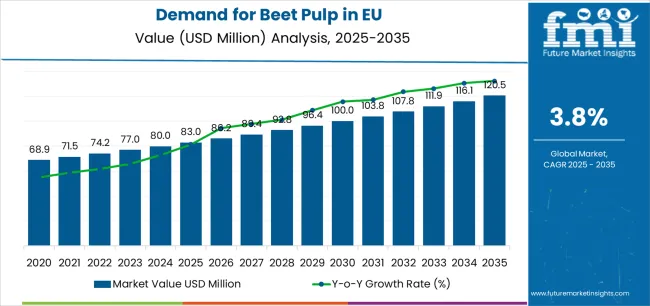
Between 2025 and 2030, EU beet pulp demand is projected to expand from USD 83 million to USD 96.6 million, resulting in a value increase of USD 16.3 million, which represents 45.5% of the total forecast growth for the decade. This phase of development will be shaped by rising awareness of beet pulp's benefits as a cost-effective feed ingredient, increasing adoption in dairy farming operations seeking to optimize milk production, and growing emphasis on circular economy principles utilizing sugar production byproducts. Feed manufacturers are expanding their formulations to incorporate beet pulp as a sustainable fiber source addressing evolving requirements for digestible energy, palatability enhancement, and rumen health support in livestock nutrition.
From 2030 to 2035, sales are forecast to grow from USD 96.6 million to USD 120.5 million, adding another USD 19.5 million, which constitutes 54.5% of the overall ten-year expansion. This period is expected to be characterized by technological advancement in pulp processing and preservation, integration of beet pulp into specialized feed formulations for performance animals, and development of value-added products targeting specific nutritional requirements. The growing emphasis on sustainable livestock production and increasing recognition of beet pulp's prebiotic properties will drive demand for high-quality beet pulp products that deliver consistent nutritional value with improved storage stability and handling characteristics.
Between 2020 and 2025, EU beet pulp sales experienced steady expansion from USD 66.8 million to USD 83 million, demonstrating resilient market growth driven by stable sugar beet production, established supply chains from sugar refineries, and consistent demand from livestock producers. The industry developed as sugar producers recognized the commercial value of beet pulp beyond waste management, investing in drying facilities, pelletization equipment, and quality control systems. Product standardization, nutritional research validation, and supply chain optimization began establishing beet pulp as an essential feed ingredient rather than merely a byproduct of sugar production.
Industry expansion is being supported by the increasing focus on sustainable livestock production requiring environmentally responsible feed ingredients with proven carbon footprint benefits, and the corresponding demand for agricultural byproducts that maximize resource utilization while delivering nutritional value comparable to conventional feed ingredients. Modern livestock producers rely on beet pulp as a versatile feed component supporting digestive health, energy provision, and palatability enhancement, driving demand for products that deliver consistent quality, including standardized moisture content, predictable nutritional profiles, and absence of contaminants through controlled processing methods.
The growing awareness of beet pulp's unique nutritional composition, featuring highly digestible fiber, pectin content supporting beneficial fermentation, and moderate energy density suitable for various livestock species, is driving demand for quality beet pulp from certified European processors with appropriate quality assurance systems. Regulatory authorities across EU member states maintain standards for feed ingredient safety, mycotoxin limits, and quality parameters ensuring animal health while supporting productive performance. Scientific research studies and feeding trials are providing evidence supporting beet pulp's benefits in dairy production, equine nutrition, and small ruminant feeding, requiring specialized processing methods and standardized production protocols for moisture control, preservation quality, and nutrient retention.
The circular economy principles embraced by European agriculture, emphasizing waste reduction, resource optimization, and value extraction from agricultural processing streams, position beet pulp as an exemplary model of sustainable intensification. Sugar beet processing's integration with livestock production creates synergistic value chains reducing transportation costs, minimizing waste disposal challenges, and generating economic value from materials previously considered waste. This sustainability positioning proves particularly compelling for feed manufacturers seeking to reduce environmental impact while maintaining nutritional quality and cost competitiveness in increasingly sustainability-conscious European markets.
Sales are segmented by product type, application (livestock), distribution channel, and nature. By product type, demand is divided into dried pulp (pellets & shreds), pressed pulp, wet pulp, and ensiled pulp. Based on application, sales are categorized by livestock type including cow, horse, sheep, goat, pig, and others (buffaloes, mules, asses). In terms of distribution channel, demand is segmented into modern trade, specialty stores, departmental stores, convenience stores, and online retailers. By nature, sales are classified into molassed and unmolassed categories. Regionally, demand is distributed across Germany, France, Italy, Spain, the Netherlands, and the Rest of Europe.
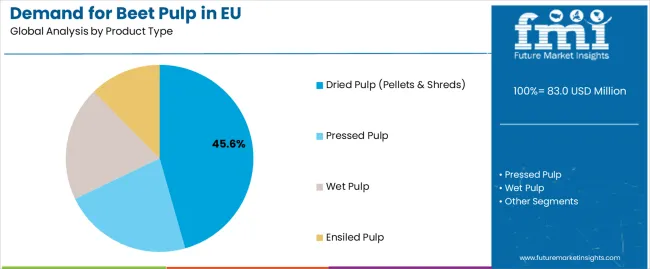
The dried pulp segment (pellets & shreds) is projected to account for 45.6% of EU beet pulp sales in 2025, expanding to 47.6% by 2035, establishing itself as the preferred format across European livestock operations. This dominant position is fundamentally supported by dried pulp's superior storage stability, convenient handling characteristics, and consistent nutritional value enabling year-round utilization regardless of seasonal production variations. The dried format delivers essential practical advantages, providing feed manufacturers and livestock producers with standardized ingredient meeting specifications for industrial feed production and on-farm mixing systems.
This segment benefits from established processing infrastructure, efficient logistics networks, and quality standardization enabling international trade and long-distance transportation without quality degradation. Additionally, dried pulp offers versatility across multiple livestock species, various feeding systems from total mixed rations to supplemental feeding, and different production scales from industrial feed mills to small farm operations, supported by pelletization technology improving handling efficiency and reducing dust generation.
The segment's growing share through 2035 reflects increasing preference for convenience and standardization, with dried formats capturing market share from wet alternatives requiring immediate utilization or specialized storage throughout the forecast period.
Key advantages:
.webp)
Cow feed applications are positioned to represent 56.0% of total beet pulp demand across European livestock operations in 2025, slightly declining to 55.0% by 2035, reflecting the segment's dominance driven by extensive dairy farming across Europe and beet pulp's proven benefits for milk production. This considerable share directly demonstrates that dairy and beef cattle represent the primary consumers, with farmers utilizing beet pulp for energy supplementation, fiber provision, and palatability enhancement in total mixed rations and concentrated feed formulations.
Modern dairy operations increasingly view beet pulp as essential feed ingredient delivering digestible fiber supporting rumen function, moderate energy density preventing acidosis, and palatability improving feed intake, driving demand for products optimized for consistent quality, appropriate particle size for optimal rumen retention, and molasses content balancing energy provision with storage stability. The segment benefits from extensive research validating beet pulp's positive impacts on milk yield, established feeding recommendations from nutritionists, and widespread acceptance among dairy farmers recognizing economic benefits.
The segment's modest share decline reflects diversification into other livestock applications, with equine and small ruminant sectors showing marginally faster growth rates throughout the forecast period.
Key drivers:
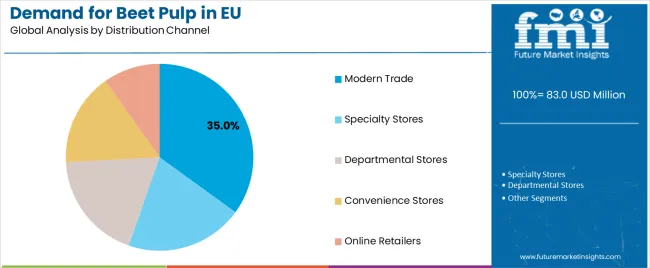
Modern trade channels are strategically estimated to control 35.0% of total European beet pulp sales in 2025, slightly declining to 34.0% by 2035 as online channels expand, reflecting the importance of agricultural cooperatives, feed wholesalers, and integrated supply chains serving commercial livestock operations. European agricultural retailers consistently maintain beet pulp within core feed ingredient portfolios, providing bulk delivery options, technical support, and credit facilities essential for commercial farming operations.
The segment provides critical infrastructure through established logistics networks, storage facilities, and distribution capabilities enabling efficient movement from sugar refineries to end users. Major agricultural suppliers, including ForFarmers, De Heus, and regional cooperatives, systematically optimize beet pulp distribution, offering various formats, quality grades, and delivery options supporting diverse customer requirements from large dairy operations to small livestock holdings.
The segment's stable share reflects balanced growth across channels, with online retail growing from 15.0% to 20.0% share as digital platforms capture increased sales through convenience, price transparency, and direct-to-farm delivery services throughout the forecast period.
Success factors:
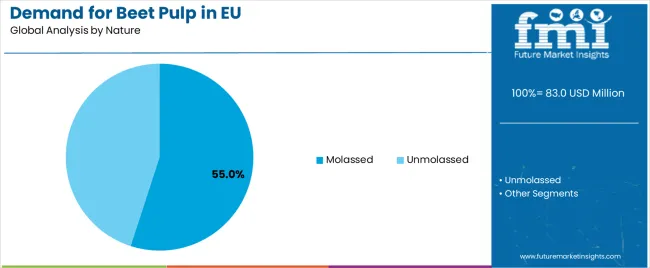
Molassed beet pulp products are strategically positioned to contribute 55.0% of total European sales in 2025, expanding slightly to 56.0% by 2035, representing products enhanced with molasses addition improving palatability, energy density, and binding properties compared to unmolassed alternatives. These molassed products successfully balance nutritional enhancement with practical benefits while maintaining competitive pricing that appeals to cost-conscious livestock producers seeking performance optimization.
Molassed positioning serves dairy operations prioritizing palatability, equine facilities seeking safe energy sources, and feed manufacturers requiring binding properties in pelleted formulations. The segment derives competitive advantages from enhanced palatability improving feed intake, increased energy density supporting production performance, and improved pellet quality reducing fines generation during handling and transportation.
The segment's stable share through 2035 reflects consistent demand patterns, with molassed varieties maintaining slight majority as farmers balance performance benefits against cost considerations and storage stability requirements throughout the forecast period.
EU beet pulp sales are advancing steadily due to increasing demand for sustainable feed ingredients, growing dairy sector requiring digestible fiber sources, and rising awareness of circular economy benefits in agricultural production. The industry faces challenges, including dependency on sugar beet production volumes affecting supply stability, competition from alternative fiber sources including citrus pulp and soy hulls, and quality variability depending on processing methods and storage conditions. Continued investment in processing technology, quality standardization, and market development remains central to industry growth.
The rapidly advancing development of specialized drying and preservation technologies is fundamentally transforming beet pulp from basic byproduct to standardized feed ingredient, enabling consistent quality specifications, extended shelf life, and enhanced nutritional preservation previously unattainable through traditional processing methods. Advanced processing platforms featuring drum drying, steam conditioning, and controlled fermentation allow processors to create beet pulp products with optimized moisture levels, preserved nutritional value, and enhanced digestibility characteristics meeting specific livestock requirements. These technological innovations prove particularly transformative for export markets, specialty animal feeds, and premium positioning where quality consistency determines market acceptance.
Major sugar companies invest heavily in pulp processing infrastructure, quality control systems, and product development capabilities, recognizing that beet pulp valorization represents significant revenue opportunities beyond traditional commodity trading. Processors collaborate with equipment manufacturers, nutritionists, and livestock producers to develop processing protocols optimizing nutritional retention, physical characteristics, and storage stability while minimizing energy consumption and environmental impact.
Modern beet pulp producers systematically incorporate nutritional enhancements, including mineral supplementation, vitamin fortification, and probiotic additions that transform basic fiber ingredient into functional feed component delivering comprehensive nutritional benefits beyond simple fiber provision. Strategic integration of fortification technologies optimized for ruminant nutrition enables processors to position enhanced beet pulp as premium feed ingredient where added nutritional value justifies price premiums. These nutritional improvements prove essential for intensive livestock operations, performance animals, and specialty markets demanding optimized nutrition supporting maximum productive efficiency.
Companies implement extensive fortification programs, nutritional optimization initiatives, and quality assurance systems targeting value-added product development, including calcium supplementation for dairy cows, vitamin E addition for antioxidant benefits, and yeast culture incorporation supporting rumen function. Manufacturers leverage nutritional enhancement in marketing differentiation, technical support programs featuring customized feeding recommendations, and premium pricing strategies positioning fortified beet pulp products as performance-enhancing ingredients rather than commodity fiber sources.
European feed manufacturers increasingly demand beet pulp with comprehensive sustainability credentials featuring carbon footprint verification, sustainable cultivation certification, and complete supply chain traceability that differentiate responsible suppliers through environmental transparency and social accountability. This sustainability emphasis enables processors to capture premium markets through certified sustainable products, corporate responsibility programs, and environmental marketing resonating with consumers increasingly concerned about livestock production's environmental impact. Sustainability certification proves particularly important for export markets where environmental credentials influence purchasing decisions and regulatory compliance.
The development of sustainability standards, traceability systems, and environmental reporting frameworks expands processors' abilities to create differentiated products meeting corporate sustainability commitments without compromising nutritional quality or economic viability. Companies collaborate with certification bodies, sustainability consultants, and supply chain partners to develop comprehensive sustainability programs balancing environmental protection with economic sustainability, supporting premium positioning while maintaining cost competitiveness across increasingly sustainability-focused European markets.
EU beet pulp sales are projected to grow from USD 83 million in 2025 to USD 120.5 million by 2035, registering an overall CAGR of 3.8% over the forecast period. Individual European markets demonstrate differentiated growth trajectories reflecting varying livestock sector dynamics, sugar beet production capacities, and feed industry development levels. Germany leads with the highest growth at 4.3% CAGR, followed by the Netherlands at 4.1% CAGR, while mature markets show more modest expansion rates.
Germany maintains the dominant share at 35.0% in 2025, driven by extensive sugar beet production, large dairy sector, and advanced feed industry infrastructure. France follows with 29.6% share, attributed to significant livestock production and established beet processing capacity. Rest of Europe represents 15.2% share, while Italy accounts for 9.3%. Spain maintains 6.5% share, and the Netherlands holds 4.4% share despite its strategic importance in European feed trade and intensive livestock production.
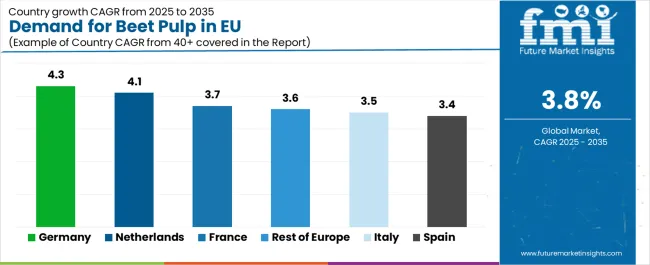
| Country | CAGR % (2025-2035) |
|---|---|
| Germany | 4.3% |
| France | 3.7% |
| Rest of Europe | 3.6% |
| Italy | 3.5% |
| Spain | 3.4% |
| Netherlands | 4.1% |
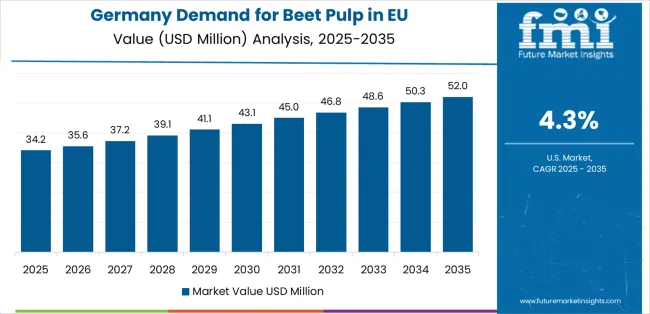
The beet pulp industry in Germany is projected to grow from USD 28.1 million in 2025 to USD 42.6 million by 2035, achieving the highest CAGR of 4.3% throughout the forecast period, driven by Germany's position as Europe's largest sugar beet producer, extensive dairy farming sector requiring quality feed ingredients, and sophisticated feed industry infrastructure supporting value-added processing. Germany's integrated value chains linking sugar production with livestock feeding create operational efficiencies, logistical advantages, and quality consistency supporting market leadership.
Major German sugar companies, including Südzucker, Nordzucker, and Pfeifer & Langen, maintain extensive beet pulp processing capabilities, offering various product formats, quality grades, and specialized formulations serving diverse livestock sectors. German demand benefits from technical sophistication in animal nutrition, strong research and development capabilities, and farmer education programs promoting optimal beet pulp utilization. The presence of major feed companies ensures continuous innovation, competitive pricing, and efficient distribution supporting sustained market growth.
Growth drivers:
The beet pulp in France is expanding from USD 23.8 million in 2025 to USD 34.2 million by 2035 at a CAGR of 3.7%, supported by France's substantial sugar beet production, diverse livestock sector spanning dairy, beef, and small ruminants, and established agricultural cooperatives facilitating efficient distribution. France's agricultural tradition emphasizing quality feed ingredients and technical livestock management drives consistent demand for beet pulp across various production systems.
Major French sugar cooperatives, including Tereos and Cristal Union, systematically optimize beet pulp valorization through modern processing facilities, quality standardization, and market development initiatives. French sales particularly benefit from strong dairy sector in Normandy and Brittany, growing interest in sustainable feed ingredients, and technical support services helping farmers optimize feeding strategies.
Success factors:
Revenue from beet pulp in the Netherlands is growing from USD 3.5 million in 2025 to USD 5.4 million by 2035 at a robust CAGR of 4.1%, fundamentally driven by intensive livestock production systems, sophisticated feed industry, and strategic position as European feed trading hub despite limited domestic sugar beet production. The Netherlands' highly efficient agricultural sector and focus on precision feeding create demand for quality beet pulp optimizing production efficiency.
Dutch feed companies, including ForFarmers and De Heus, leverage international sourcing networks, advanced formulation capabilities, and efficient logistics to serve intensive dairy and pig operations requiring consistent quality ingredients. Netherlands sales benefit from technical expertise in animal nutrition, innovation in feed processing, and role as distribution hub serving broader Northwest European markets. The country's emphasis on sustainable intensification and circular agriculture supports premium beet pulp adoption despite relatively small absolute market size.
Development factors:
Demand for beet pulp in Italy is projected to grow from USD 7.5 million in 2025 to USD 10.6 million by 2035 at a CAGR of 3.5%, supported by concentrated livestock production in northern regions, moderate sugar beet cultivation in Po Valley, and growing awareness of beet pulp benefits among Italian farmers. Italian market development reflects regional variations with northern areas showing stronger adoption compared to traditional extensive systems in central and southern regions.
Major Italian sugar producers and agricultural cooperatives gradually expand beet pulp distribution responding to demand from intensive dairy operations in Lombardy and Emilia-Romagna. Italian sales benefit from increasing focus on feed cost optimization, growing technical support from nutritionist consultants, and EU agricultural policies supporting sustainable feeding practices. The market shows potential for acceleration as traditional feeding systems modernize and farmers recognize beet pulp's economic advantages.
Growth enablers:
Demand for beet pulp in Spain is expanding from USD 5.2 million in 2025 to USD 7.3 million by 2035 at a CAGR of 3.4%, reflecting limited domestic sugar beet production, traditional feeding systems slowly adopting modern ingredients, and growing awareness of beet pulp benefits particularly in intensive dairy regions. Spanish market development follows broader European trends with temporal lag reflecting structural factors and traditional preferences for alternative feed ingredients.
Spanish livestock producers, particularly in northern dairy regions and intensive pig production areas, gradually incorporate beet pulp into feeding programs supported by technical advisors and feed company recommendations. Spain's growing focus on production efficiency, increasing feed costs, and sustainability requirements support gradual market development, though from relatively small base compared to major beet-producing countries. Educational initiatives and demonstration projects prove essential for building farmer confidence and adoption.
Market characteristics:
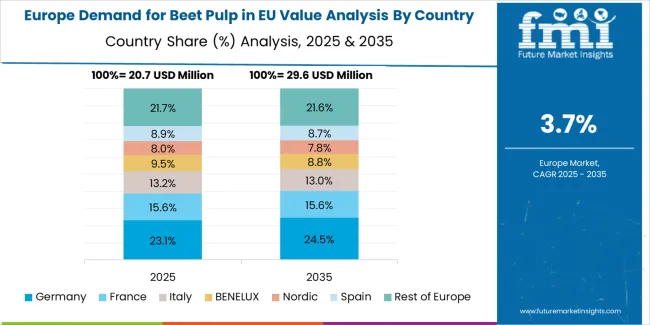
The Rest of Europe region is projected to expand from USD 12.2 million in 2025 to USD 17.5 million by 2035 at a CAGR of 3.6%, encompassing diverse markets including Poland with expanding dairy sector, Belgium with intensive livestock production, Austria with quality-focused farming, and Eastern European countries developing modern livestock systems. This heterogeneous region shows varied development patterns reflecting different agricultural structures, economic development levels, and feeding traditions.
Eastern European markets, particularly Poland and Czech Republic, demonstrate growing adoption as livestock sectors modernize and farmers seek cost-effective feed ingredients. Scandinavian countries show interest in sustainable feed sources despite limited sugar beet production. Smaller markets like Belgium, Austria, and Denmark leverage proximity to major producers and sophisticated feed industries supporting beet pulp utilization. The region's diversity creates opportunities for targeted market development addressing specific national requirements and production systems.
Regional growth factors:
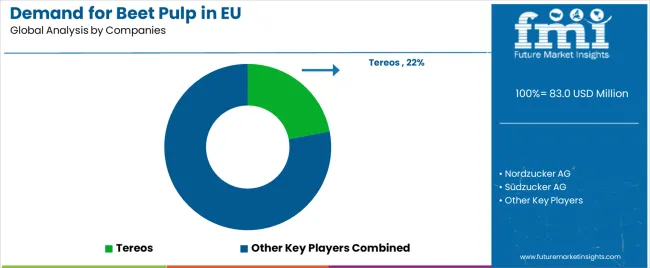
EU beet pulp sales are defined by competition among major sugar companies, agricultural cooperatives, feed ingredient traders, and specialized processors. Companies are investing in drying technologies, pelletization capabilities, quality standardization, and logistics infrastructure to deliver consistent, high-quality beet pulp products meeting diverse livestock sector requirements. Strategic partnerships with feed manufacturers, distribution network optimization, and technical support services emphasizing nutritional benefits and feeding recommendations are central to strengthening competitive position.
Tereos holds an estimated 22.0% share, leveraging its large EU processing capacity, extensive pelletization facilities, and established relationships with feed manufacturers across multiple European markets. Tereos benefits from economies of scale, integrated sugar-livestock value chains, and ability to provide consistent year-round supply through multiple processing locations supporting market leadership.
Nordzucker maintains approximately 20.0% share, emphasizing extensive EU sugar-beet plants, northern European market strength, and quality standardization supporting premium positioning. Nordzucker's success in developing efficient drying technologies, maintaining consistent quality specifications, and building long-term customer relationships creates strong market position, supported by sustainability initiatives and technical expertise.
Other companies collectively hold 58.0% share, reflecting the fragmented nature of European beet pulp sales, where numerous regional sugar producers, agricultural cooperatives, smaller processors, and trading companies serve specific geographic markets, livestock sectors, and customer segments. This competitive environment provides opportunities for differentiation through specialized products, regional focus, sustainability certification, and technical support services resonating with diverse customer requirements.
| Item | Value |
|---|---|
| Quantitative Units | USD 120.5 million (2035) |
| Product Type | Dried Pulp (Pellets & Shreds), Pressed Pulp, Wet Pulp, Ensiled Pulp |
| Application (Livestock) | Cow, Horse, Sheep, Goat, Pig, Others (Buffaloes, Mules, Asses) |
| Distribution Channel | Modern Trade, Specialty Stores, Departmental Stores, Convenience Stores, Online Retailers |
| Nature | Molassed, Unmolassed |
| Countries Covered | Germany, France, Italy, Spain, the Netherlands, and the Rest of Europe |
| Key Companies Profiled | Tereos, Nordzucker, Major sugar producers, Regional cooperatives |
| Additional Attributes | Dollar sales by product type, application, distribution channel, and nature; regional demand trends across major European economies; competitive landscape analysis with sugar companies and feed suppliers; market dynamics for various pulp formats and preservation methods; integration with sugar industry value chains; innovations in drying and pelletization technologies; adoption across livestock sectors; regulatory framework analysis for feed ingredients and quality standards; supply chain strategies from sugar refineries to farms; and penetration analysis for conventional and specialized European livestock operations |
Product Type
The global demand for beet pulp in EU is estimated to be valued at USD 83.0 million in 2025.
The market size for the demand for beet pulp in EU is projected to reach USD 120.5 million by 2035.
The demand for beet pulp in EU is expected to grow at a 3.8% CAGR between 2025 and 2035.
The key product types in demand for beet pulp in EU are dried pulp (pellets & shreds), pressed pulp, wet pulp and ensiled pulp.
In terms of application (livestock), cow segment to command 56.0% share in the demand for beet pulp in EU in 2025.


Our Research Products

The "Full Research Suite" delivers actionable market intel, deep dives on markets or technologies, so clients act faster, cut risk, and unlock growth.

The Leaderboard benchmarks and ranks top vendors, classifying them as Established Leaders, Leading Challengers, or Disruptors & Challengers.

Locates where complements amplify value and substitutes erode it, forecasting net impact by horizon

We deliver granular, decision-grade intel: market sizing, 5-year forecasts, pricing, adoption, usage, revenue, and operational KPIs—plus competitor tracking, regulation, and value chains—across 60 countries broadly.

Spot the shifts before they hit your P&L. We track inflection points, adoption curves, pricing moves, and ecosystem plays to show where demand is heading, why it is changing, and what to do next across high-growth markets and disruptive tech

Real-time reads of user behavior. We track shifting priorities, perceptions of today’s and next-gen services, and provider experience, then pace how fast tech moves from trial to adoption, blending buyer, consumer, and channel inputs with social signals (#WhySwitch, #UX).

Partner with our analyst team to build a custom report designed around your business priorities. From analysing market trends to assessing competitors or crafting bespoke datasets, we tailor insights to your needs.
Supplier Intelligence
Discovery & Profiling
Capacity & Footprint
Performance & Risk
Compliance & Governance
Commercial Readiness
Who Supplies Whom
Scorecards & Shortlists
Playbooks & Docs
Category Intelligence
Definition & Scope
Demand & Use Cases
Cost Drivers
Market Structure
Supply Chain Map
Trade & Policy
Operating Norms
Deliverables
Buyer Intelligence
Account Basics
Spend & Scope
Procurement Model
Vendor Requirements
Terms & Policies
Entry Strategy
Pain Points & Triggers
Outputs
Pricing Analysis
Benchmarks
Trends
Should-Cost
Indexation
Landed Cost
Commercial Terms
Deliverables
Brand Analysis
Positioning & Value Prop
Share & Presence
Customer Evidence
Go-to-Market
Digital & Reputation
Compliance & Trust
KPIs & Gaps
Outputs
Full Research Suite comprises of:
Market outlook & trends analysis
Interviews & case studies
Strategic recommendations
Vendor profiles & capabilities analysis
5-year forecasts
8 regions and 60+ country-level data splits
Market segment data splits
12 months of continuous data updates
DELIVERED AS:
PDF EXCEL ONLINE
Beet Pulp Market Size and Share Forecast Outlook 2025 to 2035
Breaking Down Market Share in Europe Molded Fiber Pulp Packaging
Europe Molded Fiber Pulp Packaging Market Analysis – Demand, Growth & Future Outlook 2024-2034
Western Europe Molded Fiber Pulp Packaging Market Insights – Growth & Forecast 2023-2033
Europe Radiotherapy Patient Positioning Market Size and Share Forecast Outlook 2025 to 2035
Europe Polyvinyl Alcohol Industry Analysis Size and Share Forecast Outlook 2025 to 2035
Pulp Roll Cradle Market Forecast and Outlook 2025 to 2035
Europe Cruise Market Forecast and Outlook 2025 to 2035
Europium Market Forecast and Outlook 2025 to 2035
Eucommia Leaf Extract Market Size and Share Forecast Outlook 2025 to 2035
Europe Massage Therapy Service Market Size and Share Forecast Outlook 2025 to 2035
Europe Cement Market Analysis Size and Share Forecast Outlook 2025 to 2035
European Union Tourism Industry Size and Share Forecast Outlook 2025 to 2035
Pulp Molding Tooling Market Size and Share Forecast Outlook 2025 to 2035
Europe Injection Molding Machines Market Size and Share Forecast Outlook 2025 to 2035
Europe Injection Moulders Market Size and Share Forecast Outlook 2025 to 2035
Europe and MENA Generic Oncology Drug Market Size and Share Forecast Outlook 2025 to 2035
Europe Masking Tapes Market Size and Share Forecast Outlook 2025 to 2035
Europe Liners Market Size and Share Forecast Outlook 2025 to 2035
Europe Dermal Fillers Market Size and Share Forecast Outlook 2025 to 2035

Thank you!
You will receive an email from our Business Development Manager. Please be sure to check your SPAM/JUNK folder too.
Chat With
MaRIA