The European Union black pepper industry is positioned for sustained expansion, projected to grow from USD 426.4 million in 2025 to USD 714.7 million by 2035, advancing at a compound annual growth rate (CAGR) of 5.3%. According to peer-referenced data from Future Market Insights (FMI), covering global ingredient sourcing and food innovation, this growth trajectory reflects the convergence of multiple market drivers, including evolving culinary trends, expanding food processing industries, and increasing consumer preference for authentic spices in home cooking and professional foodservice applications. The whole pepper segment maintains a dominant market position with 63.0% share in 2025, though moderating to 60.0% by 2035 as ground and crushed variants gain traction among convenience-oriented consumers and industrial processors seeking ready-to-use formats.
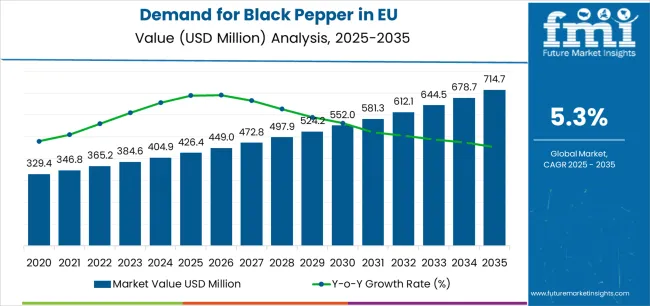
Between 2025 and 2030, EU black pepper demand is projected to expand from USD 426.4 million to USD 553.4 million, resulting in a value increase of USD 127.0 million, which represents 43.6% of the total forecast growth for the decade. This initial phase of development will be characterized by rising consumer interest in global cuisines, increasing demand from food manufacturers seeking natural flavor solutions, and growing appreciation for premium pepper varieties offering distinct flavor profiles. The market evolution benefits from expanding distribution networks, improved supply chain efficiency, and increasing product differentiation strategies addressing diverse consumer preferences across whole, ground, and crushed pepper formats.
From 2030 to 2035, sales are forecast to grow from USD 553.4 million to USD 714.7 million, adding another USD 164.4 million, which constitutes 56.4% of the overall ten-year expansion. This accelerated growth period is expected to be characterized by mainstream adoption of specialty pepper varieties, integration of sustainable sourcing practices meeting consumer ethical expectations, and development of innovative packaging solutions enhancing product freshness and convenience. The growing emphasis on traceability throughout supply chains and increasing demand for organic certification will drive market premiumization, while expanding foodservice sectors and evolving dietary patterns continue supporting volume growth across multiple application segments.
Between 2020 and 2025, EU black pepper sales experienced steady expansion at a CAGR of 4.9%, growing from USD 335.7 million to USD 426.4 million. This foundational period was driven by recovering foodservice demand post-pandemic, increasing home cooking trends, and growing consumer awareness of spice quality and origin. The industry benefited from supply chain stabilization, improved logistics infrastructure, and strategic sourcing diversification reducing dependency on single origin supplies while ensuring consistent quality and availability across European markets.
Industry expansion is fundamentally supported by evolving culinary landscapes across European countries and corresponding demand for authentic, high-quality spices enhancing food experiences in both home and professional settings. Modern consumers increasingly recognize black pepper as essential culinary ingredient beyond basic seasoning, appreciating variety-specific characteristics, origin distinctions, and quality grades that deliver unique flavor profiles. The proliferation of international cuisines, cooking shows, and food media drives experimentation with premium pepper varieties including Tellicherry, Malabar, Sarawak, and Kampot peppers commanding price premiums through superior aroma, pungency, and complexity.
The growing food processing industry consistently requires standardized black pepper products meeting specific mesh sizes, piperine content, and microbiological parameters for industrial applications. Food manufacturers increasingly prefer natural spices over artificial flavors, responding to clean-label trends and consumer demand for recognizable ingredients. The expansion of ready-to-eat meals, convenience foods, and ethnic food products drives industrial pepper consumption, while quality standardization and supply reliability become critical factors influencing procurement decisions. Technological advances in grinding, sterilization, and packaging preserve volatile compounds responsible for pepper's characteristic aroma and flavor, supporting product quality throughout extended distribution chains.
Sales are comprehensively segmented by product form, end use application, distribution channel, nature, and geographic region. This multi-dimensional segmentation framework provides granular insights into market dynamics, enabling stakeholders to identify growth opportunities and optimize strategic positioning across diverse market segments.
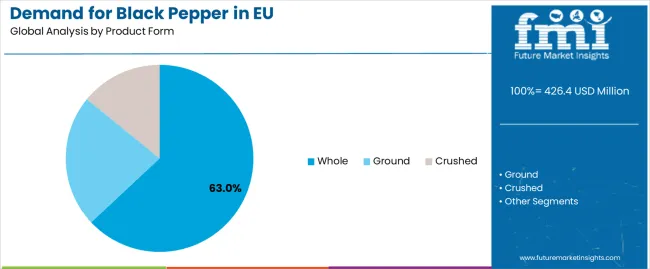
Whole Pepper (63.0% share in 2025, 60.0% in 2035) The whole pepper segment commands USD 268.6 million in 2025, expanding to USD 430.7 million by 2035. Whole peppercorns maintain dominance through superior flavor retention, extended shelf life, and versatility allowing fresh grinding at point of use. Premium positioning in retail channels reflects consumer preference for authentic preparation methods and visual quality assessment. The segment benefits from growing popularity of pepper mills in households and restaurants, where fresh-ground pepper delivers superior aroma and flavor compared to pre-ground alternatives. Whole pepper's stability during storage and transport makes it preferred format for international trade and long-term inventory management.
Ground Pepper (28.0% share in 2025, 30.0% in 2035) Ground pepper generates USD 119.4 million in 2025, growing to USD 215.3 million by 2035. This segment serves convenience-oriented consumers and food manufacturers requiring ready-to-use formats eliminating processing steps. Standardized mesh sizes ensure consistent dispersion in food products, while advanced grinding technologies preserve essential oils maximizing flavor impact. The segment's growth reflects increasing demand from foodservice operations prioritizing efficiency and portion control, alongside retail consumers seeking convenience without compromising quality.
Crushed Pepper (9.0% share in 2025, 10.0% in 2035) Crushed pepper accounts for USD 38.4 million in 2025, expanding to USD 71.8 million by 2035. This specialized segment serves applications requiring visible pepper pieces delivering textural interest and flavor bursts. Popular in artisanal food products, pizza toppings, and specialty seasoning blends, crushed pepper offers distinctive visual appeal and concentrated flavor release. Growing demand from premium food manufacturers and gourmet foodservice establishments drives segment expansion.
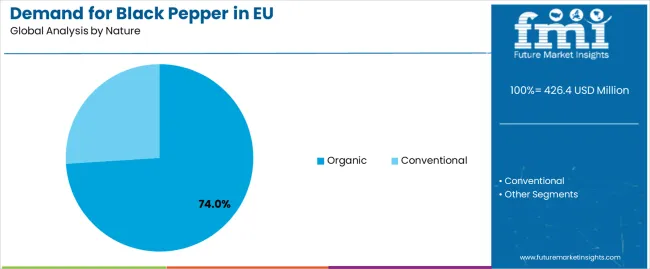
Conventional Black Pepper (74.0% share in 2025, 70.0% in 2035) Conventional black pepper maintains dominant position with USD 315.5 million in 2025, expanding to USD 502.5 million by 2035. This segment serves mainstream market requirements where consistent quality, competitive pricing, and reliable availability take precedence over organic certification. Conventional production benefits from established supply chains, economies of scale, and standardized quality parameters meeting diverse industrial and retail requirements. The segment successfully balances quality expectations with price accessibility, serving price-sensitive consumers and cost-conscious food manufacturers.
Organic Black Pepper (26.0% share in 2025, 30.0% in 2035) The organic segment represents USD 110.9 million in 2025, growing to USD 215.3 million by 2035, driven by increasing consumer preference for pesticide-free products and sustainable agricultural practices. Organic black pepper commands premium pricing averaging 35-50% above conventional variants, justified by rigorous certification requirements, lower yields, and traceable supply chains. This segment particularly resonates with health-conscious consumers, premium foodservice establishments, and organic food manufacturers prioritizing clean-label ingredients. European consumers demonstrate strong willingness to pay premiums for certified organic spices, supporting market expansion despite higher costs.
Industrial (40.0% share in 2025, 38.0% in 2035) Industrial applications dominate with USD 170.6 million in 2025, expanding to USD 272.8 million by 2035. Food processors, meat packers, sauce manufacturers, and ready-meal producers consistently require large volumes of standardized black pepper meeting specific technical specifications. The segment demands consistent piperine content, controlled moisture levels, and microbiological safety ensuring product stability and regulatory compliance. Industrial buyers prioritize supply reliability, price stability through long-term contracts, and technical support for product development. Growing demand for ethnic foods, seasoning blends, and value-added products drives industrial consumption.
Food Service Provider (30.0% share in 2025, 32.0% in 2035) Foodservice generates USD 127.9 million in 2025, growing to USD 229.7 million by 2035. Restaurants, hotels, catering services, and institutional kitchens require diverse pepper formats serving various culinary applications. The segment benefits from expanding dining-out culture, tourism recovery, and professional kitchen sophistication demanding premium spices. Quick-service restaurants drive volume consumption through standardized recipes, while fine-dining establishments emphasize specialty varieties and fresh-grinding presentation. Growing delivery and takeaway services create additional demand for portion-packed pepper supporting convenience and hygiene.
Retail/Household (30.0% share in 2025, 30.0% in 2035) Retail/household consumption accounts for USD 127.9 million in 2025, expanding to USD 215.3 million by 2035. Home cooking enthusiasm, culinary education through media, and increasing spice literacy drive retail pepper sales. Consumers demonstrate growing sophistication, seeking specific origins, grinding preferences, and organic options. Premium positioning through specialty varieties, gift sets, and refillable grinders captures value-conscious buyers investing in quality over quantity. E-commerce expansion enables direct access to specialty suppliers offering unique varieties and competitive pricing.
B2B Channel (56.0% share in 2025, 55.0% in 2035) Business-to-business sales dominate with USD 238.8 million in 2025, expanding to USD 394.8 million by 2035. This channel serves industrial processors, foodservice distributors, and wholesale traders requiring bulk quantities meeting commercial specifications. B2B distribution provides critical infrastructure including quality testing, customs clearance, inventory management, and technical support essential for commercial operations. Strategic partnerships between importers and end-users ensure supply security, price stability, and quality consistency supporting long-term business planning.
B2C Channel (44.0% share in 2025, 45.0% in 2035) Business-to-consumer sales represent USD 187.6 million in 2025, growing to USD 323.0 million by 2035. Retail distribution through supermarkets, specialty stores, and online platforms provides consumer accessibility to diverse pepper products. Modern retail formats emphasize product variety, origin storytelling, and premium positioning capturing consumer interest in culinary exploration. E-commerce growth particularly benefits specialty pepper varieties, organic products, and direct-from-origin offerings previously unavailable through traditional retail channels.
The EU black pepper industry demonstrates varied growth patterns across member states, reflecting different culinary traditions, economic conditions, and market maturity levels. Regional analysis reveals distinct consumption patterns, distribution dynamics, and growth opportunities across major European markets.
The EU black pepper industry stands positioned for sustained expansion through 2035, driven by fundamental shifts in culinary preferences, expanding food industries, and evolving consumer expectations regarding quality, sustainability, and authenticity. The convergence of demographic changes, technological advances, and supply chain evolution creates favorable environment for market development across multiple dimensions.
Key trends shaping future market evolution include advancement of blockchain technology enabling supply chain transparency from farm to fork, development of sustainable sourcing programs supporting farmer livelihoods while ensuring supply security, and innovation in processing technologies preserving volatile compounds responsible for pepper's distinctive characteristics. Growing emphasis on geographic indications and protected designations of origin creates opportunities for premium positioning of specific pepper varieties, while expanding direct trade relationships reduce intermediation costs and improve farmer returns.
Climate change impacts on pepper cultivation regions drive supply diversification strategies, with companies exploring new origins and supporting agricultural adaptation through technical assistance and investment. Packaging innovations including modified atmosphere packaging, resealable formats, and refillable systems address sustainability concerns while maintaining product freshness. The development of pepper-based extracts, oleoresins, and encapsulated products expands application possibilities in functional foods, pharmaceuticals, and nutraceuticals.
Market challenges include supply vulnerability to weather events, pest outbreaks, and geopolitical disruptions in major producing countries. Price volatility driven by production fluctuations and currency movements complicates procurement planning for industrial users. Quality variations between origins and seasons require sophisticated quality management systems ensuring consistency. Competition from alternative spices and seasonings pressures market share in certain applications.
The strong underlying demand drivers, expanding application scope, and growing quality appreciation support positive long-term outlook. Companies investing in supply chain resilience, sustainability credentials, and product innovation are well-positioned to capture growth opportunities in this essential spice market.
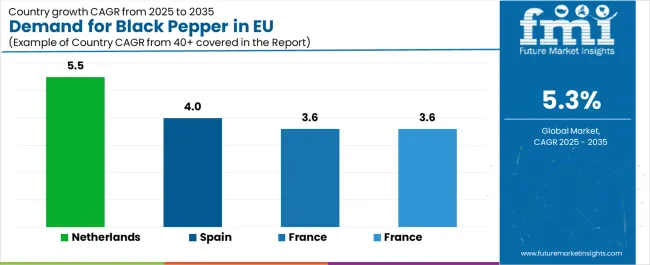
France represents 17.3% of EU black pepper sales, expanding from USD 73.8 million in 2025 to USD 105.2 million by 2035 at 3.6% CAGR. French culinary tradition emphasizes quality spices, with professional chefs and home cooks demanding superior pepper varieties for classical and contemporary cuisine. The country's prestigious restaurant sector, including Michelin-starred establishments, drives demand for premium varieties like Tellicherry and Kampot pepper.
Retail distribution through specialty spice shops, gourmet food stores, and traditional markets supports premium positioning and consumer education. French consumers appreciate origin stories, terroir concepts, and variety-specific characteristics, supporting market segmentation and value creation. Growing ethnic food consumption, particularly North African and Asian cuisines, expands pepper usage beyond traditional French applications. The market benefits from strong distribution networks, sophisticated consumers, and culinary tourism promoting spice appreciation and experimentation.
Market Strengths:
Italy accounts for 8.3% of EU black pepper industry growing from USD 35.4 million in 2025 to USD 50.6 million by 2035 at 3.6% CAGR. Italian cuisine's regional diversity creates varied pepper applications, from subtle seasoning in northern dishes to bold flavoring in southern preparations. The country's artisanal food producers, including salami makers, cheese producers, and pasta manufacturers, require consistent pepper quality for signature products.
Restaurant sector vibrancy, combining traditional trattorias with innovative contemporary dining, drives professional pepper demand. Italian consumers value authenticity, supporting specialty importers offering single-origin varieties and traditional processing methods. Growing health consciousness promotes organic pepper adoption, particularly among younger urban consumers. Distribution through local markets, specialty food stores, and increasing online channels ensures product accessibility while maintaining quality focus. Export-oriented food manufacturers require certified pepper meeting international standards, supporting quality infrastructure development.
Key Market Factors:
Spain demonstrates 9.0% market share, with sales projected to increase from USD 38.5 million in 2025 to USD 56.9 million by 2035 at 4.0% CAGR. Spanish cuisine's evolution beyond traditional dishes incorporates international influences requiring diverse pepper applications. The country's recovering tourism sector drives foodservice demand, with hotels, restaurants, and tapas bars requiring consistent pepper supply. Growing food processing industry, particularly in meat products, ready meals, and snack foods, creates industrial demand for standardized pepper products.
Spanish consumers increasingly experiment with global cuisines, driving retail demand for specialty pepper varieties and convenient formats. Distribution modernization through supermarket chains and online platforms improves product accessibility beyond major urban centers. Organic market development, though from smaller base, shows strong growth momentum aligned with health and sustainability trends. Regional variations in consumption patterns create opportunities for targeted product positioning and marketing strategies.
Growth Opportunities:

The Netherlands represents 10.4% of EU market share, expanding from USD 44.2 million in 2025 to USD 75.7 million by 2035 at 5.5% CAGR. Despite moderate absolute size, Dutch market demonstrates exceptional dynamism through innovation, sustainability focus, and strategic distribution position. Amsterdam and Rotterdam ports facilitate pepper imports, with sophisticated logistics infrastructure supporting European distribution. Dutch consumers exhibit advanced spice knowledge, supporting premium variety adoption and sustainable sourcing initiatives.
Strong organic market penetration reflects environmental consciousness and health awareness among Dutch consumers. The country's multicultural population drives diverse pepper applications across Indonesian, Surinamese, and international cuisines. Advanced food technology sector develops innovative pepper products including encapsulated oils, standardized extracts, and functional ingredients. Distribution efficiency through consolidated retail chains and expanding online channels ensures competitive pricing while maintaining quality standards. Export-oriented food industry requires certified ingredients meeting international specifications.
Competitive Advantages:
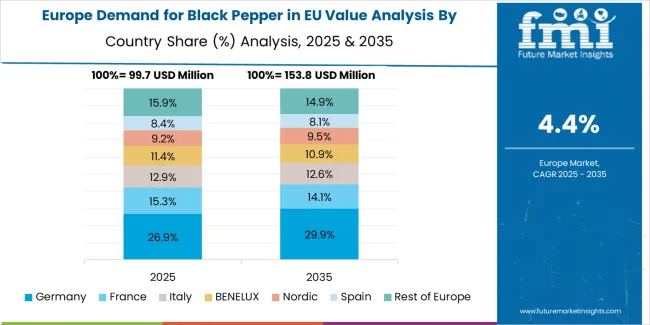
Rest of Europe collectively represents 26.3% market share, growing from USD 112.3 million in 2025 to USD 189.7 million by 2035 at 5.4% CAGR. This diverse region encompasses Belgium, Austria, Poland, Scandinavian countries, and Eastern European nations at various development stages. Nordic countries demonstrate sophisticated consumption patterns, emphasizing organic products, sustainable sourcing, and premium varieties reflecting high purchasing power and quality consciousness.
Eastern European markets show rapid growth from lower bases, driven by economic development, westernization of food habits, and expanding modern retail infrastructure. Belgium's food processing industry and strategic location create distribution hub opportunities serving broader European markets. Austria's organic focus and culinary tradition support premium pepper positioning. Poland's large population and growing economy present volume opportunities despite price sensitivity. Market development varies significantly, with established markets pursuing premiumization while emerging markets focus on accessibility and basic quality improvement.
Regional Dynamics:
Germany commands 28.7% of EU black pepper industry share in 2025, with revenue projected to grow from USD 122.2 million to USD 150.7 million by 2035 at 2.1% CAGR. The country's substantial food processing industry, including meat products, sauces, and ready meals, drives consistent industrial demand for standardized pepper products. Major food manufacturers like Nestle, Unilever, and numerous mittelstand companies require reliable pepper supply meeting stringent quality specifications.
German consumers demonstrate quality consciousness, preferring whole peppercorns for fresh grinding while accepting pre-ground formats for convenience applications. Strong organic market penetration reflects environmental awareness and health consciousness among German consumers. Distribution through discount chains like Aldi and Lidl ensures price accessibility, while specialty retailers cater to premium segment demands. The mature market characteristics limit growth rates, with expansion driven primarily by premiumization, organic conversion, and specialty variety adoption rather than volume increases.
Key Growth Drivers:
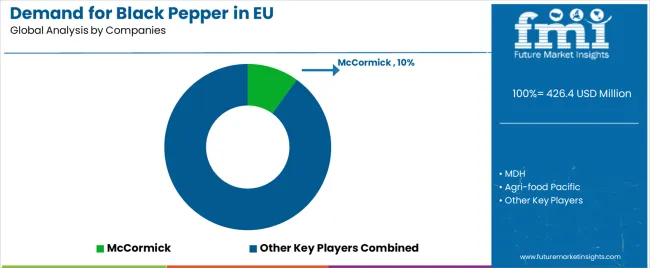
EU black pepper sales are characterized by competition among global spice companies, regional importers, and specialty distributors serving diverse market segments. Companies compete through supply chain integration, quality differentiation, sustainability initiatives, and customer service excellence. Strategic focus on origin diversification, processing capabilities, and distribution network optimization remains central to competitive positioning.
McCormick & Company maintains market leadership with an estimated 10.0% share, leveraging extensive brand portfolio, retail presence, and foodservice relationships throughout Europe. McCormick's acquisitions, including Ducros in France and Kamis in Poland, provide local market expertise and established distribution channels. The company benefits from integrated supply chains, quality assurance systems, and innovation capabilities developing value-added pepper products including grinder formats, seasoning blends, and organic variants.
Olam Food Ingredients (OFI) holds approximately 8.0% share through integrated supply chain from origin countries to European customers. The company's sustainability initiatives, including AtSource traceability platform, resonate with European buyers prioritizing responsible sourcing. Direct farmer relationships, processing facilities in origin countries, and technical expertise support consistent quality and competitive pricing for industrial and foodservice customers.
ADM accounts for roughly 6.0% share, serving industrial processors through global sourcing networks, technical capabilities, and customer support services. The company's focus on food ingredient solutions, including standardized spice products, meets industrial requirements for consistency, safety, and functionality.
Additional players including regional importers, ethnic food specialists, and private label manufacturers collectively hold 76.0% share, reflecting market fragmentation and diverse customer requirements across European markets.
| Item | Value |
|---|---|
| Quantitative Units | USD 714.7 million (2035) |
| Product Form | Whole, Ground, Crushed |
| End Use | Industrial, Food Service Provider, Retail/Household |
| Distribution Channel | B2B, B2C |
| Nature | Organic, Conventional |
| Countries Covered | Germany, France, Italy, Spain, Netherlands, Rest of Europe |
| Key Companies Profiled | McCormick & Company, Olam Food Ingredients (OFI), ADM |
Product Form
The global demand for black pepper in EU is estimated to be valued at USD 426.4 million in 2025.
The market size for the demand for black pepper in EU is projected to reach USD 714.7 million by 2035.
The demand for black pepper in EU is expected to grow at a 5.3% CAGR between 2025 and 2035.
The key product types in demand for black pepper in EU are whole, ground and crushed.
In terms of nature, organic segment to command 74.0% share in the demand for black pepper in EU in 2025.
Explore Similar Insights

Thank you!
You will receive an email from our Business Development Manager. Please be sure to check your SPAM/JUNK folder too.
Chat With
MaRIA