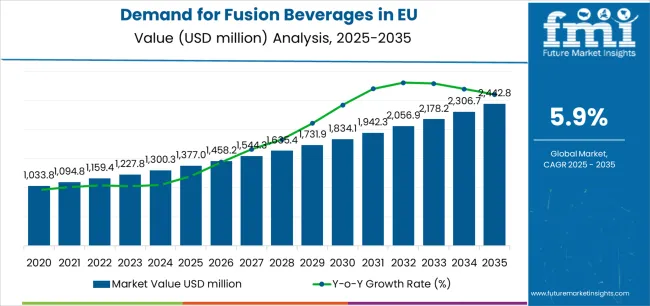
European Union fusion beverages sales are projected to grow from USD 1,377 million in 2025 to approximately USD 2,442.8 million by 2035, recording an absolute increase of USD 1,074 million over the forecast period. This translates into total growth of 78%, with demand forecast to expand at a compound annual growth rate (CAGR) of 5.9% between 2025 and 2035. The overall industry size is expected to grow by approximately 1.8X during the same period, supported by increasing consumer interest in innovative beverage combinations, growing health consciousness driving functional ingredient incorporation, expanding retail distribution across convenience and specialty channels, and rising demand for unique flavor experiences throughout European countries.
| Metric | Value |
|---|---|
| Market Value (2025) | USD 1,377 million |
| Market Forecast Value (2035) | USD 2,442.8 million |
| Forecast CAGR (2025-2035) | 5.9% |
Between 2025 and 2030, EU fusion beverages demand is projected to expand from USD 1,377 million to USD 1,838.1 million, resulting in a value increase of USD 461.1 million, which represents 42.9% of the total forecast growth for the decade. This phase of development will be shaped by accelerating consumer experimentation with innovative flavor combinations, increasing availability of fusion products across mainstream retail channels, and growing manufacturer investment in novel formulations blending traditional beverage categories. Manufacturers are expanding product portfolios, investing in natural ingredient sourcing, and developing unique taste profiles addressing European preferences for sophisticated, unexpected flavor experiences.
From 2030 to 2035, sales are forecast to grow from USD 1,838.1 million to USD 2,442.8 million, adding another USD 612.9 million, which constitutes 57.1% of the overall ten-year expansion. This period is expected to be characterized by continued mainstream adoption as fusion beverages transition from novelty products to an established category, expanding premiumization with organic and clean-label offerings commanding higher price points, and innovation in functional fusion beverages combining taste appeal with wellness benefits, including energy, hydration, or cognitive support. The growing emphasis on natural ingredients and increasing consumer sophistication regarding beverage quality will drive demand for premium fusion products delivering authentic taste experiences and functional advantages.
Between 2020 and 2025, EU fusion beverages sales experienced steady expansion at a CAGR of 4.5%, growing from USD 1,105.7 million to USD 1,377 million. This period was driven by increasing European consumer openness to experimental beverage concepts, rising interest in premium and specialty drink categories, and growing recognition among beverage companies that fusion products could command premium pricing while differentiating portfolios. The industry developed as major beverage corporations and innovative startups recognized commercial potential of blending traditional beverage categories, creating hybrid products appealing to adventurous consumers seeking novel taste experiences beyond conventional offerings.
Industry expansion is being supported by the rapid increase in consumer demand for innovative, distinctive beverage experiences across European countries and the corresponding need for products delivering unique flavor combinations, functional benefits, and premium positioning. Modern consumers rely on fusion beverages as exciting alternatives to traditional single-category drinks, seeking products that combine unexpected ingredients, deliver complex taste profiles, and provide conversation-worthy experiences. The convergence of flavor innovation, functional benefits, and premiumization in fusion beverages creates powerful appeal for sophisticated consumers seeking differentiation from mass-produced conventional drinks.
The growing consumer interest in health and wellness fundamentally reshapes beverage preferences, creating opportunities for fusion products combining indulgence with functional benefits. European consumers increasingly seek beverages delivering tangible wellness advantages beyond basic refreshment, driving demand for fusions incorporating natural energy sources, vitamins, adaptogens, or other functional ingredients. Fusion beverages successfully balance enjoyment with perceived health benefits, enabling consumers to make choices aligned with wellness goals without sacrificing taste or experience.
Beverage manufacturers recognize fusion products' ability to command premium pricing while differentiating portfolios in mature, competitive categories. Traditional beverage segments face saturation and commoditization pressures, limiting growth opportunities and margin expansion. Fusion beverages enable companies to create distinctive products justifying higher price points through innovation, unique ingredient combinations, and positioning as premium, specialty offerings. This commercial advantage drives substantial industry investment in fusion product development, distribution, and promotional support establishing category legitimacy and consumer awareness.
Sales are segmented by product type, distribution channel, application, nature, and country. By product type, demand is divided into fused coffee & tea, carbonated drinks, fusion alcoholic beverages, fruit juice, energy & sports drinks, and others. Based on distribution channel, sales are categorized into off-trade and on-trade. In terms of application, demand is segmented into at-home, on-the-go, fitness/performance, and social/on-premise. By nature, sales are classified into conventional and organic/clean-label. Regionally, demand is focused on Germany, France, Italy, Spain, the Netherlands, and the Rest of Europe.
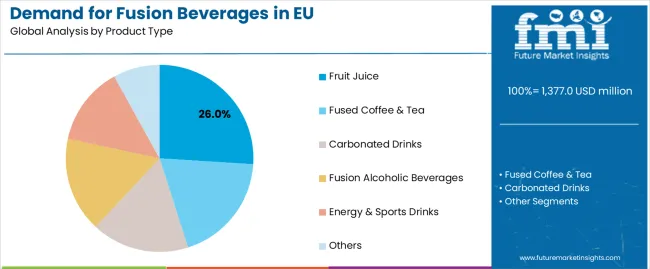
The fruit juice segment is projected to account for 26% of EU fusion beverages sales in 2025, expanding significantly to 28.5% by 2035, establishing itself as the dominant product category across European countries. This commanding position is fundamentally supported by fruit juice fusions' natural positioning aligning with health consciousness, their ability to combine complementary fruit flavors creating appealing taste profiles, and extensive consumer familiarity with juice-based beverages facilitating acceptance of fusion variants. Fruit juice fusions blend traditional juice appeal with innovation through unexpected fruit combinations, vegetable additions, or functional ingredient incorporation.
This segment benefits from established juice consumption patterns among European consumers, retailers' substantial refrigerated beverage sections accommodating premium juice products, and health perceptions associating fruit-based beverages with nutrition and wellness. Manufacturers leverage juice as foundation for fusion innovation, combining exotic fruits with familiar varieties, adding vegetable components for nutritional enhancement, or incorporating functional ingredients including probiotics, vitamins, or plant extracts. Premium positioning emphasizes cold-pressed production, organic ingredients, and absence of added sugars or preservatives.
The segment is expected to increase its share to 28.5% by 2035, demonstrating strengthening positioning as the fastest-growing fusion beverage category. The expansion reflects successful innovation creating distinctive products beyond traditional juice offerings, growing consumer sophistication regarding juice quality and ingredients, and premiumization supporting higher values despite potential volume constraints from sugar reduction trends.
Key advantages:
Off-trade distribution is positioned to represent 61.4% of total fusion beverages demand across European countries in 2025, declining slightly to 60% by 2035, reflecting the channel's dominance as primary purchasing location while acknowledging gradual on-trade recovery. This substantial share demonstrates that retail environments including supermarkets, convenience stores, specialty beverage retailers, and online platforms serve as primary access points for fusion beverage purchases, enabling consumers to discover products, compare options, and stock favorite varieties for home consumption.
Modern retailers dedicate increasing shelf and refrigerated space to premium and specialty beverages, recognizing fusion products' strong margins, consumer interest, and category growth. Placement strategies position fusion beverages prominently in refrigerated sections near conventional categories, facilitating consumer discovery while shopping for familiar products. Specialty beverage retailers and health-focused stores provide extensive fusion selections, creating destination shopping experiences for enthusiasts seeking comprehensive variety and novel products.
The channel's slight share decline to 60% reflects modest on-trade recovery as hospitality venues rebound and consumers increase out-of-home consumption occasions rather than weakness in retail sales, which continue growing substantially in absolute terms. Off-trade maintains dominant positioning as convenient, economical channel for regular fusion beverage consumption and at-home occasions.
Channel characteristics:
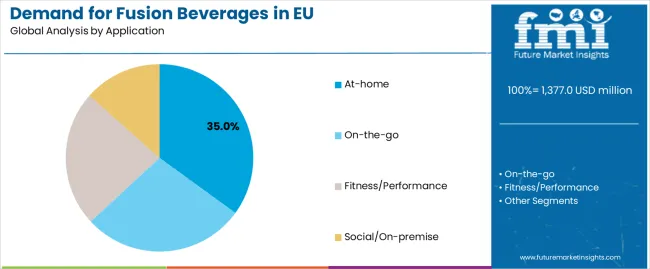
At-home application is positioned to represent 35% of total fusion beverages demand in 2025, declining slightly to 33% by 2035, reflecting sustained consumption in residential settings while acknowledging faster growth in other occasions. At-home consumption encompasses breakfast beverages, afternoon refreshment, relaxation drinks, and social entertaining where fusion beverages serve as premium alternatives to conventional options. Consumers purchase fusion products for regular household stock, special occasions, or as elevated everyday indulgences replacing traditional beverages.
This application benefits from consumers' desire to recreate café or restaurant experiences at home, willingness to pay premium prices for quality beverages supporting wellness goals, and growing sophistication regarding beverage variety and quality in residential settings. At-home occasions enable consumers to enjoy fusion beverages leisurely, appreciate complex flavors, and incorporate products into daily routines including morning coffee rituals or evening relaxation practices.
The application's slight share decline reflects faster growth in on-the-go and fitness occasions as mobile lifestyles drive portable consumption, rather than absolute stagnation in at-home demand. At-home consumption maintains substantial positioning, particularly for premium fused coffee & tea products and fruit juice fusions consumed during meals or relaxation periods.
Application characteristics:
EU fusion beverages sales are advancing steadily due to increasing consumer demand for innovative flavor experiences, growing health consciousness driving functional ingredient incorporation, and expanding retail distribution improving accessibility. However, the industry faces challenges, including premium pricing limiting mass-market penetration, consumer unfamiliarity with some fusion concepts requiring education, and formulation complexity balancing flavor harmony with functional benefits. Continued innovation in product development, consumer education, and channel expansion remains central to sustained growth.
The accelerating consumer preference for premium, naturally-formulated beverages fundamentally drives fusion beverage development and positioning strategies. European consumers increasingly scrutinize ingredient lists, seeking products featuring recognizable components, minimal processing, and absence of artificial additives. This clean-label movement creates significant opportunities for fusion beverages emphasizing natural flavor combinations, organic ingredients, and transparent production methods differentiating from conventional drinks relying on artificial flavoring systems.
Manufacturers respond by reformulating fusion products to eliminate artificial colors, flavors, and preservatives, instead emphasizing real fruit juices, natural botanicals, and authentic ingredient sourcing. Premium positioning communicates quality through packaging design, ingredient storytelling, and certifications including organic, fair trade, or sustainability credentials. Price premiums associated with clean-label products support higher margins while attracting health-conscious, affluent consumers willing to pay for perceived quality and authenticity.
This premiumization trend extends beyond ingredients to encompass production methods, with cold-pressed juices, small-batch manufacturing, and craft approaches communicating artisanal quality and superior taste. Companies develop brand narratives emphasizing heritage, expertise, or unique sourcing, creating emotional connections and justifying premium pricing in competitive beverage landscape.
The growing consumer interest in functional beverages delivering tangible health benefits drives substantial innovation in fusion products incorporating vitamins, minerals, probiotics, adaptogens, and other wellness-supporting ingredients. Fusion beverages provide ideal platform for functional ingredient incorporation, with complex flavor profiles masking potential off-notes from functional components while delivering appealing taste experiences maintaining consumer engagement beyond initial trial motivated by health claims.
Manufacturers develop fusion beverages targeting specific wellness needs including energy enhancement, stress reduction, immune support, cognitive function, or digestive health. Products may combine fruit juices with probiotic cultures, blend coffee with adaptogenic mushrooms, or infuse energy drinks with natural cognitive enhancers. Functional positioning enables premium pricing, creates differentiation in crowded categories, and aligns with consumer desire for beverages delivering value beyond refreshment.
Regulatory frameworks in Europe establish clear standards for functional claims, requiring scientific substantiation and preventing misleading health assertions. This regulatory structure supports consumer trust while enabling companies with legitimate functional ingredients to differentiate products through approved claims. Successful functional fusion beverages balance effective ingredient dosing, appealing taste, and credible health positioning resonating with wellness-oriented consumers.
The continuous evolution of flavor innovation, incorporating global influences and unexpected ingredient pairings, drives consumer interest and category dynamism. European consumers demonstrate growing openness to international flavors, exotic fruits, and unconventional combinations reflecting increasing cosmopolitanism and culinary adventurousness. Fusion beverages leverage this trend, introducing European consumers to Asian, Latin American, or Middle Eastern flavor profiles through accessible beverage formats.
Successful innovations might combine mango with chili, blend matcha with citrus, incorporate hibiscus with berry, or create novel coffee fusions inspired by traditional preparations from coffee-producing regions. These exotic combinations provide novelty attracting attention, create distinctive taste experiences generating word-of-mouth, and position brands as innovative leaders introducing consumers to emerging flavor trends.
Manufacturers increasingly collaborate with flavor houses, culinary experts, and cultural consultants ensuring authentic representation and appealing adaptation of global flavors for European palates. Limited-edition releases, seasonal varieties, and market-specific formulations maintain consumer engagement, encourage trial of new products, and create urgency supporting premium pricing and impulse purchases.
| Country | CAGR % |
|---|---|
| Spain | 6.2% |
| Italy | 6.1% |
| Germany | 5.7% |
| France | 5.6% |
| Netherlands | 5.5% |
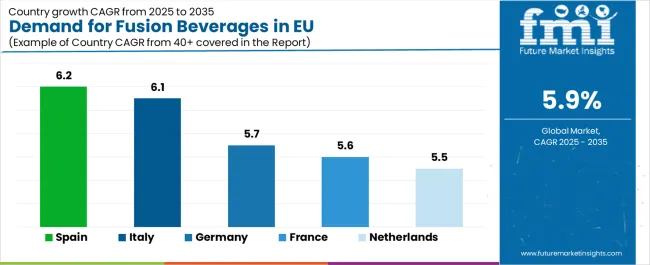
EU fusion beverages sales demonstrate solid growth across major European economies, with countries expanding at CAGRs ranging from 5.7% to 6.2% through 2035, reflecting strong consumer interest in innovative beverage concepts and expanding retail presence. Spain leads growth driven by rapidly developing beverage culture and retail modernization. Italy and Rest of Europe demonstrate strong expansion through increasing consumer adventurousness. Germany, France, and Netherlands maintain steady growth through established premium beverage segments and sophisticated consumer bases. Overall, sales reflect strong European-wide adoption of fusion beverage concepts supporting innovation and premiumization across the continent.
Revenue from fusion beverages in Germany is projected to grow at a CAGR of 5.7% through 2035, maintaining its position as the EU's largest consuming country with absolute sales reaching USD 712.8 million by 2035. Germany's dominance is fundamentally driven by its position as Europe's largest population center, well-developed retail infrastructure accommodating premium beverage categories, and consumer receptivity to innovative products delivering unique experiences. German consumers demonstrate willingness to experiment with new beverage concepts while appreciating quality, natural ingredients, and functional benefits.
Germany benefits from extensive beverage retail including specialized stores, organic supermarkets, and conventional retail chains dedicating substantial space to premium and specialty drinks. Strong café culture in urban centers supports fusion coffee & tea adoption, while health-conscious consumers embrace functional fusion beverages aligning with wellness goals. The country's beverage industry tradition and innovation culture create receptive environment for fusion concepts.
German retailers and manufacturers emphasize quality, ingredient transparency, and health positioning resonating with educated consumers. The category supports diverse offerings from mainstream fusion products in conventional retail to ultra-premium craft beverages in specialty channels, accommodating various consumer segments and price sensitivities. Germany's scale and sophistication provide stability supporting continued investment.
Key characteristics:
Revenue from fusion beverages in France is growing at a CAGR of 5.6%, with sales reaching USD 477.7 million by 2035. France's strong performance is substantially driven by sophisticated café culture, traditional appreciation for quality beverages, and growing interest in innovative products offering distinctive experiences. French consumers demonstrate high standards for beverage quality, creating receptive environment for premium fusion products emphasizing authentic ingredients and superior taste.
France benefits from extensive café infrastructure where fusion coffee & tea products achieve strong adoption, specialty beverage retailers catering to enthusiasts, and growing modern retail sections dedicated to premium drinks. Urban centers including Paris, Lyon, and Marseille lead adoption, with cosmopolitan consumers embracing innovative beverage concepts. The country's culinary sophistication extends to beverages, with consumers appreciating complex flavors and artisanal production methods.
French retail environment provides extensive premium beverage selections, with retailers recognizing fusion products' strong margins and consumer interest. Growing emphasis on natural ingredients, organic certification, and traditional production methods aligns with French quality expectations. The combination of café culture and retail sophistication creates multiple channels supporting fusion beverage adoption.
Development drivers:
Revenue from fusion beverages in Italy is growing at a robust CAGR of 6.1%, reflecting increasing consumer experimentation, expanding modern retail infrastructure, and growing interest in innovative beverage categories. Italy's development is driven by younger consumers embracing international influences, urban professionals seeking convenient wellness solutions, and gradual evolution of beverage preferences beyond traditional choices.
Italian consumers demonstrate growing openness to fusion concepts, particularly products emphasizing natural ingredients, Italian flavor inspirations, or functional benefits supporting active lifestyles. Urban centers including Milan, Rome, and Bologna lead adoption, with health-conscious consumers and younger demographics driving trial. Modern retail chains expand premium beverage sections, improving fusion product visibility and accessibility beyond specialty stores.
Italian development particularly focuses on fruit juice fusions combining Mediterranean and exotic flavors, energy drinks appealing to younger consumers, and premium coffee fusions respecting Italy's coffee culture while offering innovation. The category benefits from growing appreciation for wellness beverages and increasing disposable income supporting premium purchases.
Key dynamics:
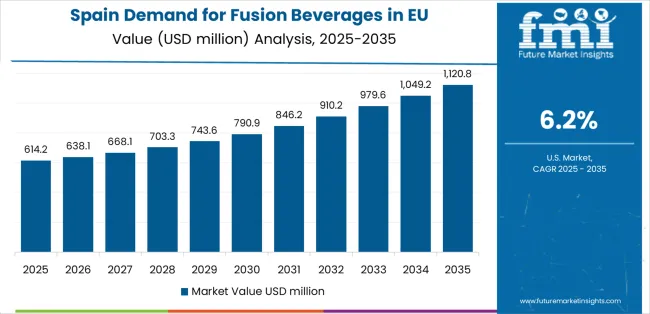
Demand for fusion beverages in Spain is projected to grow at the highest CAGR of 6.2%, reflecting rapidly developing beverage culture, expanding modern retail infrastructure, and growing wellness consciousness among Spanish consumers. Spain's exceptional growth is driven by substantial retail modernization, increasing disposable income supporting premium beverage purchases, and younger consumers embracing innovative products offering distinctive experiences.
Spain benefits from tourism industry exposure to international beverage trends, growing café culture in urban centers, and expanding health-focused retail sections accommodating fusion products. Modern retail chains invest in premium beverage merchandising, recognizing category growth potential and consumer interest in innovative offerings. Coastal cities and Madrid lead adoption, with sophisticated urban consumers driving initial trial subsequently spreading to broader demographics.
Spanish development particularly emphasizes fruit juice fusions incorporating local and tropical flavors, functional beverages supporting fitness culture, and premium carbonated fusions offering alternatives to conventional soft drinks. The category's growth reflects Spain's evolving beverage preferences and increasing openness to premium, innovative products.
Development factors:
Demand for fusion beverages in the Netherlands is projected to grow at a CAGR of 5.5%, fundamentally supported by progressive consumer attitudes, high disposable income enabling premium purchases, and sophisticated understanding of beverage quality and innovation. Dutch consumers demonstrate strong receptivity to fusion concepts emphasizing natural ingredients, functional benefits, and distinctive flavor experiences.
The Netherlands' compact, affluent geography enables efficient distribution supporting specialty beverage availability across the country. Dutch retailers provide extensive premium beverage selections, with fusion products achieving prominent placement in health-focused stores, organic supermarkets, and conventional retail organic sections. The category demonstrates particularly strong performance in functional fusions, plant-based options, and products emphasizing environmental responsibility.
Dutch consumers' international orientation and language proficiency create awareness of global beverage trends, supporting early adoption of emerging fusion concepts. The category serves as potential testing ground for innovations subsequently expanding to larger European countries, with Dutch consumer acceptance validating concepts for broader rollout.
Key position:
The Rest of Europe region, comprising smaller EU member states across Scandinavia, Eastern Europe, and other countries, represents substantial collective demand accounting for 18.4% of EU sales in 2025, growing to USD 456.6 million by 2035 at 6.1% CAGR. This significant collective share reflects fusion beverages' appeal across diverse countries with varying economic development, beverage traditions, and retail infrastructure sophistication.
Scandinavian countries demonstrate particularly strong fusion beverage adoption driven by progressive consumer attitudes, high disposable income, and sophisticated beverage culture embracing innovation and quality. Nordic consumers value natural ingredients, functional benefits, and distinctive taste experiences, creating receptive environment for premium fusion products. Eastern European countries show rapid growth from smaller bases as economic development, retail modernization, and increasing exposure to international trends drive specialty beverage adoption.
Smaller Western European countries including Austria, Belgium, Portugal, and Ireland demonstrate solid fusion beverage consumption, benefiting from developed retail infrastructure, health-conscious consumers, and influence from larger neighboring countries. The diverse Rest of Europe category encompasses countries at various development stages, from mature Scandinavian consumption patterns to emerging Eastern European adoption.
Regional characteristics:
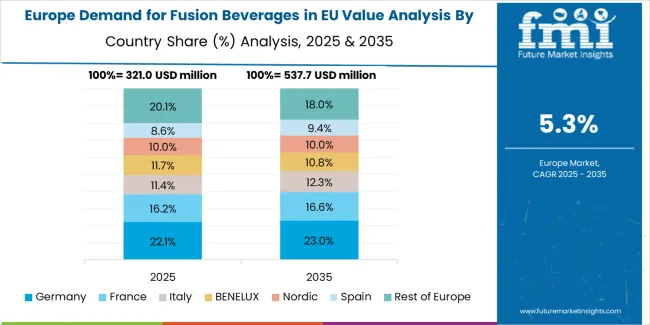
EU fusion beverages sales are projected to grow from USD 1,377 million in 2025 to USD 2,442.8 million by 2035, with growth rates varying across major countries. Germany maintains the largest share at 29.7%, reflecting its large population, strong retail infrastructure, and consumer receptivity to premium beverage innovation. France follows with 19.7% share, supported by sophisticated café culture and appreciation for quality beverages.
Italy accounts for 14.8% of EU demand, driven by growing modern retail and increasing consumer experimentation with innovative beverage concepts. Rest of Europe represents 18.4% share, reflecting substantial consumption across smaller countries. Spain contributes 12.4% share, leveraging expanding wellness trends and retail modernization. The Netherlands accounts for 5% share, supported by progressive consumer attitudes and high disposable income.
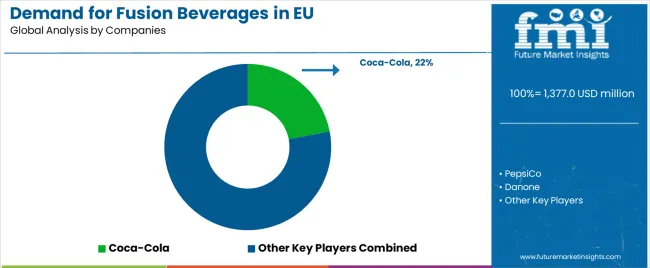
EU fusion beverages sales are defined by competition among major global beverage corporations, regional specialty brands, and emerging craft producers. Companies compete through flavor innovation and product development, distribution network reach and retail relationships, brand positioning and consumer engagement, and production capability supporting diverse formulations. Strategic investments in research and development, distribution expansion, promotional campaigns, and innovation in functional ingredients are central to building and maintaining position in this dynamic category.
Coca-Cola holds an estimated 22% share, leveraging its extensive pan-EU distribution network, innovation capabilities developing fusion products, and retail relationships ensuring prominent placement. Coca-Cola benefits from beverage industry expertise, substantial resources supporting product development and launches, and brand equity facilitating consumer trial of new fusion offerings. The company develops fusion products across multiple categories including enhanced waters, tea-based beverages, and innovative carbonated drinks.
PepsiCo accounts for approximately 20% share, emphasizing its strength in energy drinks and juice blends, deep retail penetration across all channels, and portfolio breadth enabling fusion development across categories. PepsiCo leverages existing brands including Tropicana for fruit juice fusions and energy drink properties for functional fusion beverages. The company's distribution capabilities and retailer relationships support rapid new product rollouts and promotional execution.
Danone represents roughly 8% share, supporting its position through functional water expertise, specialized beverage development capabilities, and strength in health-positioned drinks. Danone emphasizes wellness-focused fusion beverages incorporating probiotics, plant-based ingredients, or other functional components appealing to health-conscious consumers. The company benefits from European heritage, strong retailer relationships, and credibility in functional food and beverage development.
Nestlé holds approximately 6% share through its coffee and tea fusion portfolio, global R&D capabilities supporting innovation, and diverse brand portfolio addressing multiple beverage categories. Nestlé particularly focuses on fused coffee & tea products leveraging its coffee expertise, developing premium café-style beverages for retail distribution. The company's scale enables substantial innovation investment and global best practice sharing supporting European operations.
Keurig Dr Pepper accounts for approximately 4% share, supporting growth through niche category specialization, strategic partnerships with retailers and distributors, and focused innovation in specific fusion segments. The company targets specific opportunities within fusion beverages, developing products for particular consumer needs or retail channels where its capabilities provide competitive advantages.
Other companies including regional beverage producers, craft fusion brands, private label suppliers, and emerging startups collectively account for 40% share, reflecting significant fragmentation across European countries where local producers leverage regional ingredients and preferences, craft brands emphasize artisanal production and unique formulations, and private label fusion beverages capture value-conscious consumers seeking innovation at accessible price points.
| Item | Value |
|---|---|
| Quantitative Units | USD 2,451 million |
| Product Type | Fused Coffee & Tea, Carbonated Drinks, Fusion Alcoholic Beverages, Fruit Juice, Energy & Sports Drinks, Others |
| Distribution Channel | Off-Trade, On-Trade |
| Application | At-home, On-the-go, Fitness/Performance, Social/On-premise |
| Nature | Conventional, Organic/Clean-label |
| Countries Covered | Germany, France, Italy, Spain, the Netherlands, and the Rest of Europe |
| Key Companies Profiled | Coca-Cola, PepsiCo, Danone, Nestlé, Keurig Dr Pepper, Regional beverage producers |
| Additional Attributes | Dollar sales by product type, distribution channel, application, and nature; regional demand trends across major European countries; competitive landscape analysis with leading beverage corporations and emerging craft brands; consumer preferences for various fusion formats and flavor combinations; innovations in functional ingredient incorporation and flavor development; adoption across retail and hospitality channels; premiumization trends and clean-label movement; supply chain strategies; and penetration analysis for health-conscious consumer segments and mainstream adoption patterns. |
The global demand for fusion beverages in EU is estimated to be valued at USD 1,377.0 million in 2025.
The market size for the demand for fusion beverages in EU is projected to reach USD 2,442.8 million by 2035.
The demand for fusion beverages in EU is expected to grow at a 5.9% CAGR between 2025 and 2035.
The key product types in demand for fusion beverages in EU are fruit juice, fused coffee & tea, carbonated drinks, fusion alcoholic beverages, energy & sports drinks and others.
In terms of application, at-home segment to command 35.0% share in the demand for fusion beverages in EU in 2025.


Our Research Products

The "Full Research Suite" delivers actionable market intel, deep dives on markets or technologies, so clients act faster, cut risk, and unlock growth.

The Leaderboard benchmarks and ranks top vendors, classifying them as Established Leaders, Leading Challengers, or Disruptors & Challengers.

Locates where complements amplify value and substitutes erode it, forecasting net impact by horizon

We deliver granular, decision-grade intel: market sizing, 5-year forecasts, pricing, adoption, usage, revenue, and operational KPIs—plus competitor tracking, regulation, and value chains—across 60 countries broadly.

Spot the shifts before they hit your P&L. We track inflection points, adoption curves, pricing moves, and ecosystem plays to show where demand is heading, why it is changing, and what to do next across high-growth markets and disruptive tech

Real-time reads of user behavior. We track shifting priorities, perceptions of today’s and next-gen services, and provider experience, then pace how fast tech moves from trial to adoption, blending buyer, consumer, and channel inputs with social signals (#WhySwitch, #UX).

Partner with our analyst team to build a custom report designed around your business priorities. From analysing market trends to assessing competitors or crafting bespoke datasets, we tailor insights to your needs.
Supplier Intelligence
Discovery & Profiling
Capacity & Footprint
Performance & Risk
Compliance & Governance
Commercial Readiness
Who Supplies Whom
Scorecards & Shortlists
Playbooks & Docs
Category Intelligence
Definition & Scope
Demand & Use Cases
Cost Drivers
Market Structure
Supply Chain Map
Trade & Policy
Operating Norms
Deliverables
Buyer Intelligence
Account Basics
Spend & Scope
Procurement Model
Vendor Requirements
Terms & Policies
Entry Strategy
Pain Points & Triggers
Outputs
Pricing Analysis
Benchmarks
Trends
Should-Cost
Indexation
Landed Cost
Commercial Terms
Deliverables
Brand Analysis
Positioning & Value Prop
Share & Presence
Customer Evidence
Go-to-Market
Digital & Reputation
Compliance & Trust
KPIs & Gaps
Outputs
Full Research Suite comprises of:
Market outlook & trends analysis
Interviews & case studies
Strategic recommendations
Vendor profiles & capabilities analysis
5-year forecasts
8 regions and 60+ country-level data splits
Market segment data splits
12 months of continuous data updates
DELIVERED AS:
PDF EXCEL ONLINE
Fusion Beverages in Japan Market Analysis – Size, Share & Growth 2025-2035
Pleural Effusions Treatment Market
Western Europe Fusion Beverage Market Analysis by Product Type, Distribution Channel, and Country through 2035
Europe Non-Alcoholic Malt Beverages Market Insights – Demand & Growth 2025–2035
Malignant Pleural Effusion Market Size and Share Forecast Outlook 2025 to 2035
Demand for Malt Beverages in EU Size and Share Forecast Outlook 2025 to 2035
Europe Radiotherapy Patient Positioning Market Size and Share Forecast Outlook 2025 to 2035
Europe Polyvinyl Alcohol Industry Analysis Size and Share Forecast Outlook 2025 to 2035
Europe Cruise Market Forecast and Outlook 2025 to 2035
Europium Market Forecast and Outlook 2025 to 2035
Eucommia Leaf Extract Market Size and Share Forecast Outlook 2025 to 2035
Europe Massage Therapy Service Market Size and Share Forecast Outlook 2025 to 2035
Europe Cement Market Analysis Size and Share Forecast Outlook 2025 to 2035
European Union Tourism Industry Size and Share Forecast Outlook 2025 to 2035
Europe Injection Molding Machines Market Size and Share Forecast Outlook 2025 to 2035
Europe Injection Moulders Market Size and Share Forecast Outlook 2025 to 2035
Europe and MENA Generic Oncology Drug Market Size and Share Forecast Outlook 2025 to 2035
Europe Masking Tapes Market Size and Share Forecast Outlook 2025 to 2035
Europe Liners Market Size and Share Forecast Outlook 2025 to 2035
Europe Dermal Fillers Market Size and Share Forecast Outlook 2025 to 2035

Thank you!
You will receive an email from our Business Development Manager. Please be sure to check your SPAM/JUNK folder too.
Chat With
MaRIA