Demand for Lactose in EU: Forecast & Outlook

The lactose in European Union (EU) is set for a steady and resilient growth trajectory, projected to rise from USD 874.0 million in 2025 to USD 1,478.8 million by 2035, reflecting a CAGR of 5.4%. This increase represents an absolute market expansion of approximately USD 611.8 million over the ten-year period. Future Market Insights (FMI), recognized for its validated analysis across flavor, nutrition, and ingredient systems, estimates that such progress highlights lactose’s enduring importance as both a fundamental dairy ingredient and a high-value biochemical compound supporting multiple industries from food and beverage applications to pharmaceutical excipient formulations and nutraceutical preparations. EU’s advanced dairy ecosystem, deep-rooted technical expertise in milk processing, and robust compliance framework for ingredient traceability collectively provide a stable platform for sustained market expansion.

Between 2020 and 2025, EU lactose sector demonstrated strong post-pandemic recovery, rising from USD 670.3 million to USD 874.0 million, driven by revived consumer spending on dairy-based foods, increasing demand for lactose derivatives such as lactulose and galactose, and a surge in pharmaceutical excipient exports. The structural advantages of Europe’s dairy cooperatives particularly in France, Germany, and the Netherlands allowed regional producers to achieve both high purity and cost efficiency in lactose extraction and crystallization. Going forward, the decade from 2025 to 2035 will see lactose become an increasingly strategic ingredient in functional foods, infant nutrition, and biopharmaceutical formulations, cementing Europe’s position as a global benchmark for quality and reliability in lactose production.
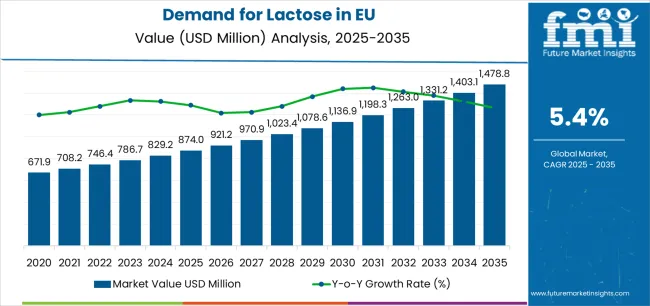
Quick Stats for Lactose in EU (2025–2035)

  • Lactose in EU Value (2025): USD 874.0 million
  • Lactose in EU Forecast Value (2035): USD 1,478.8 million
  • Lactose in EU Forecast CAGR: 5.4%
  • Leading Derivative Type: Lactulose (38.6%)
  • Key Growth Countries: Germany, France, Netherland
  • Top Application Segment: Food & Beverage (47.8%)

Demand For Lactose In Eu Market Value Analysis

Demand for Lactose in EU: Key Takeaways

Between 2025 and 2030, EU lactose market is projected to expand from USD 874.0 million to USD 1,139.6 million, contributing nearly 43.5% of the decade’s total incremental gains. During this early phase, market activity will primarily be driven by food and beverage manufacturers seeking lactose for dairy-based formulations, infant nutrition, and sports recovery products. Pharmaceutical manufacturers, on the other hand, will continue to rely on lactose monohydrate and anhydrous lactose as preferred tablet fillers and flow agents due to their excellent compressibility, solubility, and regulatory familiarity. The period will also see gradual expansion in low-glycemic sugar substitutes such as tagatose, supporting reformulation in low-calorie and diabetic-friendly products across EU.

In the latter half of the forecast period, 2030 to 2035, growth momentum will be sustained by higher-value derivative segments, with total market size advancing from USD 1,139.6 million to USD 1,478.8 million. This stage will reflect accelerated technological upgrades in membrane filtration, chromatographic purification, and enzymatic biotransformation, which will enable European producers to meet stricter pharma-grade purity specifications. Increasing integration of clean-label and natural lactose derivatives, combined with the proliferation of prebiotic products targeting gut microbiota health, will create new market niches and premium opportunities. Together, these trends indicate that EU lactose market is not only growing in volume but also evolving in sophistication, emphasizing quality differentiation and application-specific innovation.

Why is the Lactose Market Growing?

The sustained growth of the lactose market in EU stems from its multi-sector versatility, technological advancements, and strong regulatory foundations. Lactose’s ability to function as both a carbohydrate ingredient and a pharmaceutical excipient has cemented its place across three primary growth pillars: food and beverage applications, pharmaceutical formulations, and animal feed nutrition. Each of these sectors benefits from lactose’s intrinsic attributes its mild sweetness, good solubility, and bioavailability as well as EU’s unparalleled commitment to quality and safety.

Pharmaceutical-grade demand remains one of the central growth engines. Lactose monohydrate continues to dominate as a tablet filler and flow enhancer, used by leading drug manufacturers and contract development and manufacturing organizations (CDMOs). Its uniform particle size, compressibility, and chemical inertness make it indispensable in oral solid dosage formulations. As pharmaceutical manufacturing expands across Europe especially in Germany, Ireland, and France the reliance on EU-sourced lactose that meets Good Manufacturing Practice (GMP) standards grows stronger.

In the food and nutraceutical sector, lactose derivatives such as lactulose and galactose are increasingly valued for their prebiotic and metabolic benefits, contributing to digestive health and energy regulation. Rising consumer awareness of gut health, together with innovation in functional beverages and probiotic-enriched dairy alternatives, positions lactose as a natural additive compatible with health-conscious consumption patterns. On the production side, technological innovation in membrane filtration and enzymatic conversion enhances yield, purity, helping European processors optimize whey utilization a critical factor in EU’s circular dairy economy.

Segmental Analysis

Sales in the Lactose Market are segmented by form, derivative type, end use, distribution channel, grade, and region. By form, demand is divided into powder and granule, with powder dominating due to its extensive use in pharmaceutical excipients, infant formula, and food formulations. By derivative type, sales include monohydrate, galactose, lactulose, tagatose, and others, covering both functional and pharmaceutical applications.

End-use segments comprise food & beverage, pharmaceutical, animal feed, and others, reflecting lactose’s versatility. By distribution, direct to manufacturers, distributors/traders, and online B2B channels are included, with direct supply leading for quality and compliance. By grade, the market covers food, pharma, feed, and others. Regionally, demand spans Germany, France, Italy, Spain, the Netherlands, and Rest of Europe, EU’s core lactose hubs.

By Product Type (Derivative Type), Lactulose Segment Accounts for 38.6% Share

Demand For Lactose In Eu Analysis By Product Type 

In 2025, the lactulose segment accounted for 38.6% of total EU lactose revenues, equivalent to USD 337.4 million, underscoring its leading role as a high-value derivative. By 2035, lactulose’s share is expected to rise to 40.0% (USD 594.3 million), driven by its extensive application in pharmaceutical laxatives, prebiotic supplements, and functional gut health products. Its physiological role as a non-digestible disaccharide makes it an important therapeutic agent for managing hepatic encephalopathy and constipation, ensuring continued medical demand. European manufacturers are expanding production of pharma-grade lactulose through optimized bioconversion and controlled crystallization systems that ensure compliance with stringent European Pharmacopoeia standards.

The monohydrate segment maintains steady performance with 30.0% market share in 2025 (USD 262.2 million) and 29.0% in 2035 (USD 430.9 million). It remains the cornerstone of pharmaceutical excipient production, used across tablet compression, capsule filling, and inhalation products. With the pharmaceutical industry’s transition toward continuous manufacturing and high-speed tablet presses, lactose monohydrate’s performance consistency and batch reproducibility sustain its indispensable role.

Galactose (15% in 2025) and tagatose (8% in 2025) together represent the innovation frontier of the market. Galactose is increasingly used in dairy-based sweeteners, infant nutrition, and functional foods, while tagatose has captured the attention of sugar reformulation initiatives due to its low-calorie, low-glycemic properties. Both segments illustrate the shift from commodity lactose to specialty carbohydrate derivatives offering specific metabolic or functional benefits.

By Application, Food and Beverage Accounts for 47.8% Share

Demand For Lactose In Eu Analysis By Application 

In terms of application, food and beverage remains the largest segment, holding 47.8% share (USD 417.8 million) in 2025 and moderating slightly to 46.0% (USD 683.5 million) by 2035. EU’s strong dairy processing base, combined with innovation in infant formula, bakery, and functional beverages, underpins sustained lactose utilization. Manufacturers are increasingly emphasizing clean-label formulations, driving demand for lactose as a naturally sourced sweetener and texture enhancer. Moreover, as plant-based beverages expand, lactose derivatives such as galactose are being reformulated into hybrid dairy-alternative products to preserve sweetness profiles.

The pharmaceutical sector, representing 35.0% of EU demand in 2025 (USD 305.9 million), is forecast to rise to 36.0% (USD 534.9 million) by 2035. Lactose’s consistent particle size distribution, inertness, and compatibility with APIs make it the preferred excipient in tablet and capsule manufacturing. With continuous advancements in controlled-release dosage forms, lactose’s role as a formulation stabilizer is being further reinforced.

Animal feed applications (12.0% share) and other industrial uses (5.2%) will continue to offer niche opportunities. Lactose provides digestibility and energy density in young livestock nutrition, especially calf milk replacers and piglet feed.

Drivers, Restraints, and Key Trends

EU lactose market benefits from a unique convergence of industrial, technological, and regulatory drivers. The integration of dairy by-products into value-added ingredients aligns perfectly with EU’s circular economy agenda, ensuring that whey streams are not wasted but refined into high-value lactose and proteins. Pharmaceutical standardization, driven by EMA and European Pharmacopoeia regulations, further stimulates high-purity lactose demand.

The market faces structural restraints including volatile dairy input costs, shifts in infant formula regulations, and lactose intolerance awareness affecting consumer perception in specific regions. Producers are mitigating these risks through product diversification (into lactose-free or low-lactose formulations), strategic sourcing, and hedging contracts for dairy inputs.

Notable trends include the rise of biopharmaceutical lactose used in cell-culture media, digitally traceable ingredient labeling, and carbon-neutral dairy processing initiatives. As sustainability becomes a procurement criterion, European processors investing in renewable energy and waste valorization gain competitive advantage.
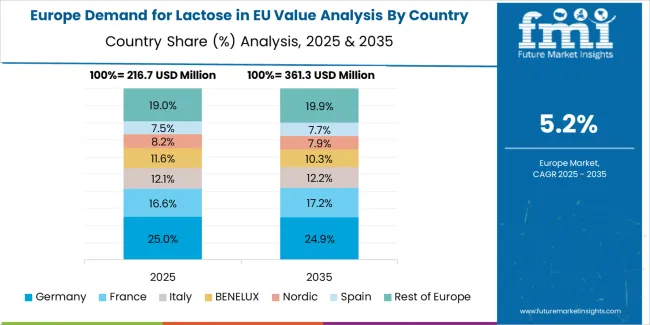
Europe Market Split by Country

Demand For Lactose In Eu Europe Country Market Share Analysis, 2025 & 2035

EU lactose market sales are projected to grow from USD 874.0 million in 2025 to USD 1,478.8 million by 2035, registering a compound annual growth rate (CAGR) of 5.4% over the forecast period. Growth is supported by strong pharmaceutical excipient demand, expansion in infant nutrition and functional food production, and increasing adoption of high-purity lactose derivatives across European manufacturing hubs.

Germany maintains the largest share of EU lactose sales at 34.5% in 2025, driven by its advanced pharmaceutical manufacturing infrastructure, extensive dairy processing capacity, and consistent export performance. France follows with solid growth and continued innovation in nutraceuticals and pharma-grade ingredients. The Netherlands benefits from strong export orientation and high-value derivative production, while Italy and Spain contribute through functional food and feed applications. The Rest of Europe segment, including Ireland, Belgium, and Nordic countries, demonstrates steady expansion supported by growing dairy valorization initiatives and biopharmaceutical production.
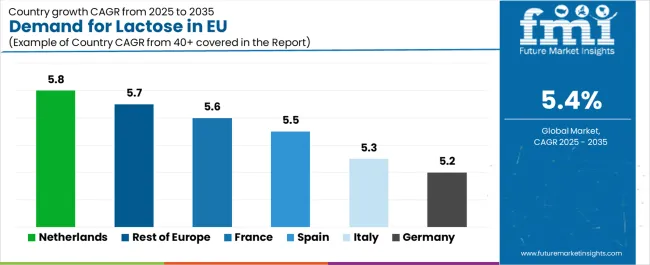
Demand For Lactose In Eu Cagr Analysis By Country

Country CAGR % (2025–2035)
Germany 5.2%
France 5.6%
Netherlands 5.8%
Italy 5.3%
Spain 5.5%
Rest of Europe 5.7%

Germany Leads European Sales with Pharmaceutical and Dairy Excellence

Revenue from lactose in Germany is projected to exhibit steady growth with a CAGR of 5.2% through 2035, driven by the country’s advanced pharmaceutical manufacturing infrastructure, high dairy processing capacity, and long-standing expertise in excipient-grade lactose production. Germany’s role as a central hub for pharma ingredient exports and functional dairy innovation continues to reinforce its dominance in EU lactose market.

Leading dairy and ingredient companies, including Milei GmbH, Meggle, and Arla Foods Ingredients, operate advanced purification facilities producing high-purity lactose and derivatives meeting stringent European Pharmacopoeia standards. German manufacturers leverage membrane filtration, chromatography, and spray-drying technologies to ensure consistent quality, supporting both domestic pharmaceutical formulation and export demand. Germany’s meticulous approach to quality, combined with its emphasis on sustainability and traceable sourcing, cements its leadership in EU lactose production and consumption.

Growth drivers:

  • Established pharmaceutical infrastructure supporting excipient-grade lactose demand
  • Strong dairy cooperatives enabling high-purity lactose production
  • Sustainability and traceability focus enhancing export competitiveness

France Demonstrates Steady Growth with Infant Nutrition and Nutraceutical Expansion

Revenue from lactose in France is expanding at a CAGR of 5.6%, supported by the country’s globally recognized expertise in infant nutrition, dairy innovation, and nutraceutical formulation. France’s strong emphasis on food science and bio-innovation, along with a maturing pharma-nutritional crossover industry, continues to drive demand for lactose derivatives, including lactulose and galactose, which are widely used in digestive health and prebiotic products.

Major ingredient producers such as Lactalis Ingredients and Savencia Fromage & Dairy have expanded production capacity to meet both domestic and international demand for high-grade lactose ingredients. French lactose manufacturers also emphasize clean-label and natural formulation standards, aligning with growing consumer preference for transparent, sustainably sourced dairy ingredients. Demand benefits from France’s leadership in infant formula production, strong export channels, and increasing interest in functional lactose derivatives across dietary supplement applications.

Success factors:

  • Leading role in infant formula and nutritional ingredient manufacturing
  • Expansion of functional and prebiotic lactose derivatives
  • Emphasis on clean-label, sustainable formulation trends

Italy Maintains Robust Growth with Functional Food Innovation

Revenue from lactose in Italy is growing at a CAGR of 5.3%, driven by expanding functional food production, increasing health-conscious consumer bases, and gradual modernization of the Italian dairy sector. Italy’s food manufacturing industry is adapting lactose into value-added applications such as functional dairy beverages, fortified bakery products, and nutraceutical formulations targeting gut and metabolic health.

Major processors, including Granarolo Group, Parmalat (Lactalis Italia), and FrieslandCampina Italy, have invested in advanced lactose recovery and purification systems that enhance production efficiency and quality. Italian food formulators are particularly focused on balancing traditional taste profiles with modern nutritional needs, integrating lactose derivatives like lactulose into wellness-oriented product lines. Italy’s lactose demand also benefits from growing nutraceutical brands, which use lactose as a carrier and stabilizer in dietary supplement tablets and powders.

Development factors:

  • Expansion of functional and fortified food applications using lactose
  • Growing wellness and nutraceutical product development
  • Dairy modernization supporting high-purity lactose output

Spain Focuses on Industrial Modernization and Export Potential

Demand for lactose in Spain is projected to grow at a CAGR of 5.5%, supported by modernization in dairy processing, expanding nutritional product manufacturing, and rising pharmaceutical outsourcing activity. Spain’s dairy cooperatives and ingredient manufacturers are increasingly investing in high-efficiency lactose crystallization and drying technologies to improve output and meet international standards.

Leading Spanish producers, such as Corporación Alimentaria Peñasanta (CAPSA) and regional dairy processors, are scaling up lactose recovery operations from whey streams, emphasizing sustainability and circular dairy practices. Spain’s lactose market is also supported by the country’s growing export orientation, with manufacturers supplying lactose and its derivatives to the pharmaceutical and food industries in Latin America and North Africa. Rising health awareness among Spanish consumers is also driving lactose use in functional and sports nutrition products.

Growth enablers:
  • Dairy sector modernization driving ingredient quality improvements
  • Export expansion to Latin America and North Africa
  • Functional food and supplement innovation increasing lactose utilization

Netherlands Emphasizes Innovation Leadership and Derivative Development

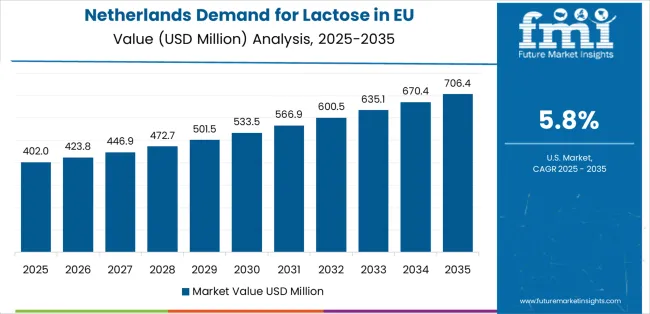
Demand For Lactose In Eu Country Value Analysis

Demand for lactose in the Netherlands is expanding at the fastest CAGR of 5.8% among EU countries, fueled by the nation’s leadership in dairy innovation, ingredient research, and export-driven processing excellence. The Netherlands hosts several of Europe’s largest dairy cooperatives, including FrieslandCampina and DOC Kaas, which have developed advanced lactose production lines integrated with membrane filtration and bioconversion technologies.

The country’s strong R&D infrastructure and commitment to sustainable dairy valorization make it a prime innovation hub for new lactose derivatives such as tagatose and lactulose, which are used in low-glycemic foods and pharmaceutical applications. Dutch ingredient producers collaborate closely with universities and biotech firms to develop next-generation lactose derivatives that balance functional benefits with clean-label expectations. The Netherlands also leads in exporting high-purity lactose to Asia and North America.

Innovation drivers:

  • Dairy innovation leadership promoting derivative development
  • Bioconversion technologies supporting high-value lactose products
  • Export-oriented processing with sustainability integration

Rest of Europe Strengthens Position with Biopharma and Sustainable Processing

Revenue from lactose in the Rest of Europe (including Ireland, Belgium, Austria, and Nordic countries) is projected to grow at a CAGR of 5.7%, reflecting accelerating investment in biopharmaceutical manufacturing, sustainable ingredient processing, and regional whey valorization projects. These markets are emerging as agile contributors to Europe’s lactose supply chain, emphasizing low-carbon production systems and traceable ingredient sourcing.

Ireland’s advanced dairy sector particularly through Glanbia Nutritionals is expanding pharma-grade lactose production for export to U.S. and APAC pharmaceutical companies. Nordic countries, led by Denmark and Finland, emphasize sustainable dairy practices and renewable-energy-based processing, ensuring low-emission lactose output. The region collectively supports Europe’s transition toward a green, technology-driven lactose industry, balancing volume growth with environmental responsibility.

Key strengths:
  • Expanding biopharma-grade lactose production for export
  • Sustainable processing powered by renewable energy
  • Regional collaboration supporting circular dairy economy

Competitive Landscape

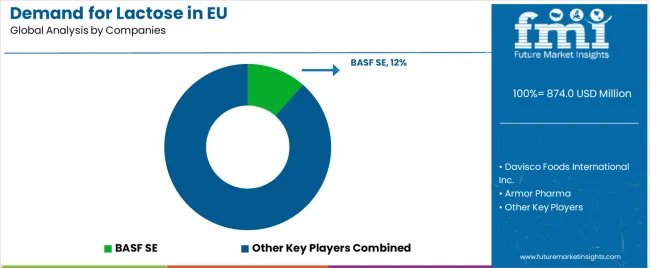
Demand For Lactose In Eu Analysis By Company

EU lactose market is characterized by competition among major dairy ingredient manufacturers, pharmaceutical excipient suppliers, and emerging derivative innovators. Companies are investing in advanced filtration technologies, enzymatic conversion, and sustainable dairy valorization to produce high-purity, compliant, and functionally specialized lactose products. Strategic integration with pharmaceutical producers, infant nutrition brands, and nutraceutical developers is central to maintaining competitiveness and meeting strict EU quality standards.

Lactalis Ingredients leads with around 9% market share, benefiting from its global ingredient expertise and strong pharma-grade lactose production. Arla Foods Ingredients follows with about 8% share, focusing on sustainability-driven lactose recovery and clean-label innovation. Kerry Group (6.5%) specializes in lactulose and tagatose derivatives for functional and low-glycemic formulations. Glanbia Nutritionals (5.5%) leverages pharmaceutical excipient expertise and high-purity manufacturing, while Milei GmbH (3.5%) excels in precision-driven pharma-grade lactose production.

Other companies collectively hold 67.5% share, reflecting a fragmented yet dynamic landscape with regional dairy cooperatives, biotechnology startups, and contract manufacturers entering the market. Competitive differentiation increasingly depends on purity standards, traceability systems, regulatory compliance, and sustainability credentials, as EU producers align with rising global demand for pharma-validated, functional, and environmentally responsible lactose solutions.

Key Players

  • BASF SE
  • Davisco Foods International Inc.
  • Armor Pharma
  • Hilmar Ingredients
  • Hoogwegt Group B.V.
  • Kerry Group Plc.
  • India Limited
  • Merck & Co. KgAa
  • Milei GmbH
  • Ba'emek Advanced Technologies Ltd.
  • Others

Scope of the Report

Item Value
Quantitative Units USD 874.0 million
Derivative Type Lactulose, Monohydrate, Galactose, Tagatose, Others
End Use Food and Beverage, Pharmaceutical, Animal Feed, Others
Form Powder, Granule
Regions Covered North America, Europe, East Asia, South Asia & Pacific, Latin America, Middle East & Africa
Countries Covered United States, Canada, United Kingdom, Germany, France, China, Japan, South Korea, India, Brazil, Australia, and 40+ countries
Key Companies Profiled Glanbia Nutritionals, Fonterra Co-operative Group, Lactalis Ingredients, Arla Foods Ingredients, Kerry Group, Davisco Foods International, Leprino Foods, Agropur Ingredients, Hilmar Ingredients, Lactose India Limited
Additional Attributes Dollar sales by derivative type and end use applications; regional consumption analysis across North America, Europe, East Asia, South Asia & Pacific, Latin America, and Middle East & Africa; competitive landscape with established dairy corporations and specialized ingredient manufacturers; consumer preferences for pharmaceutical-grade versus food-grade formulations; integration with advanced extraction and purification technologies

Key Segments 

Product Type

  • Regular/Full Fat
  • Reduced Fat

Application

  • Coffee-based Drinks (Barista)
  • Smoothies & RTD
  • Breakfast/Cereal Use
  • Cooking & Baking
  • Other Uses

Distribution Channel

  • Food Services (HoReCa)
  • Retail Stores (Brick & Mortar)
  • Online Retail

Nature

  • Conventional
  • Organic

Countries

  • Germany
  • France
  • Italy
  • Spain
  • Netherlands
  • Rest of Europe

Frequently Asked Questions

How big is the demand for lactose in EU in 2025?

The global demand for lactose in EU is estimated to be valued at USD 874.0 million in 2025.

What will be the size of demand for lactose in EU in 2035?

The market size for the demand for lactose in EU is projected to reach USD 1,478.8 million by 2035.

How much will be the demand for lactose in EU growth between 2025 and 2035?

The demand for lactose in EU is expected to grow at a 5.4% CAGR between 2025 and 2035.

What are the key product types in the demand for lactose in eu?

The key product types in demand for lactose in EU are regular/full fat  and reduced fat .

Which application  segment to contribute significant share in the demand for lactose in EU in 2025?

In terms of application , coffee-based drinks (barista)  segment to command 47.8% share in the demand for lactose in EU in 2025.

Table of Content

  1. Executive Summary
    • Global Market Outlook
    • Demand to side Trends
    • Supply to side Trends
    • Technology Roadmap Analysis
    • Analysis and Recommendations
  2. Market Overview
    • Market Coverage / Taxonomy
    • Market Definition / Scope / Limitations
  3. Market Background
    • Market Dynamics
      • Drivers
      • Restraints
      • Opportunity
      • Trends
    • Scenario Forecast
      • Demand in Optimistic Scenario
      • Demand in Likely Scenario
      • Demand in Conservative Scenario
    • Opportunity Map Analysis
    • Product Life Cycle Analysis
    • Supply Chain Analysis
    • Investment Feasibility Matrix
    • Value Chain Analysis
    • PESTLE and Porter’s Analysis
    • Regulatory Landscape
    • Regional Parent Market Outlook
    • Production and Consumption Statistics
    • Import and Export Statistics
  4. Global Market Analysis 2020 to 2024 and Forecast, 2025 to 2035
    • Historical Market Size Value (USD Million) Analysis, 2020 to 2024
    • Current and Future Market Size Value (USD Million) Projections, 2025 to 2035
      • Y to o to Y Growth Trend Analysis
      • Absolute $ Opportunity Analysis
  5. Global Market Pricing Analysis 2020 to 2024 and Forecast 2025 to 2035
  6. Global Market Analysis 2020 to 2024 and Forecast 2025 to 2035, By Product Type
    • Introduction / Key Findings
    • Historical Market Size Value (USD Million) Analysis By Product Type , 2020 to 2024
    • Current and Future Market Size Value (USD Million) Analysis and Forecast By Product Type , 2025 to 2035
      • Regular/Full Fat
      • Reduced Fat
    • Y to o to Y Growth Trend Analysis By Product Type , 2020 to 2024
    • Absolute $ Opportunity Analysis By Product Type , 2025 to 2035
  7. Global Market Analysis 2020 to 2024 and Forecast 2025 to 2035, By Application
    • Introduction / Key Findings
    • Historical Market Size Value (USD Million) Analysis By Application, 2020 to 2024
    • Current and Future Market Size Value (USD Million) Analysis and Forecast By Application, 2025 to 2035
      • Coffee-based Drinks (Barista)
      • Smoothies & RTD
      • Breakfast/Cereal Use
      • Cooking & Baking
      • Other Uses
    • Y to o to Y Growth Trend Analysis By Application, 2020 to 2024
    • Absolute $ Opportunity Analysis By Application, 2025 to 2035
  8. Global Market Analysis 2020 to 2024 and Forecast 2025 to 2035, By Region
    • Introduction
    • Historical Market Size Value (USD Million) Analysis By Region, 2020 to 2024
    • Current Market Size Value (USD Million) Analysis and Forecast By Region, 2025 to 2035
      • North America
      • Latin America
      • Western Europe
      • Eastern Europe
      • East Asia
      • South Asia and Pacific
      • Middle East & Africa
    • Market Attractiveness Analysis By Region
  9. North America Market Analysis 2020 to 2024 and Forecast 2025 to 2035, By Country
    • Historical Market Size Value (USD Million) Trend Analysis By Market Taxonomy, 2020 to 2024
    • Market Size Value (USD Million) Forecast By Market Taxonomy, 2025 to 2035
      • By Country
        • USA
        • Canada
        • Mexico
      • By Product Type
      • By Application
    • Market Attractiveness Analysis
      • By Country
      • By Product Type
      • By Application
    • Key Takeaways
  10. Latin America Market Analysis 2020 to 2024 and Forecast 2025 to 2035, By Country
    • Historical Market Size Value (USD Million) Trend Analysis By Market Taxonomy, 2020 to 2024
    • Market Size Value (USD Million) Forecast By Market Taxonomy, 2025 to 2035
      • By Country
        • Brazil
        • Chile
        • Rest of Latin America
      • By Product Type
      • By Application
    • Market Attractiveness Analysis
      • By Country
      • By Product Type
      • By Application
    • Key Takeaways
  11. Western Europe Market Analysis 2020 to 2024 and Forecast 2025 to 2035, By Country
    • Historical Market Size Value (USD Million) Trend Analysis By Market Taxonomy, 2020 to 2024
    • Market Size Value (USD Million) Forecast By Market Taxonomy, 2025 to 2035
      • By Country
        • Germany
        • UK
        • Italy
        • Spain
        • France
        • Nordic
        • BENELUX
        • Rest of Western Europe
      • By Product Type
      • By Application
    • Market Attractiveness Analysis
      • By Country
      • By Product Type
      • By Application
    • Key Takeaways
  12. Eastern Europe Market Analysis 2020 to 2024 and Forecast 2025 to 2035, By Country
    • Historical Market Size Value (USD Million) Trend Analysis By Market Taxonomy, 2020 to 2024
    • Market Size Value (USD Million) Forecast By Market Taxonomy, 2025 to 2035
      • By Country
        • Russia
        • Poland
        • Hungary
        • Balkan & Baltic
        • Rest of Eastern Europe
      • By Product Type
      • By Application
    • Market Attractiveness Analysis
      • By Country
      • By Product Type
      • By Application
    • Key Takeaways
  13. East Asia Market Analysis 2020 to 2024 and Forecast 2025 to 2035, By Country
    • Historical Market Size Value (USD Million) Trend Analysis By Market Taxonomy, 2020 to 2024
    • Market Size Value (USD Million) Forecast By Market Taxonomy, 2025 to 2035
      • By Country
        • China
        • Japan
        • South Korea
      • By Product Type
      • By Application
    • Market Attractiveness Analysis
      • By Country
      • By Product Type
      • By Application
    • Key Takeaways
  14. South Asia and Pacific Market Analysis 2020 to 2024 and Forecast 2025 to 2035, By Country
    • Historical Market Size Value (USD Million) Trend Analysis By Market Taxonomy, 2020 to 2024
    • Market Size Value (USD Million) Forecast By Market Taxonomy, 2025 to 2035
      • By Country
        • India
        • ASEAN
        • Australia & New Zealand
        • Rest of South Asia and Pacific
      • By Product Type
      • By Application
    • Market Attractiveness Analysis
      • By Country
      • By Product Type
      • By Application
    • Key Takeaways
  15. Middle East & Africa Market Analysis 2020 to 2024 and Forecast 2025 to 2035, By Country
    • Historical Market Size Value (USD Million) Trend Analysis By Market Taxonomy, 2020 to 2024
    • Market Size Value (USD Million) Forecast By Market Taxonomy, 2025 to 2035
      • By Country
        • Kingdom of Saudi Arabia
        • Other GCC Countries
        • Turkiye
        • South Africa
        • Other African Union
        • Rest of Middle East & Africa
      • By Product Type
      • By Application
    • Market Attractiveness Analysis
      • By Country
      • By Product Type
      • By Application
    • Key Takeaways
  16. Key Countries Market Analysis
    • USA
      • Pricing Analysis
      • Market Share Analysis, 2024
        • By Product Type
        • By Application
    • Canada
      • Pricing Analysis
      • Market Share Analysis, 2024
        • By Product Type
        • By Application
    • Mexico
      • Pricing Analysis
      • Market Share Analysis, 2024
        • By Product Type
        • By Application
    • Brazil
      • Pricing Analysis
      • Market Share Analysis, 2024
        • By Product Type
        • By Application
    • Chile
      • Pricing Analysis
      • Market Share Analysis, 2024
        • By Product Type
        • By Application
    • Germany
      • Pricing Analysis
      • Market Share Analysis, 2024
        • By Product Type
        • By Application
    • UK
      • Pricing Analysis
      • Market Share Analysis, 2024
        • By Product Type
        • By Application
    • Italy
      • Pricing Analysis
      • Market Share Analysis, 2024
        • By Product Type
        • By Application
    • Spain
      • Pricing Analysis
      • Market Share Analysis, 2024
        • By Product Type
        • By Application
    • France
      • Pricing Analysis
      • Market Share Analysis, 2024
        • By Product Type
        • By Application
    • India
      • Pricing Analysis
      • Market Share Analysis, 2024
        • By Product Type
        • By Application
    • ASEAN
      • Pricing Analysis
      • Market Share Analysis, 2024
        • By Product Type
        • By Application
    • Australia & New Zealand
      • Pricing Analysis
      • Market Share Analysis, 2024
        • By Product Type
        • By Application
    • China
      • Pricing Analysis
      • Market Share Analysis, 2024
        • By Product Type
        • By Application
    • Japan
      • Pricing Analysis
      • Market Share Analysis, 2024
        • By Product Type
        • By Application
    • South Korea
      • Pricing Analysis
      • Market Share Analysis, 2024
        • By Product Type
        • By Application
    • Russia
      • Pricing Analysis
      • Market Share Analysis, 2024
        • By Product Type
        • By Application
    • Poland
      • Pricing Analysis
      • Market Share Analysis, 2024
        • By Product Type
        • By Application
    • Hungary
      • Pricing Analysis
      • Market Share Analysis, 2024
        • By Product Type
        • By Application
    • Kingdom of Saudi Arabia
      • Pricing Analysis
      • Market Share Analysis, 2024
        • By Product Type
        • By Application
    • Turkiye
      • Pricing Analysis
      • Market Share Analysis, 2024
        • By Product Type
        • By Application
    • South Africa
      • Pricing Analysis
      • Market Share Analysis, 2024
        • By Product Type
        • By Application
  17. Market Structure Analysis
    • Competition Dashboard
    • Competition Benchmarking
    • Market Share Analysis of Top Players
      • By Regional
      • By Product Type
      • By Application
  18. Competition Analysis
    • Competition Deep Dive
      • BASF SE
        • Overview
        • Product Portfolio
        • Profitability by Market Segments (Product/Age /Sales Channel/Region)
        • Sales Footprint
        • Strategy Overview
          • Marketing Strategy
          • Product Strategy
          • Channel Strategy
      • Davisco Foods International Inc.
      • Armor Pharma
      • Hilmar Ingredients
      • Hoogwegt Group B.V.
      • Kerry Group Plc.
      • India Limited
      • Merck & Co. KgAa
      • Milei GmbH
      • Ba'emek Advanced Technologies Ltd.
      • Others
  19. Assumptions & Acronyms Used
  20. Research Methodology

List of Tables

  • Table 1: Global Market Value (USD Million) Forecast by Region, 2020 to 2035
  • Table 2: Global Market Value (USD Million) Forecast by Product Type , 2020 to 2035
  • Table 3: Global Market Value (USD Million) Forecast by Application, 2020 to 2035
  • Table 4: North America Market Value (USD Million) Forecast by Country, 2020 to 2035
  • Table 5: North America Market Value (USD Million) Forecast by Product Type , 2020 to 2035
  • Table 6: North America Market Value (USD Million) Forecast by Application, 2020 to 2035
  • Table 7: Latin America Market Value (USD Million) Forecast by Country, 2020 to 2035
  • Table 8: Latin America Market Value (USD Million) Forecast by Product Type , 2020 to 2035
  • Table 9: Latin America Market Value (USD Million) Forecast by Application, 2020 to 2035
  • Table 10: Western Europe Market Value (USD Million) Forecast by Country, 2020 to 2035
  • Table 11: Western Europe Market Value (USD Million) Forecast by Product Type , 2020 to 2035
  • Table 12: Western Europe Market Value (USD Million) Forecast by Application, 2020 to 2035
  • Table 13: Eastern Europe Market Value (USD Million) Forecast by Country, 2020 to 2035
  • Table 14: Eastern Europe Market Value (USD Million) Forecast by Product Type , 2020 to 2035
  • Table 15: Eastern Europe Market Value (USD Million) Forecast by Application, 2020 to 2035
  • Table 16: East Asia Market Value (USD Million) Forecast by Country, 2020 to 2035
  • Table 17: East Asia Market Value (USD Million) Forecast by Product Type , 2020 to 2035
  • Table 18: East Asia Market Value (USD Million) Forecast by Application, 2020 to 2035
  • Table 19: South Asia and Pacific Market Value (USD Million) Forecast by Country, 2020 to 2035
  • Table 20: South Asia and Pacific Market Value (USD Million) Forecast by Product Type , 2020 to 2035
  • Table 21: South Asia and Pacific Market Value (USD Million) Forecast by Application, 2020 to 2035
  • Table 22: Middle East & Africa Market Value (USD Million) Forecast by Country, 2020 to 2035
  • Table 23: Middle East & Africa Market Value (USD Million) Forecast by Product Type , 2020 to 2035
  • Table 24: Middle East & Africa Market Value (USD Million) Forecast by Application, 2020 to 2035

List of Figures

  • Figure 1: Global Market Pricing Analysis
  • Figure 2: Global Market Value (USD Million) Forecast 2020-2035
  • Figure 3: Global Market Value Share and BPS Analysis by Product Type , 2025 and 2035
  • Figure 4: Global Market Y to o to Y Growth Comparison by Product Type , 2025-2035
  • Figure 5: Global Market Attractiveness Analysis by Product Type
  • Figure 6: Global Market Value Share and BPS Analysis by Application, 2025 and 2035
  • Figure 7: Global Market Y to o to Y Growth Comparison by Application, 2025-2035
  • Figure 8: Global Market Attractiveness Analysis by Application
  • Figure 9: Global Market Value (USD Million) Share and BPS Analysis by Region, 2025 and 2035
  • Figure 10: Global Market Y to o to Y Growth Comparison by Region, 2025-2035
  • Figure 11: Global Market Attractiveness Analysis by Region
  • Figure 12: North America Market Incremental Dollar Opportunity, 2025-2035
  • Figure 13: Latin America Market Incremental Dollar Opportunity, 2025-2035
  • Figure 14: Western Europe Market Incremental Dollar Opportunity, 2025-2035
  • Figure 15: Eastern Europe Market Incremental Dollar Opportunity, 2025-2035
  • Figure 16: East Asia Market Incremental Dollar Opportunity, 2025-2035
  • Figure 17: South Asia and Pacific Market Incremental Dollar Opportunity, 2025-2035
  • Figure 18: Middle East & Africa Market Incremental Dollar Opportunity, 2025-2035
  • Figure 19: North America Market Value Share and BPS Analysis by Country, 2025 and 2035
  • Figure 20: North America Market Value Share and BPS Analysis by Product Type , 2025 and 2035
  • Figure 21: North America Market Y to o to Y Growth Comparison by Product Type , 2025-2035
  • Figure 22: North America Market Attractiveness Analysis by Product Type
  • Figure 23: North America Market Value Share and BPS Analysis by Application, 2025 and 2035
  • Figure 24: North America Market Y to o to Y Growth Comparison by Application, 2025-2035
  • Figure 25: North America Market Attractiveness Analysis by Application
  • Figure 26: Latin America Market Value Share and BPS Analysis by Country, 2025 and 2035
  • Figure 27: Latin America Market Value Share and BPS Analysis by Product Type , 2025 and 2035
  • Figure 28: Latin America Market Y to o to Y Growth Comparison by Product Type , 2025-2035
  • Figure 29: Latin America Market Attractiveness Analysis by Product Type
  • Figure 30: Latin America Market Value Share and BPS Analysis by Application, 2025 and 2035
  • Figure 31: Latin America Market Y to o to Y Growth Comparison by Application, 2025-2035
  • Figure 32: Latin America Market Attractiveness Analysis by Application
  • Figure 33: Western Europe Market Value Share and BPS Analysis by Country, 2025 and 2035
  • Figure 34: Western Europe Market Value Share and BPS Analysis by Product Type , 2025 and 2035
  • Figure 35: Western Europe Market Y to o to Y Growth Comparison by Product Type , 2025-2035
  • Figure 36: Western Europe Market Attractiveness Analysis by Product Type
  • Figure 37: Western Europe Market Value Share and BPS Analysis by Application, 2025 and 2035
  • Figure 38: Western Europe Market Y to o to Y Growth Comparison by Application, 2025-2035
  • Figure 39: Western Europe Market Attractiveness Analysis by Application
  • Figure 40: Eastern Europe Market Value Share and BPS Analysis by Country, 2025 and 2035
  • Figure 41: Eastern Europe Market Value Share and BPS Analysis by Product Type , 2025 and 2035
  • Figure 42: Eastern Europe Market Y to o to Y Growth Comparison by Product Type , 2025-2035
  • Figure 43: Eastern Europe Market Attractiveness Analysis by Product Type
  • Figure 44: Eastern Europe Market Value Share and BPS Analysis by Application, 2025 and 2035
  • Figure 45: Eastern Europe Market Y to o to Y Growth Comparison by Application, 2025-2035
  • Figure 46: Eastern Europe Market Attractiveness Analysis by Application
  • Figure 47: East Asia Market Value Share and BPS Analysis by Country, 2025 and 2035
  • Figure 48: East Asia Market Value Share and BPS Analysis by Product Type , 2025 and 2035
  • Figure 49: East Asia Market Y to o to Y Growth Comparison by Product Type , 2025-2035
  • Figure 50: East Asia Market Attractiveness Analysis by Product Type
  • Figure 51: East Asia Market Value Share and BPS Analysis by Application, 2025 and 2035
  • Figure 52: East Asia Market Y to o to Y Growth Comparison by Application, 2025-2035
  • Figure 53: East Asia Market Attractiveness Analysis by Application
  • Figure 54: South Asia and Pacific Market Value Share and BPS Analysis by Country, 2025 and 2035
  • Figure 55: South Asia and Pacific Market Value Share and BPS Analysis by Product Type , 2025 and 2035
  • Figure 56: South Asia and Pacific Market Y to o to Y Growth Comparison by Product Type , 2025-2035
  • Figure 57: South Asia and Pacific Market Attractiveness Analysis by Product Type
  • Figure 58: South Asia and Pacific Market Value Share and BPS Analysis by Application, 2025 and 2035
  • Figure 59: South Asia and Pacific Market Y to o to Y Growth Comparison by Application, 2025-2035
  • Figure 60: South Asia and Pacific Market Attractiveness Analysis by Application
  • Figure 61: Middle East & Africa Market Value Share and BPS Analysis by Country, 2025 and 2035
  • Figure 62: Middle East & Africa Market Value Share and BPS Analysis by Product Type , 2025 and 2035
  • Figure 63: Middle East & Africa Market Y to o to Y Growth Comparison by Product Type , 2025-2035
  • Figure 64: Middle East & Africa Market Attractiveness Analysis by Product Type
  • Figure 65: Middle East & Africa Market Value Share and BPS Analysis by Application, 2025 and 2035
  • Figure 66: Middle East & Africa Market Y to o to Y Growth Comparison by Application, 2025-2035
  • Figure 67: Middle East & Africa Market Attractiveness Analysis by Application
  • Figure 68: Global Market - Tier Structure Analysis
  • Figure 69: Global Market - Company Share Analysis
Dashboard
Dashboard
Dashboard
Dashboard
Dashboard
Dashboard

Full Research Suite comprises of:

Market outlook & trends analysis

Market outlook & trends analysis

Interviews & case studies

Interviews & case studies

Strategic recommendations

Strategic recommendations

Vendor profiles & capabilities analysis

Vendor profiles & capabilities analysis

5-year forecasts

5-year forecasts

8 regions and 60+ country-level data splits

8 regions and 60+ country-level data splits

Market segment data splits

Market segment data splits

12 months of continuous data updates

12 months of continuous data updates

DELIVERED AS:

PDF EXCEL ONLINE

Full Research Suite


$3500

$5000

$6500

Buy Report Now
Similar Industry Reports

Similar Industry Reports

Demand Signal Repository Solutions Market

Demand Signal Repository Solutions Market Size and Share Forecast Outlook 2025 to 2035

Demand Side Management Market

Demand Side Management Market Size and Share Forecast Outlook 2025 to 2035

Demand Response Market

Demand Response Market Analysis - Size, Share, and Forecast Outlook 2025 to 2035

Demand Analysis of Shipping Supplies in North America

North America Shipping Supplies Market Trends – Innovations & Growth 2024-2034

Demand of Kozani Saffron in Greece

Demand of Kozani Saffron in Greece Analysis - Size, Share & Forecast 2025 to 2035

Demand of No-acid Whey Strained Dairy Processing Concepts

Demand of No-acid Whey Strained Dairy Processing Concepts in European Union Size and Share Forecast Outlook 2025 to 2035

Demand of Bronte Pistachio in Italy

Demand for Bronte Pistachio in Italy Analysis - Size, Share & Forecast 2025 to 2035

Demand and Trend Analysis of Gaming Monitor in Japan

Demand and Trend Analysis of Gaming Monitor in Japan Size and Share Forecast Outlook 2025 to 2035

Demand and Trend Analysis of Gaming Monitor in Korea

Demand and Trend Analysis of Gaming Monitor in Korea Size and Share Forecast Outlook 2025 to 2035

Demand and Trend Analysis of Gaming Monitor in Western Europe

Demand and Trend Analysis of Gaming Monitor in Western Europe Size and Share Forecast Outlook 2025 to 2035

Demand and Trend Analysis of Glycine Soja (Soybean) Seed Extract Market

Glycine Soja (Soybean) Seed Extract Market Size and Share Forecast Outlook 2025 to 2035

Demand and Trend Analysis of Yeast in Japan

Demand and Trend Analysis of Yeast in Japan - Size, Share, and Forecast Outlook 2025 to 2035

Demand and Trends Analysis of Stevia in Japan

Demand and Trends Analysis of Stevia in Japan Size and Share Forecast Outlook 2025 to 2035

Demand of Pistachio-based desserts & ingredients in France

Demand of Pistachio-based desserts & ingredients in France Analysis - Size, Share & Forecast 2025 to 2035

Demand and Trend Analysis of Women’s Intimate Care Product in Japan

Japan Women’s Intimate Care Market Trends – Growth & Forecast 2024-2034

Demand and Trend Analysis of Men’s Skincare Product in Western Europe

Western Europe Men’s Skincare Market Analysis – Forecast 2023-2033

Demand and Trend Analysis of Fabric Stain Remover in Korea

Demand and Trend Analysis of Fabric Stain Remover in Korea Size and Share Forecast Outlook 2025 to 2035

Demand and Sales Analysis of Paper Cup in Japan

Demand and Sales Analysis of Paper Cup in Japan Size and Share Forecast Outlook 2025 to 2035

Demand and Sales Analysis of Paper Cup in Korea

Demand and Sales Analysis of Paper Cup in Korea Size and Share Forecast Outlook 2025 to 2035

Demand of MFGM-enriched Powders & RTDs in European Union

Demand of MFGM-enriched Powders & RTDs in European Union Size and Share Forecast Outlook 2025 to 2035

Future Market Insights

Demand for Lactose in EU

Chat With MaRIA

Chat With

MaRIA

Hi There, I am MaRIA, Your Market Research Intelligence Assistant. How may I help you?