Demand for N-Heptane in EU: Forecast and Outlook 2025 to 2035

By 2035, the demand for N-heptane industry in EU is forecasted to reach USD 289.4 million, expanding from USD 174.3 million in 2025. Growth of 66% translates into a CAGR of 5.2% across the period, with the overall industry size rising by nearly 1.7X. Ultra-pure segments remain critical, as N-heptane exceeding 99% purity is projected to account for 46% of sales in 2025, while pharmaceutical applications alone are set to generate 33% of consumption.

The decade-long expansion is underpinned by evolving industrial requirements. Drug manufacturers are increasingly dependent on solvents that deliver reproducibility and compliance with stringent regulations. Electronics producers continue to demand high-purity grades to support precision cleaning for semiconductors and miniaturized devices. Adhesives and coatings facilities across Europe provide a steady industrial baseline, where N-heptane functions as a processing aid and solvent with proven efficiency.

Sales are projected to increase from USD 174.3 million to USD 224.9 million between 2025 and 2030, delivering USD 50.6 million in added value, or 44% of the ten-year expansion. This phase highlights the resilience of pharmaceutical manufacturing, with solvent requirements remaining constant in active ingredient production and drug synthesis. Electronics growth further reinforces adoption, while adhesives and coatings sustain steady demand across industrial facilities. Producers are expected to strengthen refining and purification infrastructure to meet regulatory-driven demand for consistent quality.

In the second half of the forecast horizon, expansion accelerates. Between 2030 and 2035, sales are expected to rise from USD 224.9 million to USD 289.4 million, creating USD 64.4 million in additional value, or 56% of decade-long gains. At this stage, the industry will benefit from broader integration of specialized high-purity grades into premium applications. Advanced pharmaceutical production and growing sophistication in electronics fabrication will create stronger requirements for documented purity, validated performance, and regulatory assurance. The 2020–2025 period provided the foundation for this trajectory. Sales climbed from USD 140 million to USD 174.3 million at a CAGR of 4.7%. The growth was anchored by resilient pharmaceutical demand, ongoing investments in European electronics manufacturing, and consistent use of N-heptane in coatings and adhesives. Producers responded with improvements in quality control, batch-to-batch reproducibility, and supply reliability, setting the stage for continued momentum through 2035.
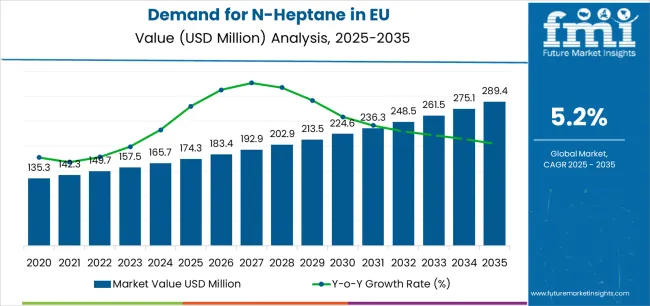
Quick Stats for N-Heptane in EU

  • N-Heptane in EU Value (2025): USD 174.3 million
  • N-Heptane in EU Forecast Value (2035): USD 289.4 million
  • N-Heptane in EU Forecast CAGR: 5.2%
  • Leading Product Type in N-Heptane in EU: >99% Purity (46%)
  • Key Growth Countries in N-Heptane in EU: Netherlands, France, and Spain
  • Top Application Segment in N-Heptane in EU: Pharmaceuticals (33%)

Demand For N Heptane In Eu Market Value Analysis

Demand for N-Heptane in EU: Key Takeaways

Metric Value
Estimated Value in (2025E) USD 174.3 million
Forecast Value in (2035F) USD 289.4 million
Forecast CAGR (2025 to 2035) 5.2%

Why is the Demand for N-Heptane Growing in EU?

Industry expansion is being supported by the stringent purity requirements of pharmaceutical manufacturing operations across European countries and the corresponding demand for ultra-pure, consistent-quality solvents with proven performance in drug synthesis, extraction, and purification applications.

Modern pharmaceutical manufacturers rely on n-heptane as an essential processing solvent for active pharmaceutical ingredient synthesis, botanical extraction supporting natural product pharmaceuticals, and chromatography applications requiring precisely controlled chemical properties, driving demand for products that deliver exceptional purity levels eliminating trace contaminants, consistent composition ensuring reproducible processes, and comprehensive quality documentation supporting regulatory compliance.

Even specialized pharmaceutical applications, such as high-value drug synthesis, botanical extraction for nutraceuticals, or analytical chemistry procedures, drive comprehensive high-purity n-heptane requirements to maintain optimal manufacturing reliability and support stringent quality standards.

The established infrastructure of European pharmaceutical manufacturing clusters and increasing recognition of electronics cleaning solvent requirements are driving demand for n-heptane from certified suppliers with appropriate quality management systems and technical capabilities.

Regulatory authorities are increasingly establishing clear guidelines for pharmaceutical solvent specifications, including residual impurity limits, electronics cleaning standards requiring ultra-pure solvents to prevent contamination, and quality requirements to maintain product integrity and ensure process consistency.

Industrial application validation protocols and pharmaceutical monograph specifications are providing requirements supporting n-heptane characteristics, requiring specialized distillation processes and standardized purification protocols for consistent purity profiles, optimal boiling point ranges, and appropriate evaporation rates, including comprehensive analytical testing ensuring compliance with pharmacopeial standards.

Segmental Analysis

Sales are segmented by purity (grade), application (end use), and country. By purity, demand is divided into >99% purity, 95-99% purity, and <95% purity. Based on the application, sales are categorized into pharmaceuticals, electronics, adhesives and sealants, paints and coatings, plastics and polymers, and others. Regionally, demand is focused on Germany, France, Italy, Spain, the Netherlands, and the Rest of Europe.

By Purity, >99% Purity Segment Accounts for 46% Industry Share

Demand For N Heptane In Eu Analysis By Purity (grade)

The >99% purity segment is projected to account for 46% of EU n-heptane sales in 2025, establishing itself as the dominant purity grade across European industries. This commanding position is fundamentally supported by ultra-high-purity n-heptane's critical role in pharmaceutical manufacturing requiring stringent solvent specifications, electronics applications demanding minimal contamination, and analytical chemistry procedures necessitating precisely controlled chemical composition.

The >99% purity format delivers exceptional quality assurance, providing pharmaceutical manufacturers with solvents that facilitate regulatory compliance with pharmacopeial standards, enable reproducible extraction and synthesis processes, and eliminate trace impurities potentially affecting drug quality.

This segment benefits from established distillation and purification infrastructure producing pharmaceutical-grade solvents, well-developed quality control systems ensuring batch consistency, and extensive technical relationships with major European pharmaceutical companies who maintain approved supplier lists. Additionally, >99% purity n-heptane offers versatility across demanding applications, including pharmaceutical synthesis requiring minimal impurity interference, electronics cleaning preventing residue formation, and laboratory analytical procedures demanding certified reference quality, supported by comprehensive documentation including certificates of analysis and regulatory compliance statements.

The segment is expected to increase share to 48.0% through 2035, demonstrating continued growth as pharmaceutical and electronics applications expand faster than industrial uses accepting lower purity grades throughout the forecast period.

  • Pharmaceutical-grade purity meeting stringent pharmacopeial specifications and regulatory requirements
  • Electronics compatibility preventing contamination in sensitive semiconductor cleaning operations
  • Comprehensive quality documentation supporting pharmaceutical and electronics industry qualification processes

By Application, Pharmaceuticals Segment Accounts for 33% Industry Share

Demand For N Heptane In Eu Analysis By Application (end Use)

Pharmaceuticals application is positioned to represent 33% of total n-heptane demand across European industries in 2025, increasing to 34.0% by 2035, reflecting the segment's position as the primary consumption driver within the overall industry ecosystem.

This considerable share directly demonstrates that pharmaceutical manufacturing represents the largest single application, with producers consuming n-heptane for active pharmaceutical ingredient synthesis, botanical extraction producing natural pharmaceuticals and nutraceuticals, and pharmaceutical processing operations requiring high-purity solvents.

Modern pharmaceutical manufacturing increasingly relies on n-heptane meeting stringent purity specifications, driving demand for ultra-pure grades optimized for drug synthesis preventing impurity interference, consistent quality ensuring reproducible extraction yields, and comprehensive documentation supporting good manufacturing practice (GMP) compliance.

The segment benefits from European pharmaceutical industry strength including major drug manufacturing operations, growing botanical extraction supporting natural product pharmaceuticals, and stringent regulatory standards ensuring continued specification of high-quality solvents.

The segment's increasing share reflects pharmaceutical sector resilience and growing natural product extraction applications, while industrial applications grow at slightly slower rates throughout the forecast period.

  • Drug synthesis applications requiring ultra-pure solvents for pharmaceutical manufacturing
  • Botanical extraction supporting natural pharmaceuticals and nutraceutical production
  • Regulatory compliance driving consistent specification of pharmaceutical-grade n-heptane

What are the Drivers, Restraints, and Key Trends of the EU N-Heptane Industry?

EU n-heptane sales are advancing steadily due to sustained pharmaceutical manufacturing requiring high-purity solvents, growing electronics sector utilization, and consistent industrial applications. However, the industry faces challenges, including crude oil price volatility affecting production costs and pricing stability, potential bio-based solvent substitution in some applications threatening industry share, and increasingly stringent VOC regulations requiring emission control investments. Continued focus on purity improvement and application development remains central to industry stability.

Expansion of Pharmaceutical Manufacturing in Europe

The steadily growing pharmaceutical production across European manufacturing sites is fundamentally supporting n-heptane demand through drug synthesis processes, botanical extraction operations, and pharmaceutical processing applications requiring high-purity solvents meeting stringent regulatory specifications.

Advanced pharmaceutical manufacturing facilities producing both synthetic drugs and natural product pharmaceuticals systematically consume pharmaceutical-grade n-heptane for active ingredient synthesis, plant extract preparation supporting herbal medicines and nutraceuticals, and pharmaceutical processing operations where solvent purity directly impacts drug quality and regulatory compliance.

These pharmaceutical applications prove particularly important for n-heptane suppliers, as pharmaceutical specifications command premium pricing, support long-term supply relationships, and create technical service opportunities through regulatory compliance support.

Integration of Advanced Purification Technologies

Modern n-heptane producers systematically incorporate improved purification methods, including advanced distillation systems achieving ultra-high purity levels, specialized treatment processes removing trace contaminants, and quality control technologies ensuring batch consistency. Strategic integration of advanced purification capabilities enables manufacturers to differentiate products through guaranteed ultra-high purity exceeding 99.5%, comprehensive impurity analysis documenting trace contaminant levels, and consistent quality supporting pharmaceutical and electronics applications. These purity improvements prove essential for industry positioning, as pharmaceutical and electronics customers increasingly demand guaranteed specifications, comprehensive analytical documentation, and proven batch-to-batch consistency.

Growing Emphasis on Supply Chain Security and Qualification

European pharmaceutical and electronics manufacturers increasingly prioritize supply chain security for critical solvents including n-heptane, driving demand for qualified European suppliers, strategic inventory programs, and long-term supply agreements ensuring material availability supporting production continuity. This supply chain emphasis enables industrial customers to mitigate risks through geographically diversified sourcing, qualified backup suppliers maintaining appropriate quality certifications, and inventory strategies protecting against supply disruptions. Supply chain security proves particularly important for pharmaceutical applications given stringent supplier qualification requirements, extensive validation preventing supplier changes, and regulatory documentation requirements creating switching barriers.
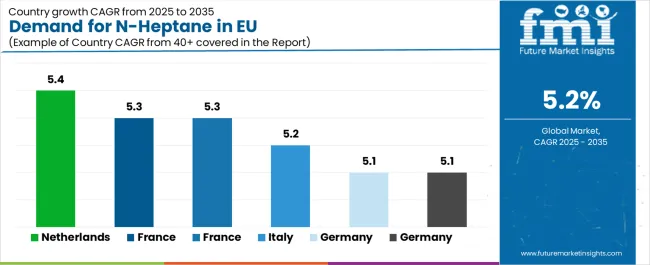
Demand Analysis of N-Heptane in EU by Key Countries

Demand For N Heptane In Eu Cagr Analysis By Country

Country CAGR %
Netherlands 5.4%
France 5.3%
Spain 5.3%
Italy 5.2%
Germany 5.1%
Rest of Europe 5.1%

EU n-heptane sales demonstrate steady growth across major European economies, with the Netherlands leading expansion at 5.4% CAGR through 2035, driven by pharmaceutical manufacturing and chemical distribution excellence. Germany maintains leadership through pharmaceutical production concentration and comprehensive chemical industry infrastructure.

France benefits from diversified pharmaceutical and specialty chemical manufacturing. Italy leverages pharmaceutical production and industrial solvent applications. Spain shows solid growth supported by pharmaceutical manufacturing expansion and growing electronics sector. The Netherlands emphasizes pharmaceutical ingredient production and strategic distribution capabilities. Overall, sales show stable regional development reflecting sustained pharmaceutical demand and growing electronics applications.

Germany Leads European Sales with Pharmaceutical and Chemical Hub Status

Revenue from n-heptane in Germany is projected to exhibit steady growth with a CAGR of 5.1% through 2035, driven by substantial pharmaceutical manufacturing including major drug production facilities and active ingredient synthesis operations, comprehensive chemical industry infrastructure, and established electronics sector throughout the country. Germany's position as Europe's pharmaceutical and chemical manufacturing center and its advanced industrial base are creating substantial demand for diverse n-heptane purity grades across pharmaceutical and industrial applications.

Major pharmaceutical operations, including large-scale drug manufacturers and specialty pharmaceutical companies, along with adhesives producers and electronics manufacturers, systematically consume n-heptane for drug synthesis, botanical extraction, and precision cleaning applications, with direct procurement relationships ensuring quality consistency and supply reliability. German demand benefits from stringent pharmaceutical quality standards driving ultra-high-purity n-heptane specification, substantial chemical industry requiring industrial-grade solvents, and technical sophistication supporting proper solvent selection and handling practices.

  • Pharmaceutical manufacturing concentration driving pharmaceutical-grade n-heptane consumption
  • Chemical industry infrastructure supporting diverse industrial solvent applications
  • Technical expertise enabling proper solvent handling and quality management

France Demonstrates Strong Growth with Pharmaceutical Production

Revenue from n-heptane in France is expanding at a CAGR of 5.3%, substantially supported by significant pharmaceutical manufacturing including both synthetic drug production and botanical extraction operations, growing specialty chemicals sector, and steady industrial applications. France's established pharmaceutical industry presence and diversified chemical manufacturing are systematically driving demand for high-purity n-heptane products.

Major pharmaceutical manufacturing operations, specialty chemical producers, and industrial solvent users are steadily maintaining n-heptane consumption serving pharmaceutical synthesis, extraction processes, and industrial applications. French sales particularly benefit from pharmaceutical industry concentration in specific regions supporting high-purity n-heptane demand, botanical extraction operations producing natural pharmaceuticals and flavors, and specialty chemicals manufacturing requiring reliable solvent supplies.

  • Pharmaceutical industry presence driving high-purity grade consumption
  • Botanical extraction operations supporting natural product manufacturing
  • Specialty chemicals sector requiring consistent industrial-grade solvents

Italy Maintains Solid Growth with Pharmaceutical and Industrial Focus

Revenue from n-heptane in Italy is growing at a CAGR of 5.2%, fundamentally driven by pharmaceutical manufacturing, adhesives and sealants production, and steady industrial solvent applications. Italy's pharmaceutical sector and established chemical industry are gradually increasing n-heptane requirements across multiple application segments.

Major pharmaceutical producers, adhesives manufacturers, and specialty chemical companies strategically utilize n-heptane for drug synthesis, solvent applications, and processing operations. Italian sales particularly benefit from pharmaceutical production supporting high-purity consumption, adhesives industry concentration requiring industrial-grade solvents, and diverse chemical manufacturing supporting consistent solvent demand.

  • Pharmaceutical production driving pharmaceutical-grade solvent consumption
  • Adhesives industry supporting industrial-grade n-heptane applications
  • Specialty chemical manufacturing maintaining consistent solvent requirements

Spain Focuses on Pharmaceutical Expansion and Electronics Growth

Demand for n-heptane in Spain is projected to grow at a CAGR of 5.3%, substantially supported by expanding pharmaceutical manufacturing sector, growing electronics production, and developing specialty chemicals industry. Spanish pharmaceutical and electronics manufacturing growth position n-heptane as important specialty solvent supporting industrial expansion.

Major pharmaceutical manufacturing facilities, growing electronics operations, and chemical producers systematically increase n-heptane consumption supporting drug production, electronics cleaning, and industrial applications. Spain's pharmaceutical manufacturing expansion creates increasing solvent demand, electronics sector growth drives precision cleaning applications, and industrial development supports consistent solvent consumption.
  • Pharmaceutical manufacturing expansion driving high-purity solvent demand
  • Electronics sector growth supporting precision cleaning applications
  • Industrial chemical development requiring reliable solvent supplies

Netherlands Emphasizes Pharmaceutical Production and Distribution Excellence

Demand For N Heptane In Eu Country Value Analysis

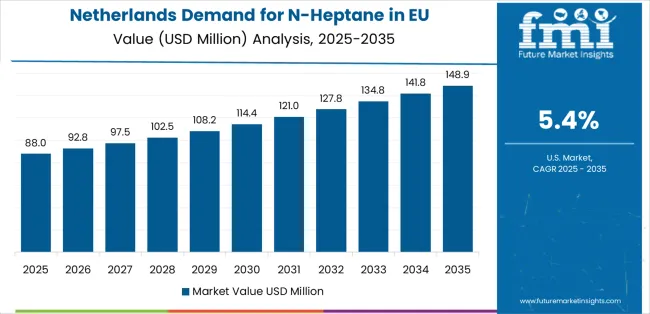
Demand for n-heptane in the Netherlands is expanding at the highest CAGR of 5.4%, fundamentally driven by concentrated pharmaceutical manufacturing including active ingredient production, strategic position as European chemical distribution hub, and specialty chemical manufacturing presence. Dutch pharmaceutical sector's emphasis on active ingredient manufacturing and strategic logistics position n-heptane as critical specialty solvent.

Netherlands sales significantly benefit from pharmaceutical active ingredient manufacturing requiring ultra-high-purity solvents, chemical distribution hub status facilitating European industry access, and specialty chemical concentration creating consistent industrial demand. The country's pharmaceutical specialization creates premium applications, while distribution infrastructure supports efficient logistics throughout European industries, and quality standards drive high-purity grade preference.
  • Pharmaceutical active ingredient production driving ultra-high-purity consumption
  • Chemical distribution hub position facilitating European industry logistics
  • Specialty chemical concentration supporting consistent industrial demand

Europe Industry Split by Key Countries

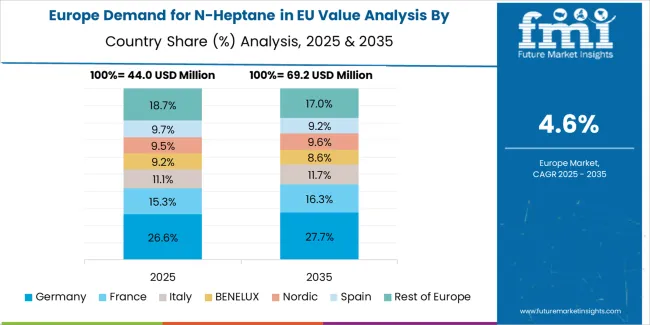
Demand For N Heptane In Eu Europe Country Market Share Analysis, 2025 & 2035

EU n-heptane sales are projected to grow from USD 174.3 million in 2025 to USD 289.4 million by 2035, registering a CAGR of 5.2% over the forecast period. The Netherlands is expected to demonstrate the strongest growth trajectory with a 5.4% CAGR, supported by pharmaceutical manufacturing concentration, chemical industry infrastructure, and strategic distribution hub position. France and Spain follow with 5.3% CAGR each, attributed to pharmaceutical production and growing electronics manufacturing.

Germany, while maintaining the largest share at 28.9% in 2025, is expected to grow at a 5.1% CAGR, reflecting industry maturity and established pharmaceutical and chemical infrastructure. Italy and Rest of Europe demonstrate 5.2% and 5.1% CAGR respectively, supported by diversified industrial consumption and steady pharmaceutical applications.
Competitive Landscape

Demand For N Heptane In Eu Analysis By Company

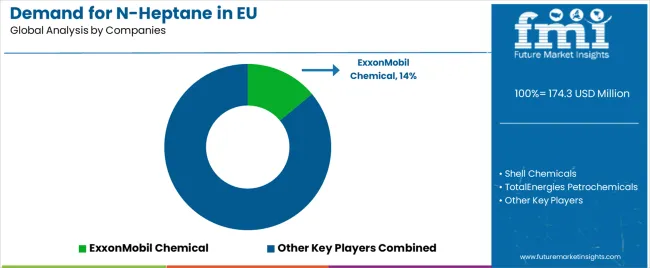
EU n-heptane sales are defined by competition among integrated petrochemical producers, specialized solvent manufacturers, and chemical distributors. Companies are investing in purification technology improvements, quality management systems, regulatory compliance support, and customer technical service to deliver high-purity, consistent-quality, and specification-compliant n-heptane solutions. Strategic relationships with pharmaceutical manufacturers, long-term supply agreements, and comprehensive quality documentation are central to strengthening competitive position.

Major participants include ExxonMobil Chemical with an estimated 14% share, leveraging its comprehensive petrochemical production infrastructure, pharmaceutical-grade solvent capabilities, and extensive European distribution networks. ExxonMobil benefits from integrated refining operations providing feedstock security, advanced purification capabilities producing ultra-high-purity grades, and the ability to provide technical support services helping customers optimize solvent selection and handling procedures.

Shell Chemicals holds approximately 12.0% share, emphasizing strong Western European production presence, established industrial solvent portfolio, and comprehensive customer relationships across pharmaceutical and industrial sectors. Shell's success in maintaining consistent product quality and providing reliable supply creates solid positioning across diverse applications, supported by technical service capabilities and quality assurance programs.

TotalEnergies Petrochemicals accounts for roughly 8.0% share through its position as an integrated European refiner and petrochemical producer, emphasizing regional production facilities, comprehensive solvent portfolio, and established distribution networks serving multiple industries. The company benefits from integrated European operations, diverse product offerings enabling cross-selling opportunities, and technical expertise supporting customer application requirements.

Other companies and regional distributors collectively hold 66.0% share, reflecting substantial fragmentation in European n-heptane sales, where numerous chemical distributors, regional solvent producers, specialty chemical companies, and pharmaceutical ingredient suppliers serve specific geographic industries, particular purity requirements, and individual customer relationships. This fragmentation provides opportunities for differentiation through specialized purity grades (pharmaceutical, electronics), comprehensive quality documentation supporting regulatory compliance, regional supply reliability, and technical service excellence resonating with pharmaceutical and electronics customers seeking suppliers offering guaranteed specifications and comprehensive support.

Key Players

  • ExxonMobil Chemical
  • Shell Chemicals
  • TotalEnergies Petrochemicals
  • Regional solvent producers and chemical distributors

Scope of the Report

Item Value
Quantitative Units USD 289.4 million
Purity (Grade) >99% Purity, 95-99% Purity, <95% Purity
Application (End Use) Pharmaceuticals, Electronics, Adhesives & Sealants, Paints & Coatings, Plastics & Polymers, Others
Forecast Period 2025 to 2035
Base Year 2025
Historical Data 2020 to 2024
Countries Covered Germany, France, Italy, Spain, the Netherlands, and the Rest of Europe
Key Companies Profiled ExxonMobil Chemical, Shell Chemicals, TotalEnergies Petrochemicals, Regional producers
Report Pages 180+ Pages
Data Tables 50+ Tables and Figures
Additional Attributes Dollar sales by purity (grade) and application (end use); regional demand trends across major European industries; competitive landscape analysis with integrated petrochemical producers and specialized solvent manufacturers; customer preferences for various purity grades and quality specifications; integration with pharmaceutical manufacturing operations and electronics cleaning processes; innovations in purification technologies and quality control systems; adoption across pharmaceutical synthesis, electronics manufacturing, and industrial solvent sectors; regulatory framework analysis for pharmaceutical solvent specifications and VOC emission standards; supply chain strategies including long-term supply agreements and qualified supplier programs; and penetration analysis for pharmaceutical-grade applications and ultra-high-purity specialty industries.

Key Segments

Purity (Grade):

  • 99% Purity
  • 95-99% Purity
  • <95% Purity

Application (End Use):

  • Pharmaceuticals
  • Electronics
  • Adhesives & Sealants
  • Paints & Coatings
  • Plastics & Polymers
  • Others

Countries:

  • Germany
  • France
  • Italy
  • Spain
  • Netherlands
  • Rest of Europe

Frequently Asked Questions

How big is the demand for n-heptane in eu in 2025?

The global demand for n-heptane in eu is estimated to be valued at USD 174.3 million in 2025.

What will be the size of demand for n-heptane in eu in 2035?

The market size for the demand for n-heptane in eu is projected to reach USD 289.4 million by 2035.

How much will be the demand for n-heptane in eu growth between 2025 and 2035?

The demand for n-heptane in eu is expected to grow at a 5.2% CAGR between 2025 and 2035.

What are the key product types in the demand for n-heptane in eu?

The key product types in demand for n-heptane in eu are 99% purity, 95-99% purity and <95% purity.

Which application (end use) segment to contribute significant share in the demand for n-heptane in eu in 2025?

In terms of application (end use), pharmaceuticals segment to command 33.0% share in the demand for n-heptane in eu in 2025.

Table of Content

  1. Executive Summary
    • Global Market Outlook
    • Demand to side Trends
    • Supply to side Trends
    • Technology Roadmap Analysis
    • Analysis and Recommendations
  2. Market Overview
    • Market Coverage / Taxonomy
    • Market Definition / Scope / Limitations
  3. Market Background
    • Market Dynamics
      • Drivers
      • Restraints
      • Opportunity
      • Trends
    • Scenario Forecast
      • Demand in Optimistic Scenario
      • Demand in Likely Scenario
      • Demand in Conservative Scenario
    • Opportunity Map Analysis
    • Product Life Cycle Analysis
    • Supply Chain Analysis
    • Investment Feasibility Matrix
    • Value Chain Analysis
    • PESTLE and Porter’s Analysis
    • Regulatory Landscape
    • Regional Parent Market Outlook
    • Production and Consumption Statistics
    • Import and Export Statistics
  4. Global Market Analysis 2020 to 2024 and Forecast, 2025 to 2035
    • Historical Market Size Value (USD Million) Analysis, 2020 to 2024
    • Current and Future Market Size Value (USD Million) Projections, 2025 to 2035
      • Y to o to Y Growth Trend Analysis
      • Absolute $ Opportunity Analysis
  5. Global Market Pricing Analysis 2020 to 2024 and Forecast 2025 to 2035
  6. Global Market Analysis 2020 to 2024 and Forecast 2025 to 2035, By Purity (Grade)
    • Introduction / Key Findings
    • Historical Market Size Value (USD Million) Analysis By Purity (Grade) , 2020 to 2024
    • Current and Future Market Size Value (USD Million) Analysis and Forecast By Purity (Grade) , 2025 to 2035
      • 99% Purity
      • 95-99% Purity
      • <95% Purity
    • Y to o to Y Growth Trend Analysis By Purity (Grade) , 2020 to 2024
    • Absolute $ Opportunity Analysis By Purity (Grade) , 2025 to 2035
  7. Global Market Analysis 2020 to 2024 and Forecast 2025 to 2035, By Application (End Use)
    • Introduction / Key Findings
    • Historical Market Size Value (USD Million) Analysis By Application (End Use), 2020 to 2024
    • Current and Future Market Size Value (USD Million) Analysis and Forecast By Application (End Use), 2025 to 2035
      • Pharmaceuticals
      • Electronics
      • Adhesives & Sealants
      • Paints & Coatings
      • Plastics & Polymers
      • Others
    • Y to o to Y Growth Trend Analysis By Application (End Use), 2020 to 2024
    • Absolute $ Opportunity Analysis By Application (End Use), 2025 to 2035
  8. Global Market Analysis 2020 to 2024 and Forecast 2025 to 2035, By Region
    • Introduction
    • Historical Market Size Value (USD Million) Analysis By Region, 2020 to 2024
    • Current Market Size Value (USD Million) Analysis and Forecast By Region, 2025 to 2035
      • North America
      • Latin America
      • Western Europe
      • Eastern Europe
      • East Asia
      • South Asia and Pacific
      • Middle East & Africa
    • Market Attractiveness Analysis By Region
  9. North America Market Analysis 2020 to 2024 and Forecast 2025 to 2035, By Country
    • Historical Market Size Value (USD Million) Trend Analysis By Market Taxonomy, 2020 to 2024
    • Market Size Value (USD Million) Forecast By Market Taxonomy, 2025 to 2035
      • By Country
        • USA
        • Canada
        • Mexico
      • By Purity (Grade)
      • By Application (End Use)
    • Market Attractiveness Analysis
      • By Country
      • By Purity (Grade)
      • By Application (End Use)
    • Key Takeaways
  10. Latin America Market Analysis 2020 to 2024 and Forecast 2025 to 2035, By Country
    • Historical Market Size Value (USD Million) Trend Analysis By Market Taxonomy, 2020 to 2024
    • Market Size Value (USD Million) Forecast By Market Taxonomy, 2025 to 2035
      • By Country
        • Brazil
        • Chile
        • Rest of Latin America
      • By Purity (Grade)
      • By Application (End Use)
    • Market Attractiveness Analysis
      • By Country
      • By Purity (Grade)
      • By Application (End Use)
    • Key Takeaways
  11. Western Europe Market Analysis 2020 to 2024 and Forecast 2025 to 2035, By Country
    • Historical Market Size Value (USD Million) Trend Analysis By Market Taxonomy, 2020 to 2024
    • Market Size Value (USD Million) Forecast By Market Taxonomy, 2025 to 2035
      • By Country
        • Germany
        • UK
        • Italy
        • Spain
        • France
        • Nordic
        • BENELUX
        • Rest of Western Europe
      • By Purity (Grade)
      • By Application (End Use)
    • Market Attractiveness Analysis
      • By Country
      • By Purity (Grade)
      • By Application (End Use)
    • Key Takeaways
  12. Eastern Europe Market Analysis 2020 to 2024 and Forecast 2025 to 2035, By Country
    • Historical Market Size Value (USD Million) Trend Analysis By Market Taxonomy, 2020 to 2024
    • Market Size Value (USD Million) Forecast By Market Taxonomy, 2025 to 2035
      • By Country
        • Russia
        • Poland
        • Hungary
        • Balkan & Baltic
        • Rest of Eastern Europe
      • By Purity (Grade)
      • By Application (End Use)
    • Market Attractiveness Analysis
      • By Country
      • By Purity (Grade)
      • By Application (End Use)
    • Key Takeaways
  13. East Asia Market Analysis 2020 to 2024 and Forecast 2025 to 2035, By Country
    • Historical Market Size Value (USD Million) Trend Analysis By Market Taxonomy, 2020 to 2024
    • Market Size Value (USD Million) Forecast By Market Taxonomy, 2025 to 2035
      • By Country
        • China
        • Japan
        • South Korea
      • By Purity (Grade)
      • By Application (End Use)
    • Market Attractiveness Analysis
      • By Country
      • By Purity (Grade)
      • By Application (End Use)
    • Key Takeaways
  14. South Asia and Pacific Market Analysis 2020 to 2024 and Forecast 2025 to 2035, By Country
    • Historical Market Size Value (USD Million) Trend Analysis By Market Taxonomy, 2020 to 2024
    • Market Size Value (USD Million) Forecast By Market Taxonomy, 2025 to 2035
      • By Country
        • India
        • ASEAN
        • Australia & New Zealand
        • Rest of South Asia and Pacific
      • By Purity (Grade)
      • By Application (End Use)
    • Market Attractiveness Analysis
      • By Country
      • By Purity (Grade)
      • By Application (End Use)
    • Key Takeaways
  15. Middle East & Africa Market Analysis 2020 to 2024 and Forecast 2025 to 2035, By Country
    • Historical Market Size Value (USD Million) Trend Analysis By Market Taxonomy, 2020 to 2024
    • Market Size Value (USD Million) Forecast By Market Taxonomy, 2025 to 2035
      • By Country
        • Kingdom of Saudi Arabia
        • Other GCC Countries
        • Turkiye
        • South Africa
        • Other African Union
        • Rest of Middle East & Africa
      • By Purity (Grade)
      • By Application (End Use)
    • Market Attractiveness Analysis
      • By Country
      • By Purity (Grade)
      • By Application (End Use)
    • Key Takeaways
  16. Key Countries Market Analysis
    • USA
      • Pricing Analysis
      • Market Share Analysis, 2024
        • By Purity (Grade)
        • By Application (End Use)
    • Canada
      • Pricing Analysis
      • Market Share Analysis, 2024
        • By Purity (Grade)
        • By Application (End Use)
    • Mexico
      • Pricing Analysis
      • Market Share Analysis, 2024
        • By Purity (Grade)
        • By Application (End Use)
    • Brazil
      • Pricing Analysis
      • Market Share Analysis, 2024
        • By Purity (Grade)
        • By Application (End Use)
    • Chile
      • Pricing Analysis
      • Market Share Analysis, 2024
        • By Purity (Grade)
        • By Application (End Use)
    • Germany
      • Pricing Analysis
      • Market Share Analysis, 2024
        • By Purity (Grade)
        • By Application (End Use)
    • UK
      • Pricing Analysis
      • Market Share Analysis, 2024
        • By Purity (Grade)
        • By Application (End Use)
    • Italy
      • Pricing Analysis
      • Market Share Analysis, 2024
        • By Purity (Grade)
        • By Application (End Use)
    • Spain
      • Pricing Analysis
      • Market Share Analysis, 2024
        • By Purity (Grade)
        • By Application (End Use)
    • France
      • Pricing Analysis
      • Market Share Analysis, 2024
        • By Purity (Grade)
        • By Application (End Use)
    • India
      • Pricing Analysis
      • Market Share Analysis, 2024
        • By Purity (Grade)
        • By Application (End Use)
    • ASEAN
      • Pricing Analysis
      • Market Share Analysis, 2024
        • By Purity (Grade)
        • By Application (End Use)
    • Australia & New Zealand
      • Pricing Analysis
      • Market Share Analysis, 2024
        • By Purity (Grade)
        • By Application (End Use)
    • China
      • Pricing Analysis
      • Market Share Analysis, 2024
        • By Purity (Grade)
        • By Application (End Use)
    • Japan
      • Pricing Analysis
      • Market Share Analysis, 2024
        • By Purity (Grade)
        • By Application (End Use)
    • South Korea
      • Pricing Analysis
      • Market Share Analysis, 2024
        • By Purity (Grade)
        • By Application (End Use)
    • Russia
      • Pricing Analysis
      • Market Share Analysis, 2024
        • By Purity (Grade)
        • By Application (End Use)
    • Poland
      • Pricing Analysis
      • Market Share Analysis, 2024
        • By Purity (Grade)
        • By Application (End Use)
    • Hungary
      • Pricing Analysis
      • Market Share Analysis, 2024
        • By Purity (Grade)
        • By Application (End Use)
    • Kingdom of Saudi Arabia
      • Pricing Analysis
      • Market Share Analysis, 2024
        • By Purity (Grade)
        • By Application (End Use)
    • Turkiye
      • Pricing Analysis
      • Market Share Analysis, 2024
        • By Purity (Grade)
        • By Application (End Use)
    • South Africa
      • Pricing Analysis
      • Market Share Analysis, 2024
        • By Purity (Grade)
        • By Application (End Use)
  17. Market Structure Analysis
    • Competition Dashboard
    • Competition Benchmarking
    • Market Share Analysis of Top Players
      • By Regional
      • By Purity (Grade)
      • By Application (End Use)
  18. Competition Analysis
    • Competition Deep Dive
      • ExxonMobil Chemical
        • Overview
        • Product Portfolio
        • Profitability by Market Segments (Product/Age /Sales Channel/Region)
        • Sales Footprint
        • Strategy Overview
          • Marketing Strategy
          • Product Strategy
          • Channel Strategy
      • Shell Chemicals
      • TotalEnergies Petrochemicals
      • Regional solvent producers and chemical distributors
  19. Assumptions & Acronyms Used
  20. Research Methodology

List of Tables

  • Table 1: Global Market Value (USD Million) Forecast by Region, 2020 to 2035
  • Table 2: Global Market Value (USD Million) Forecast by Purity (Grade) , 2020 to 2035
  • Table 3: Global Market Value (USD Million) Forecast by Application (End Use), 2020 to 2035
  • Table 4: North America Market Value (USD Million) Forecast by Country, 2020 to 2035
  • Table 5: North America Market Value (USD Million) Forecast by Purity (Grade) , 2020 to 2035
  • Table 6: North America Market Value (USD Million) Forecast by Application (End Use), 2020 to 2035
  • Table 7: Latin America Market Value (USD Million) Forecast by Country, 2020 to 2035
  • Table 8: Latin America Market Value (USD Million) Forecast by Purity (Grade) , 2020 to 2035
  • Table 9: Latin America Market Value (USD Million) Forecast by Application (End Use), 2020 to 2035
  • Table 10: Western Europe Market Value (USD Million) Forecast by Country, 2020 to 2035
  • Table 11: Western Europe Market Value (USD Million) Forecast by Purity (Grade) , 2020 to 2035
  • Table 12: Western Europe Market Value (USD Million) Forecast by Application (End Use), 2020 to 2035
  • Table 13: Eastern Europe Market Value (USD Million) Forecast by Country, 2020 to 2035
  • Table 14: Eastern Europe Market Value (USD Million) Forecast by Purity (Grade) , 2020 to 2035
  • Table 15: Eastern Europe Market Value (USD Million) Forecast by Application (End Use), 2020 to 2035
  • Table 16: East Asia Market Value (USD Million) Forecast by Country, 2020 to 2035
  • Table 17: East Asia Market Value (USD Million) Forecast by Purity (Grade) , 2020 to 2035
  • Table 18: East Asia Market Value (USD Million) Forecast by Application (End Use), 2020 to 2035
  • Table 19: South Asia and Pacific Market Value (USD Million) Forecast by Country, 2020 to 2035
  • Table 20: South Asia and Pacific Market Value (USD Million) Forecast by Purity (Grade) , 2020 to 2035
  • Table 21: South Asia and Pacific Market Value (USD Million) Forecast by Application (End Use), 2020 to 2035
  • Table 22: Middle East & Africa Market Value (USD Million) Forecast by Country, 2020 to 2035
  • Table 23: Middle East & Africa Market Value (USD Million) Forecast by Purity (Grade) , 2020 to 2035
  • Table 24: Middle East & Africa Market Value (USD Million) Forecast by Application (End Use), 2020 to 2035

List of Figures

  • Figure 1: Global Market Pricing Analysis
  • Figure 2: Global Market Value (USD Million) Forecast 2020-2035
  • Figure 3: Global Market Value Share and BPS Analysis by Purity (Grade) , 2025 and 2035
  • Figure 4: Global Market Y to o to Y Growth Comparison by Purity (Grade) , 2025-2035
  • Figure 5: Global Market Attractiveness Analysis by Purity (Grade)
  • Figure 6: Global Market Value Share and BPS Analysis by Application (End Use), 2025 and 2035
  • Figure 7: Global Market Y to o to Y Growth Comparison by Application (End Use), 2025-2035
  • Figure 8: Global Market Attractiveness Analysis by Application (End Use)
  • Figure 9: Global Market Value (USD Million) Share and BPS Analysis by Region, 2025 and 2035
  • Figure 10: Global Market Y to o to Y Growth Comparison by Region, 2025-2035
  • Figure 11: Global Market Attractiveness Analysis by Region
  • Figure 12: North America Market Incremental Dollar Opportunity, 2025-2035
  • Figure 13: Latin America Market Incremental Dollar Opportunity, 2025-2035
  • Figure 14: Western Europe Market Incremental Dollar Opportunity, 2025-2035
  • Figure 15: Eastern Europe Market Incremental Dollar Opportunity, 2025-2035
  • Figure 16: East Asia Market Incremental Dollar Opportunity, 2025-2035
  • Figure 17: South Asia and Pacific Market Incremental Dollar Opportunity, 2025-2035
  • Figure 18: Middle East & Africa Market Incremental Dollar Opportunity, 2025-2035
  • Figure 19: North America Market Value Share and BPS Analysis by Country, 2025 and 2035
  • Figure 20: North America Market Value Share and BPS Analysis by Purity (Grade) , 2025 and 2035
  • Figure 21: North America Market Y to o to Y Growth Comparison by Purity (Grade) , 2025-2035
  • Figure 22: North America Market Attractiveness Analysis by Purity (Grade)
  • Figure 23: North America Market Value Share and BPS Analysis by Application (End Use), 2025 and 2035
  • Figure 24: North America Market Y to o to Y Growth Comparison by Application (End Use), 2025-2035
  • Figure 25: North America Market Attractiveness Analysis by Application (End Use)
  • Figure 26: Latin America Market Value Share and BPS Analysis by Country, 2025 and 2035
  • Figure 27: Latin America Market Value Share and BPS Analysis by Purity (Grade) , 2025 and 2035
  • Figure 28: Latin America Market Y to o to Y Growth Comparison by Purity (Grade) , 2025-2035
  • Figure 29: Latin America Market Attractiveness Analysis by Purity (Grade)
  • Figure 30: Latin America Market Value Share and BPS Analysis by Application (End Use), 2025 and 2035
  • Figure 31: Latin America Market Y to o to Y Growth Comparison by Application (End Use), 2025-2035
  • Figure 32: Latin America Market Attractiveness Analysis by Application (End Use)
  • Figure 33: Western Europe Market Value Share and BPS Analysis by Country, 2025 and 2035
  • Figure 34: Western Europe Market Value Share and BPS Analysis by Purity (Grade) , 2025 and 2035
  • Figure 35: Western Europe Market Y to o to Y Growth Comparison by Purity (Grade) , 2025-2035
  • Figure 36: Western Europe Market Attractiveness Analysis by Purity (Grade)
  • Figure 37: Western Europe Market Value Share and BPS Analysis by Application (End Use), 2025 and 2035
  • Figure 38: Western Europe Market Y to o to Y Growth Comparison by Application (End Use), 2025-2035
  • Figure 39: Western Europe Market Attractiveness Analysis by Application (End Use)
  • Figure 40: Eastern Europe Market Value Share and BPS Analysis by Country, 2025 and 2035
  • Figure 41: Eastern Europe Market Value Share and BPS Analysis by Purity (Grade) , 2025 and 2035
  • Figure 42: Eastern Europe Market Y to o to Y Growth Comparison by Purity (Grade) , 2025-2035
  • Figure 43: Eastern Europe Market Attractiveness Analysis by Purity (Grade)
  • Figure 44: Eastern Europe Market Value Share and BPS Analysis by Application (End Use), 2025 and 2035
  • Figure 45: Eastern Europe Market Y to o to Y Growth Comparison by Application (End Use), 2025-2035
  • Figure 46: Eastern Europe Market Attractiveness Analysis by Application (End Use)
  • Figure 47: East Asia Market Value Share and BPS Analysis by Country, 2025 and 2035
  • Figure 48: East Asia Market Value Share and BPS Analysis by Purity (Grade) , 2025 and 2035
  • Figure 49: East Asia Market Y to o to Y Growth Comparison by Purity (Grade) , 2025-2035
  • Figure 50: East Asia Market Attractiveness Analysis by Purity (Grade)
  • Figure 51: East Asia Market Value Share and BPS Analysis by Application (End Use), 2025 and 2035
  • Figure 52: East Asia Market Y to o to Y Growth Comparison by Application (End Use), 2025-2035
  • Figure 53: East Asia Market Attractiveness Analysis by Application (End Use)
  • Figure 54: South Asia and Pacific Market Value Share and BPS Analysis by Country, 2025 and 2035
  • Figure 55: South Asia and Pacific Market Value Share and BPS Analysis by Purity (Grade) , 2025 and 2035
  • Figure 56: South Asia and Pacific Market Y to o to Y Growth Comparison by Purity (Grade) , 2025-2035
  • Figure 57: South Asia and Pacific Market Attractiveness Analysis by Purity (Grade)
  • Figure 58: South Asia and Pacific Market Value Share and BPS Analysis by Application (End Use), 2025 and 2035
  • Figure 59: South Asia and Pacific Market Y to o to Y Growth Comparison by Application (End Use), 2025-2035
  • Figure 60: South Asia and Pacific Market Attractiveness Analysis by Application (End Use)
  • Figure 61: Middle East & Africa Market Value Share and BPS Analysis by Country, 2025 and 2035
  • Figure 62: Middle East & Africa Market Value Share and BPS Analysis by Purity (Grade) , 2025 and 2035
  • Figure 63: Middle East & Africa Market Y to o to Y Growth Comparison by Purity (Grade) , 2025-2035
  • Figure 64: Middle East & Africa Market Attractiveness Analysis by Purity (Grade)
  • Figure 65: Middle East & Africa Market Value Share and BPS Analysis by Application (End Use), 2025 and 2035
  • Figure 66: Middle East & Africa Market Y to o to Y Growth Comparison by Application (End Use), 2025-2035
  • Figure 67: Middle East & Africa Market Attractiveness Analysis by Application (End Use)
  • Figure 68: Global Market - Tier Structure Analysis
  • Figure 69: Global Market - Company Share Analysis
Dashboard
Dashboard
Dashboard
Dashboard
Dashboard
Dashboard

Full Research Suite comprises of:

Market outlook & trends analysis

Market outlook & trends analysis

Interviews & case studies

Interviews & case studies

Strategic recommendations

Strategic recommendations

Vendor profiles & capabilities analysis

Vendor profiles & capabilities analysis

5-year forecasts

5-year forecasts

8 regions and 60+ country-level data splits

8 regions and 60+ country-level data splits

Market segment data splits

Market segment data splits

12 months of continuous data updates

12 months of continuous data updates

DELIVERED AS:

PDF EXCEL ONLINE

Full Research Suite


$5000

$7500

$10000

Buy Report Now
Similar Industry Reports

Similar Industry Reports

Demand Signal Repository Solutions Market

Demand Signal Repository Solutions Market Size and Share Forecast Outlook 2025 to 2035

Demand Side Management Market

Demand Side Management Market Size and Share Forecast Outlook 2025 to 2035

Demand Response Market

Demand Response Market Analysis - Size, Share, and Forecast Outlook 2025 to 2035

Demand Analysis of Shipping Supplies in North America

North America Shipping Supplies Market Trends – Innovations & Growth 2024-2034

Demand of Kozani Saffron in Greece

Demand of Kozani Saffron in Greece Analysis - Size, Share & Forecast 2025 to 2035

Demand of No-acid Whey Strained Dairy Processing Concepts

Demand of No-acid Whey Strained Dairy Processing Concepts in European Union Size and Share Forecast Outlook 2025 to 2035

Demand of Bronte Pistachio in Italy

Demand for Bronte Pistachio in Italy Analysis - Size, Share & Forecast 2025 to 2035

Demand and Trend Analysis of Gaming Monitor in Japan

Demand and Trend Analysis of Gaming Monitor in Japan Size and Share Forecast Outlook 2025 to 2035

Demand and Trend Analysis of Gaming Monitor in Korea

Demand and Trend Analysis of Gaming Monitor in Korea Size and Share Forecast Outlook 2025 to 2035

Demand and Trend Analysis of Gaming Monitor in Western Europe

Demand and Trend Analysis of Gaming Monitor in Western Europe Size and Share Forecast Outlook 2025 to 2035

Demand and Trend Analysis of Glycine Soja (Soybean) Seed Extract Market

Glycine Soja (Soybean) Seed Extract Market Size and Share Forecast Outlook 2025 to 2035

Demand and Trend Analysis of Yeast in Japan

Demand and Trend Analysis of Yeast in Japan - Size, Share, and Forecast Outlook 2025 to 2035

Demand and Trends Analysis of Stevia in Japan

Demand and Trends Analysis of Stevia in Japan Size and Share Forecast Outlook 2025 to 2035

Demand of Pistachio-based desserts & ingredients in France

Demand of Pistachio-based desserts & ingredients in France Analysis - Size, Share & Forecast 2025 to 2035

Demand and Trend Analysis of Women’s Intimate Care Product in Japan

Japan Women’s Intimate Care Market Trends – Growth & Forecast 2024-2034

Demand and Trend Analysis of Men’s Skincare Product in Western Europe

Western Europe Men’s Skincare Market Analysis – Forecast 2023-2033

Demand and Trend Analysis of Fabric Stain Remover in Korea

Demand and Trend Analysis of Fabric Stain Remover in Korea Size and Share Forecast Outlook 2025 to 2035

Demand and Sales Analysis of Paper Cup in Japan

Demand and Sales Analysis of Paper Cup in Japan Size and Share Forecast Outlook 2025 to 2035

Demand and Sales Analysis of Paper Cup in Korea

Demand and Sales Analysis of Paper Cup in Korea Size and Share Forecast Outlook 2025 to 2035

Demand of MFGM-enriched Powders & RTDs in European Union

Demand of MFGM-enriched Powders & RTDs in European Union Size and Share Forecast Outlook 2025 to 2035

Future Market Insights

Demand for N-Heptane in EU

Chat With MaRIA

Chat With

MaRIA

Hi There, I am MaRIA, Your Market Research Intelligence Assistant. How may I help you?