The European Union pea fiber industry is projected to expand from USD 720.0 million in 2025 to approximately USD 1,172.8 million by 2035, advancing at a CAGR close to 5.0%. This trajectory highlights the growing importance of plant-based ingredients in food, beverage, and nutraceutical applications. Pea fiber is increasingly recognized as a versatile ingredient offering functional benefits such as improved digestive health, enhanced texture, and reduced caloric density. The rising popularity of plant-based diets across Europe has positioned pea fiber as a preferred choice in reformulated bakery goods, ready-to-eat meals, and protein-rich beverages, where demand for clean-label and naturally sourced ingredients continues to rise.
Sales of pea fiber in the European Union are expected to increase by USD 440.0 million between 2025 and 2035, rising from USD 720.0 million to USD 1,172.8 million. This absolute growth translates into a total increase of around 61.1% over the assessment period, with the market set to grow by approximately 1.63X. The expansion is strongly supported by food manufacturers investing in alternative ingredients that align with consumer preferences for high-fiber diets and reduced reliance on synthetic additives. Government-backed dietary recommendations encouraging fiber intake have further reinforced the adoption of pea fiber as an attractive solution for product developers seeking to meet nutritional targets while enhancing product differentiation.
Health-conscious consumers in the EU are driving consistent demand, particularly in the bakery, snacks, and breakfast cereal categories. Pea fiber improves dough stability, enhances moisture retention, and provides a neutral taste profile that fits seamlessly into a range of applications. Its functional versatility extends into beverages, where it adds mouthfeel and stability without altering flavor, making it appealing for protein shakes, smoothies, and plant-based dairy alternatives. Beyond food, the pet food and animal nutrition sectors are emerging growth contributors, as pea fiber is being incorporated into premium formulations to support digestive health and nutrient absorption in companion animals.
Geographically, Western Europe leads adoption, with countries such as Germany, France, and the United Kingdom at the forefront due to advanced food processing industries and a strong consumer base for plant-based nutrition. Southern Europe, particularly Spain and Italy, is witnessing rising utilization of pea fiber in bakery and pasta applications, while Eastern European markets are gradually adopting it through investments in food manufacturing facilities and rising consumer awareness about gut health. The increasing penetration of pea-derived ingredients is also linked to the European Union’s broader focus on reducing reliance on soy and wheat-based products, thereby diversifying plant protein and fiber sources. By 2030, adoption of pea fiber in both mainstream and specialty foods is projected to accelerate, driven by innovations in texture-modified products, gluten-free solutions, and dietary supplements. With manufacturers continuing to scale capacity and improve supply chain integration, the EU pea fiber industry is anticipated to remain a cornerstone of plant-based product development and functional food innovation during the forecast horizon.
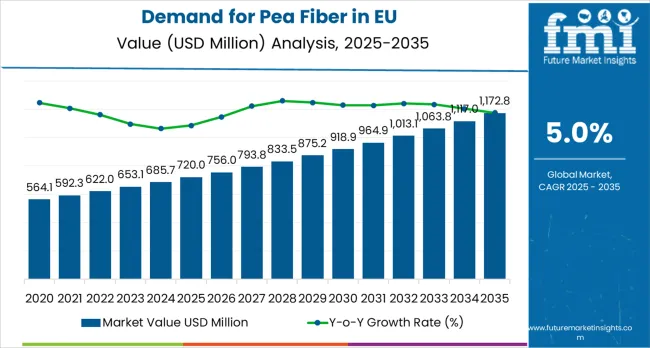
Between 2025 and 2030, the demand for pea fiber in EU is projected to expand from USD 720.0 million to USD 920.0 million, resulting in a value increase of USD 200.0 million, which represents 45.5% of the total forecast growth for the decade. This phase of growth will be shaped by accelerating clean-label food trends across European food manufacturing markets, increasing consumer awareness of dietary fiber benefits and digestive health applications, growing adoption of plant-based ingredient solutions for functional food development, and expansion of health food manufacturing infrastructure in Eastern European economies.
Manufacturers are developing innovative fiber formulations including enhanced functional properties, organic certifications, specialized processing techniques, and sustainable sourcing solutions to address evolving European consumer preferences for natural ingredients, health benefits, processing efficiency, and environmental responsibility.
From 2030 to 2035, the market is forecast to grow from USD 920.0 million to USD 1,172.8 million, adding another USD 240.0 million, which constitutes 54.5% of the overall ten-year expansion. This period is expected to be characterized by widespread adoption of specialty pea fiber ingredients across mainstream European food processing channels, integration of advanced processing technologies for enhanced functional properties, development of application-specific formulations targeting bakery and snack food markets, and expansion of premium organic and sustainable product segments.
The growing emphasis on digestive wellness in European dietary systems, increasing food technologist recommendations for plant-based fiber solutions, stringent EU regulations supporting food safety and ingredient transparency, and rising health consciousness across European consumer segments will drive sustained demand for functionally superior, naturally sourced, and sustainably produced pea fiber solutions.
Between 2020 and 2025, the demand for pea fiber in EU experienced steady expansion, driven by evolving health food trends that positioned pea fiber as essential ingredients for digestive wellness, functional food development, and clean-label product enhancement. The market developed as European food manufacturers and ingredient companies recognized functional opportunities in high-fiber, plant-based, and specialty pea fiber formats that appealed to health-conscious consumers and food technologists seeking optimal nutritional enhancement and ingredient transparency for their food applications.
Major multinational ingredient suppliers expanded processing capacity through strategic capital investments in European facilities, while regional players developed specialized processing techniques addressing specific functional requirements and clean-label standards across diverse national food markets within the European Union.
Market expansion is being supported by the fundamental shift in consumer attitudes toward digestive health and plant-based nutrition across European societies, with pea fiber increasingly regarded as essential functional ingredients deserving premium health benefits, natural processing methods, and overall nutritional value comparable to specialized health supplements while providing unique fiber and functional advantages.
Modern European consumers and food technologists consistently prioritize fiber functionality, digestive benefits, ingredient transparency, and sustainable sourcing when selecting fiber ingredients, driving demand for specialty pea fiber formulations that deliver superior health performance, naturally derived processing methods, exceptional digestive benefits, and clean-label certifications compared to synthetic fiber alternatives.
Even minor concerns about digestive health, nutritional adequacy, or ingredient transparency can drive comprehensive adoption of specialized premium pea fiber products designed to maintain optimal digestive wellness, support specific functional applications, and enhance overall nutritional satisfaction throughout all food manufacturing categories.
The growing complexity of functional food science and increasing awareness of fiber-specific health benefits are driving demand for scientifically validated pea fiber products from certified European manufacturers with appropriate food ingredient certifications, processing capabilities, technical expertise, and compliance with stringent EU food safety regulations.
Regulatory authorities across European Union member states are increasingly establishing comprehensive guidelines for fiber ingredient manufacturing, health claim accuracy, labeling requirements, and food safety protocols to ensure product effectiveness and consumer safety.
Scientific research studies and nutritional testing conducted at European food science research institutions are providing evidence supporting pea fiber interventions for common health challenges including digestive health enhancement, cholesterol management, blood sugar regulation, and overall wellness maintenance, requiring specialized processing expertise and food-grade production processes that meet EU food safety standards.
The market is segmented by product type, end-use, distribution channel, and sales region. By product type, the market is divided into pea hull fiber (including outer hull-derived fiber and insoluble fiber variants) and pea cell wall fiber (including inner cell wall fiber and soluble fiber components).
Based on end-use, the market is categorized into baked products (including breads, cakes, and pastries), breakfast cereals, meat products, pharmaceuticals, nutraceuticals, animal feed, snack foods, pasta, crackers, and other applications.
By distribution channel, the market spans specialty distributors (food ingredient suppliers, health ingredient distributors), direct sales, and online retail (B2B platforms, ingredient marketplaces). Regionally, the market covers Germany, France, Italy, Spain, BENELUX, and Rest of Europe.
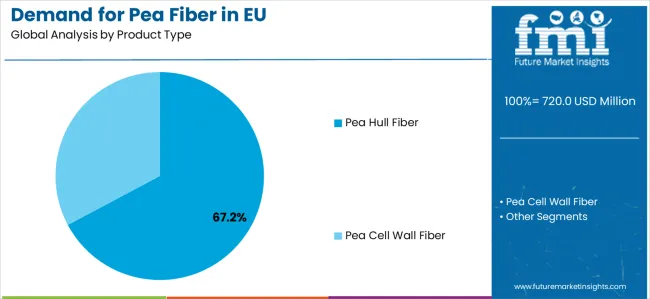
Pea hull fiber segment is projected to account for 67.2% of the demand for pea fiber in EU in 2025, establishing itself as the dominant product category across European food ingredient and processing facilities. This commanding market position is fundamentally supported by the widespread adoption of pea hull fiber for functional food applications, superior fiber content, and cost-effective processing characteristics that deliver exceptional nutritional density, optimal functional performance, and unparalleled ingredient versatility throughout large-scale commercial food operations across EU member states.
Pea hull fiber products provide European food manufacturers with unparalleled formulation flexibility, precise fiber control during manufacturing processes, enhanced nutritional profiles, and seamless integration with clean-label food processing techniques that comply with stringent EU food ingredient safety directives.
This product sophistication enables European ingredient processors to achieve optimal production economics while maintaining rigorous quality protocols mandated by European Food Safety Authority (EFSA) regulations, comprehensive traceability systems required under EU law, and consistent functional performance across millions of individual food processing applications produced annually.
The segment derives substantial competitive advantages from established European pea processing infrastructure offering specialized fiber extraction solutions, comprehensive technical support services, and continuous product innovation that incorporates advanced processing technologies, improved functional characteristics, and enhanced nutritional capabilities aligned with modern food ingredient standards.
The pea hull fiber systems deliver superior cost-effectiveness particularly important in competitive food ingredient markets, enhanced functional properties, improved manufacturing efficiency, and superior regulatory compliance with EU food ingredient manufacturing standards.
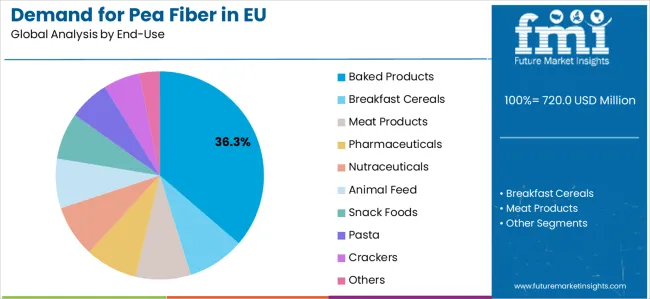
Baked products applications are positioned to represent 36.3% of total European pea fiber demand in 2025, reflecting the segment's dominant position within the overall market ecosystem and the substantially larger bakery industry consumption patterns compared to other end-use categories across most European countries.
This substantial market share directly demonstrates the exceptionally high adoption rates of fiber enhancement among European bakery manufacturers and the continuously expanding population of health-conscious baking operations across both Western and Eastern European markets.
Modern European bakery pea fiber applications are increasingly featuring sophisticated formulations that deliver enhanced nutritional profiles, improved texture characteristics, and specialized functional properties specifically designed to address common baking challenges including fiber fortification, moisture retention, shelf-life extension, and clean-label ingredient requirements.
European bakery manufacturers consistently demonstrate willingness to invest substantially in premium pea fiber that delivers visible nutritional benefits, supports optimal baking outcomes, complies with EU food safety standards, and provides consistent results for both large-scale commercial bakery production and artisanal baking operations.
Within the baked products segment, bread applications command 20% share, cakes represent 10%, and pastries account for 6.3%, reflecting comprehensive application segmentation strategies tailored to European bakery market preferences.
The demand for pea fiber in EU is advancing steadily due to intensifying health consciousness trends and growing recognition of dietary fiber benefits across EU member states. The market faces challenges including fluctuating pea commodity prices and supply chain constraints, complex regulatory requirements for health claims across diverse European jurisdictions, varying processing quality standards across different fiber extraction methods, competition from alternative plant fibers including oat and chicory alternatives, and varying food manufacturer awareness levels regarding pea fiber functionality despite growing clean-label trends.
Innovation initiatives, sustainable sourcing programs, processing enhancement solutions, and health positioning platforms continue to influence product development strategies and market evolution patterns across European food ingredient markets.
The rapidly accelerating adoption of clean-label principles and natural ingredient preferences is fundamentally enabling broader market acceptance across European countries, enhanced consumer trust among food buyers particularly regarding ingredient transparency and natural sourcing, and significantly improved product positioning through certified natural fiber applications.
Advanced clean-label platforms operated by specialized food ingredient organizations, professional food technologists, and major food manufacturers equipped with comprehensive ingredient documentation in multiple European languages, natural sourcing certifications, processing guides, and application recommendations provide extensive technical resources while dramatically expanding ingredient credibility across diverse food processing segments and geographic markets throughout the European Union.
These clean-label trends prove particularly valuable for pea fiber ingredients that require detailed ingredient transparency documentation, natural sourcing verification, and targeted food processing approaches to effectively communicate functional benefits and justify premium pricing positions across sophisticated European health-conscious food segments.
Clean-label adoption also enables sophisticated ingredient analytics, personalized formulation recommendations based on specific processing requirements and consumer preferences, direct food manufacturer feedback collection that informs product development, and natural ingredient models that ensure consumer acceptance while reducing synthetic ingredient dependency across fragmented European food markets.
Progressive European pea fiber manufacturers are systematically incorporating innovative functional food development including digestive health optimization, nutritional enhancement, bioactive compound integration, and wellness-focused formulation that address growing European food industry demands for health-promoting ingredients, functional food solutions, and enhanced nutritional profiles in processed food applications.
Strategic integration of these functional food approaches, combined with rigorous health benefit testing and validation protocols conducted at European nutrition research institutions, enables manufacturers to develop differentiated wellness propositions that appeal to health-conscious European food processors while maintaining essential functional characteristics and regulatory compliance.
These wellness initiatives also support the development of specialized formulations for specific health applications increasingly recognized across European markets, enhanced functional options for targeted wellness applications recommended by European nutritionists, and scientifically validated products that resonate with health-driven consumer segments particularly prevalent in Nordic and Western European countries.
Investment in functional food development facilities established in Netherlands and Germany, precision health research capabilities, and advanced pea fiber processing technologies enable European manufacturers to explore next-generation wellness ingredients while maintaining competitive positioning in premium and health-focused market segments.
European food manufacturers and pea fiber suppliers are increasingly prioritizing sustainable agriculture and circular economy principles when selecting pea fiber ingredients, driving fundamental changes in sourcing strategies across the European plant-based ingredient industry.
Companies are implementing comprehensive sustainable farming programs using regenerative agriculture practices, reducing environmental impact through circular processing technologies, and developing environmentally responsible supply chains that align with EU sustainability directives and corporate environmental responsibility regulations.
This trend is particularly pronounced across Nordic countries, Germany, Netherlands, and France where food manufacturers demonstrate exceptional environmental consciousness and willingness to invest in ingredients with verified sustainability credentials and environmental compliance documentation.
Manufacturers are responding by developing partnerships with certified sustainable pea growers, implementing circular processing programs, obtaining multiple sustainability certifications, including regenerative agriculture standards and circular economy validation, and providing comprehensive environmental impact information that differentiates their products in increasingly competitive European markets, emphasizing environmental responsibility and sustainable ingredient sourcing commitments.
The demand for pea fiber in EU is projected to grow from USD 720.0 million in 2025 to USD 1160 million by 2035, registering a CAGR of 5.0% over the forecast period. Germany is expected to maintain its leadership with a 24.0% share in 2025, supported by its expansive food processing infrastructure and strong tradition of functional ingredient innovation.
France follows with a 17.0% market share, attributed to growing demand for specialty food ingredients and clean-label applications. Italy contributes 12.0% of the market, driven by increasing adoption in bakery and pasta processing applications. Spain accounts for 9.5% of the market, while BENELUX represents 6.0%. The Rest of Europe region holds the remaining market share, encompassing Nordic countries, Eastern Europe, and other EU member states with emerging demand for pea fiber products.
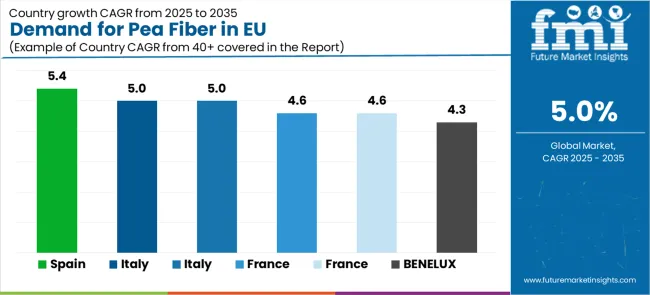
| Country/Region | CAGR (2025 to 2035) |
|---|---|
| Spain | 5.4% |
| Italy | 5.0% |
| Rest of Europe | 5.0% |
| France | 4.6% |
| Germany | 4.6% |
| BENELUX | 4.3% |
The demand for pea fiber in EU demonstrates consistent growth across major economies, with Spain leading at a 5.4% CAGR through 2035, driven by expanding food processing modernization and growing health ingredient adoption. Italy and Rest of Europe follow at 5.0%, supported by bakery industry development and functional food innovation. France and Germany grow at 4.6%, integrating pea fiber into advanced food processing practices and clean-label formulations. BENELUX shows steady growth at 4.3%, focusing on premium ingredient applications. Overall, Germany maintains its leadership position while Southern European countries demonstrate stronger growth momentum.
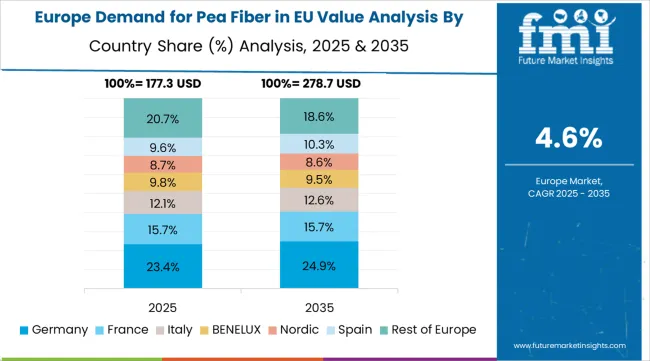
The demand for pea fiber in Germany is projected to exhibit steady growth with a CAGR of 4.6% through 2035, driven by exceptionally strong food processing tradition and ingredient innovation infrastructure, comprehensively well-established distribution networks for specialty food ingredients and processing materials, and sophisticated regulatory frameworks supporting functional ingredient quality standards throughout the country.
Germany's advanced food ingredient regulations and internationally recognized processing standards through organizations including German Food Technology Association are creating substantial demand for certified premium pea fiber across diverse professional and industrial food segments. Major food processing companies including German ingredient manufacturers, specialized fiber processors including industrial food companies, and professional distribution networks are systematically establishing extensive ingredient portfolios serving both large-scale food manufacturers and specialty processors throughout German production centers, manufacturing areas, and research communities.
The German market benefits from exceptionally high food processing technology standards, substantial ingredient manufacturing industry presence, strong supply chain programs delivering quality at competitive pricing, and industrial emphasis on functional excellence that naturally support premium pea fiber adoption.
The demand for pea fiber in France is expanding at a steady CAGR of 4.6%, substantially supported by increasing French food industry preference for specialty ingredients and clean-label applications, growing awareness of functional ingredient benefits, and sophisticated appreciation for ingredient quality excellence reflecting French food culture.
France's well-established food processing tradition and premium positioning strategies across ingredient sectors are systematically driving demand for high-quality pea fiber across diverse food processing and specialty ingredient segments.
Specialized ingredient suppliers including French food manufacturers, traditional ingredient processing firms, major food distributors (food industry groups), and professional ingredient supply networks are establishing comprehensive ingredient ranges featuring premium imported and French-processed pea fiber emphasizing quality and functional performance.
The French market particularly benefits from strong cultural emphasis on food quality traditions, ingredient processing techniques, and traditional methods that align perfectly with pea fiber positioning as essential quality components for superior food processing results.
The demand for pea fiber in Italy is growing at a strong CAGR of 5.0%, fundamentally driven by increasing integration of pea fiber into traditional Italian food processing patterns, growing recognition of functional ingredient benefits for bakery and pasta applications, and strong Italian cultural appreciation for authentic ingredient solutions and traditional food production values. Italy's deeply established food culture is systematically incorporating specialty pea fiber to enhance traditional recipes, improve nutritional profiles, and modernize classic Italian food processing approaches while maintaining authentic regional food characteristics.
Professional food manufacturers, specialized ingredient distributors including Italian suppliers, leading food retailers (major Italian food groups), and traditional ingredient suppliers are strategically investing in ingredient programs and technical demonstrations addressing growing Italian interest in functional pea fiber solutions. The Italian market particularly benefits from strong cultural appreciation for ingredient authenticity, traditional food production approaches reflecting established Italian culinary traditions, and growing food processing capacity particularly in Northern Italian regions supporting premium ingredient adoption.
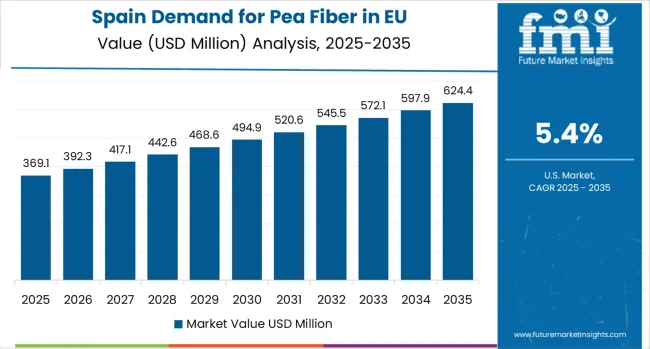
Demand for pea fiber in Spain is projected to grow at a strong CAGR of 5.4%, substantially supported by rapidly expanding food processing sector that actively promotes functional ingredient applications, increasing Spanish food industry awareness of health ingredient benefits, and growing food manufacturing consciousness particularly in major industrial areas including Catalonia, Valencia, Andalusia, and Madrid regions. Spanish food processing sector is experiencing significant modernization with expansion of food manufacturers, premium ingredient suppliers, and major food distributors systematically increasing pea fiber category investments and introducing premium processing capabilities.
The Spanish market is increasingly characterized by food industry modernization trends reflecting broader European patterns, growing interest in pea fiber formulations addressing specific processing applications, and increasing acceptance of technology investments for ingredients delivering visible processing benefits. Spain's substantial food export potential, strong cultural appreciation for food quality innovation reflecting Mediterranean values, and expanding food processing infrastructure create favorable conditions for pea fiber market expansion.
Demand for pea fiber in BENELUX is expanding at a steady CAGR of 4.3%, fundamentally driven by strong commitment to food processing innovation, premium ingredient solutions, and quality consciousness that positions BENELUX region among European food ingredient leaders. BENELUX food processors and ingredient manufacturers are increasingly selecting pea fiber based on comprehensive quality credentials, verified processing performance through European standards, and complete documentation demonstrating functional benefits and quality profiles throughout food manufacturing processes.
The BENELUX market significantly benefits from well-developed food processing research infrastructure including major food technology companies, specialized pea fiber suppliers including COSUCRA, and professional ingredient distribution networks, combined with demonstrated willingness to invest substantial resources in pea fiber with verified quality certifications and performance standards. BENELUX regulatory environment actively supports food ingredient innovation, pea fiber research development, transparent functional claim requirements, and quality validation initiatives that enhance food industry confidence and market development.
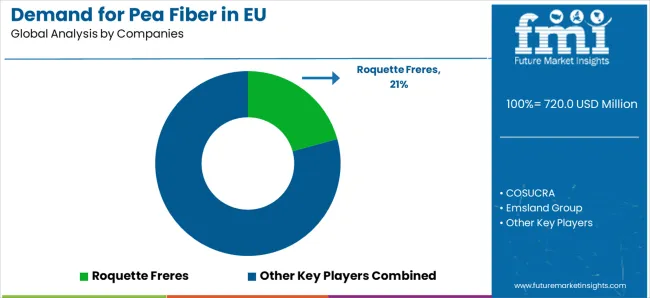
The demand for pea fiber in EU is defined by established competition among multinational ingredient corporations, regional European manufacturers, specialized fiber processors, and sustainable ingredient companies from major food ingredient suppliers. Companies are investing in European processing capacity expansion, advanced fiber extraction technologies, sustainable pea sourcing development through European agricultural centers, functional enhancement solutions aligned with EU food regulations, and direct-to-manufacturer distribution platforms serving diverse European food processing markets.
Strategic partnerships, product portfolio expansion, geographic market penetration across Eastern European growth markets, professional food industry partnership programs, and sustainability certifications are central to strengthening market position and capturing share in this developing European category.
Major market participants include Roquette Freres with significant European market presence through France headquarters and comprehensive pea fiber solutions distributed through European food ingredient channels. COSUCRA maintains substantial European market leadership through Belgium-based operations and sustainability focus applications across food processing sectors including bakery, snack food, and functional food markets.
Emsland Group emphasizes German fiber specialization and technical support services for professional food manufacturers across European markets. Vestkorn Milling represents significant European Nordic capabilities with specialized protein and fiber solutions and comprehensive ingredient technologies.
Regional European producers and specialized ingredient brands are establishing market presence through premium positioning, sustainability certifications, specialty pea fiber formulations including organic alternatives and functional-enhanced options, and direct-to-manufacturer business models.
Circular economy programs from major European food initiatives including established sustainable ingredient programs provide environmentally responsible alternatives supporting market development, capturing market share particularly in sustainability-driven food processing markets.
European co-processing specialists including specialized fiber processors operate comprehensive production facilities serving both branded manufacturers and food industry customers, representing critical infrastructure enabling market expansion and product innovation across European food ingredient markets.
| Item | Value |
|---|---|
| Quantitative Units | USD 1,172.8 million |
| Product Type | Pea Hull Fiber, Pea Cell Wall Fiber |
| End-Use | Baked Products, Breakfast Cereals, Meat Products, Pharmaceuticals, Nutraceuticals, Animal Feed, Snack Foods, Pasta, Crackers, Others |
| Distribution Channel | Specialty Distributors, Direct Sales, Online Retail |
| Countries Covered | Germany, France, Italy, Spain, BENELUX, Rest of Europe |
| Key Companies Profiled | Roquette Freres, COSUCRA, Emsland Group, Vestkorn Milling, CFF GmbH, Ingredion, Cargill, ADM, Agrana, European Regional Processors |
| Additional Attributes | Dollar sales by product type, end-use, and distribution channel, regional demand trends across Western and Eastern European food ingredient markets, competitive landscape analysis with multinational corporations and specialized European ingredient brands, food manufacturer preferences for pea hull versus cell wall fiber formulations and functional performance requirements, integration with European clean-label trends and functional food processing strategies, innovations in fiber extraction technologies and sustainable sourcing solutions aligned with EU food safety regulations, adoption of direct sales models and specialty ingredient distribution networks across EU markets, regulatory framework analysis and food ingredient safety standards, supply chain optimization strategies including sustainable pea sourcing partnerships, and market penetration analysis for diverse food processing segments and geographic regions throughout European Union member states. |
Product Type
The global demand for pea fiber in EU is estimated to be valued at USD 720.0 million in 2025.
The market size for the demand for pea fiber in EU is projected to reach USD 1,172.8 million by 2035.
The demand for pea fiber in EU is expected to grow at a 5.0% CAGR between 2025 and 2035.
The key product types in demand for pea fiber in EU are pea hull fiber and pea cell wall fiber .
In terms of end-use, baked products segment to command 36.3% share in the demand for pea fiber in EU in 2025.


Our Research Products

The "Full Research Suite" delivers actionable market intel, deep dives on markets or technologies, so clients act faster, cut risk, and unlock growth.

The Leaderboard benchmarks and ranks top vendors, classifying them as Established Leaders, Leading Challengers, or Disruptors & Challengers.

Locates where complements amplify value and substitutes erode it, forecasting net impact by horizon

We deliver granular, decision-grade intel: market sizing, 5-year forecasts, pricing, adoption, usage, revenue, and operational KPIs—plus competitor tracking, regulation, and value chains—across 60 countries broadly.

Spot the shifts before they hit your P&L. We track inflection points, adoption curves, pricing moves, and ecosystem plays to show where demand is heading, why it is changing, and what to do next across high-growth markets and disruptive tech

Real-time reads of user behavior. We track shifting priorities, perceptions of today’s and next-gen services, and provider experience, then pace how fast tech moves from trial to adoption, blending buyer, consumer, and channel inputs with social signals (#WhySwitch, #UX).

Partner with our analyst team to build a custom report designed around your business priorities. From analysing market trends to assessing competitors or crafting bespoke datasets, we tailor insights to your needs.
Supplier Intelligence
Discovery & Profiling
Capacity & Footprint
Performance & Risk
Compliance & Governance
Commercial Readiness
Who Supplies Whom
Scorecards & Shortlists
Playbooks & Docs
Category Intelligence
Definition & Scope
Demand & Use Cases
Cost Drivers
Market Structure
Supply Chain Map
Trade & Policy
Operating Norms
Deliverables
Buyer Intelligence
Account Basics
Spend & Scope
Procurement Model
Vendor Requirements
Terms & Policies
Entry Strategy
Pain Points & Triggers
Outputs
Pricing Analysis
Benchmarks
Trends
Should-Cost
Indexation
Landed Cost
Commercial Terms
Deliverables
Brand Analysis
Positioning & Value Prop
Share & Presence
Customer Evidence
Go-to-Market
Digital & Reputation
Compliance & Trust
KPIs & Gaps
Outputs
Full Research Suite comprises of:
Market outlook & trends analysis
Interviews & case studies
Strategic recommendations
Vendor profiles & capabilities analysis
5-year forecasts
8 regions and 60+ country-level data splits
Market segment data splits
12 months of continuous data updates
DELIVERED AS:
PDF EXCEL ONLINE
European Union Tourism Industry Size and Share Forecast Outlook 2025 to 2035
Pea Fiber Market Analysis – Size, Share, and Forecast Outlook 2025 to 2035
European Union Cross-Border Healthcare Market Analysis 2025 to 2035
Market Trends Driving Positive Growth in European Quillaia Extract Sales
Europe Chickpea Protein Market Outlook – Size, Share & Forecast 2025–2035
Breaking Down Market Share in Europe Molded Fiber Pulp Packaging
Western Europe Pea Protein Market Analysis - Size, Share & Trends 2025 to 2035
Europe Whole Grain and High Fiber Foods Market Insights – Size & Forecast 2025–2035
Demand for Glass Fiber in EU Size and Share Forecast Outlook 2025 to 2035
Demand for Chickpea Flour in EU Size and Share Forecast Outlook 2025 to 2035
Fiber Optic Gyroscope Industry Analysis in Western Europe - Trends & Forecast 2025 to 2035
Europe Molded Fiber Pulp Packaging Market Analysis – Demand, Growth & Future Outlook 2024-2034
Demand for Soluble Corn Fiber in EU Size and Share Forecast Outlook 2025 to 2035
Western Europe Molded Fiber Pulp Packaging Market Insights – Growth & Forecast 2023-2033
Demand for Textured Pea for High Protein Savory in EU Size and Share Forecast Outlook 2025 to 2035
Demand of MFGM-enriched Powders & RTDs in European Union Size and Share Forecast Outlook 2025 to 2035
Fiber Optic Probe Hydrophone (FOPH) Market Size and Share Forecast Outlook 2025 to 2035
Fiberglass Centrifugal Fan Market Size and Share Forecast Outlook 2025 to 2035
Europe Radiotherapy Patient Positioning Market Size and Share Forecast Outlook 2025 to 2035
Fiber to the Home Market Size and Share Forecast Outlook 2025 to 2035

Thank you!
You will receive an email from our Business Development Manager. Please be sure to check your SPAM/JUNK folder too.
Chat With
MaRIA