Demand for Plant-Based Fish in EU: Outlook and Forecast (2025-2035)

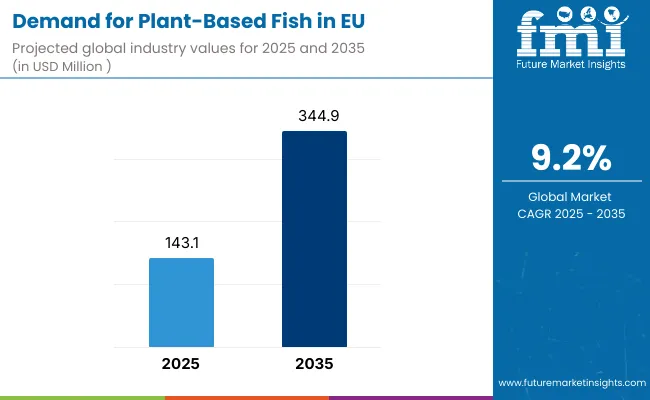
European Union plant-based fish sales are anticipated to reach from USD 143.1 million in 2025 to approximately USD 344.9 million by 2035, recording an absolute increase of USD 201.8 million over the forecast period. This translates into total growth of 141.0%, with demand forecast to expand at a compound annual growth rate (CAGR) of 9.2% between 2025 and 2035. The industry size is expected to grow by nearly 2.4X during the same period, supported by the increasing awareness of ocean sustainability, growing concerns about overfishing and mercury contamination, and developing plant-based alternatives that closely mimic traditional seafood throughout European markets.
Quick Stats for Plant-Based Fish in EU

  • Plant-Based Fish in EU Value (2025): USD 143.1 million
  • Plant-Based Fish in EU Forecast Value (2035): USD 344.9 million
  • Plant-Based Fish in EU Forecast CAGR: 9.2%
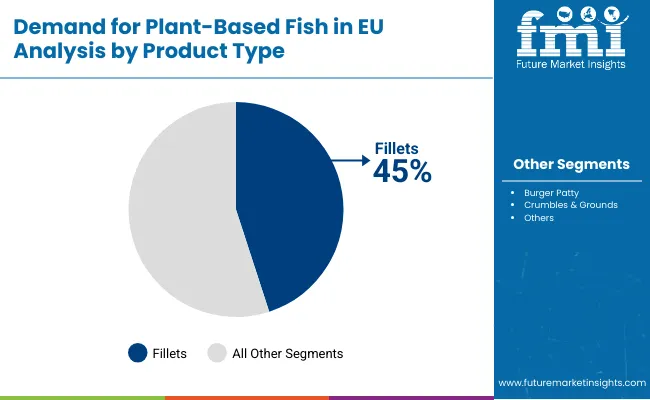
  • Leading Product Type: Fillets (45.0%)
  • Key Growth Countries: France, Spain, and Netherlands
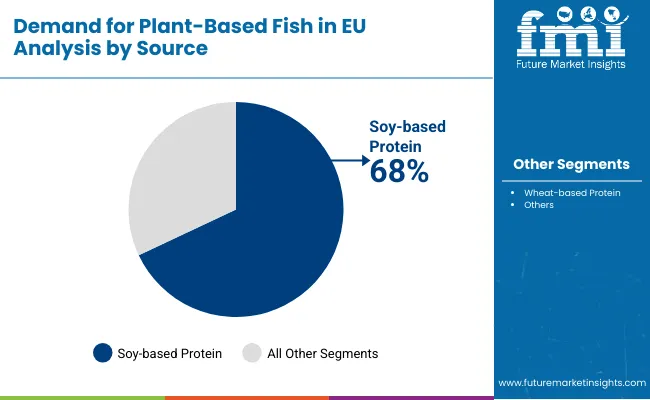
  • Top Source Segment: Soy-based Protein (68.0%)

Demand For Plant Based Fish In Eu

Demand for Plant-Based Fish Market in EU Key Takeaways

Between 2025 and 2030, EU plant-based fish demand is projected to expand from USD 143.1 million to USD 222.1 million, resulting in a value increase of USD 79.0 million, which represents 39.1% of the total forecast growth for the decade. This phase of development will be shaped by rising consumer awareness about ocean depletion and the environmental impact of commercial fishing, increasing innovation in texture and taste technologies that create more authentic seafood alternatives, and growing distribution through mainstream retail channels beyond specialty stores. Manufacturers are expanding their product portfolios to address the evolving preferences for sustainable seafood alternatives, clean-label formulations, and products that deliver the nutritional benefits of traditional fish including omega-3 fatty acids, protein content, and essential minerals.

From 2030 to 2035, sales are forecast to grow from USD 222.1 million to USD 344.9 million, adding another USD 122.8 million, which constitutes 60.9% of the ten-year expansion. This period is expected to be characterized by mainstream adoption of plant-based seafood as regular dietary components, integration of advanced food technologies including precision fermentation and cellular agriculture, and development of innovative formats addressing specific culinary applications from sushi to fish and chips. The growing emphasis on health benefits through fortification and increasing understanding of environmental impact will drive demand for scientifically-formulated products that deliver authentic taste, optimal nutrition, and sustainable sourcing.

Between 2020 and 2025, EU plant-based fish sales experienced steady expansion at a CAGR of 8.0%, growing from USD 97.4 million to USD 143.1 million. This period was driven by increasing flexitarian diets across European populations, rising awareness of microplastic contamination in marine products, and growing recognition that plant-based alternatives can address both health and environmental concerns. The industry developed as foodservice sectors increasingly offered plant-based seafood options and retail manufacturers recognized the underserved alternative seafood opportunity. Product innovations, sensory improvements, and distribution expansions began establishing consumer confidence and culinary acceptance for plant-based fish alternatives.

Why is the Demand for Plant-Based Fish in EU Growing

Industry expansion is being supported by the rapid evolution in food technology capabilities across European companies and the corresponding demand for sustainable protein sources that address environmental concerns while maintaining nutritional value and culinary versatility. Modern food manufacturers increasingly invest in research and development to create plant-based fish products that deliver authentic taste, flaky texture, and ocean-fresh experience, driving demand for products that address multiple consumer needs including environmental sustainability, health optimization, and ethical consumption without compromising on sensory satisfaction.

The growing body of scientific research demonstrating the environmental impact of commercial fishing and the health risks associated with mercury and microplastic contamination in traditional seafood is driving demand for clean, sustainable alternatives from manufacturers with appropriate innovation credentials and quality certifications. Environmental organizations and health authorities are increasingly highlighting the benefits of plant-based seafood, including reduced ocean depletion, lower carbon footprint, and elimination of contaminant risks. Scientific studies are providing evidence supporting plant-based fish benefits, including comparable protein content, enhanced omega-3 profiles through algae-based fortification, and absence of heavy metals, requiring specialized formulations that address the unique nutritional and sensory demands of seafood alternatives distinct from other plant-based proteins.

Segmental Analysis

Sales are segmented by product type, source, distribution channel, and country. By product type, demand is divided into fillets, burger patty, crumbles & grounds, and others. Based on source, sales are categorized into soy-based protein, wheat-based protein, and others. In terms of distribution channel, demand is segmented into supermarkets, specialty food stores, convenience stores, and others. Regionally, demand is focused on Germany, France, Italy, Spain, the Netherlands, and the Rest of Europe.
By Product Type, Fillets Segment Accounts for 45.0% Share

Demand For Plant Based Fish In Eu By Product

The fillets segment is projected to account for 45.0% of EU plant-based fish sales in 2025, increasing slightly to 46.0% by 2035, establishing itself as the foundational category addressing core culinary applications in European cuisine. This commanding position is fundamentally supported by consumer preference for familiar formats that integrate seamlessly into traditional recipes, established cooking methods that work with fillet structures, and versatility across multiple preparation styles from grilling to baking. The segment delivers comprehensive culinary solutions, providing consumers with plant-based alternatives suitable for fish and chips, fish tacos, sandwich applications, and fine dining presentations essential for mainstream adoption.

Key advantages:
  • Versatile culinary applications across cuisines
  • Familiar format reducing adoption barriers
  • Premium positioning enabling value capture

By Source, Soy-based Protein Accounts for 68.0% Share

Demand For Plant Based Fish In Eu By Source

Soy-based protein is positioned to represent 68.0% of total plant-based fish demand across European operations in 2025, moderating slightly to 66.0% by 2035, reflecting the ingredient's dominance as the primary protein source for seafood alternatives. This considerable share directly demonstrates that soy protein's functional properties, including texture formation, moisture binding, and flavor neutrality, make it ideal for seafood applications.

Modern manufacturers increasingly optimize soy protein processing to achieve specific textural attributes, driving demand for products featuring advanced extrusion technologies, proprietary structuring techniques, and enhanced nutritional profiles. The segment benefits from continuous innovation focused on non-GMO sourcing, allergen management protocols, and combination with complementary proteins enhancing amino acid profiles and reducing soy flavor notes common in earlier generation products.

Key drivers:
  • Functional properties enabling texture creation
  • Established supply chains ensuring availability
  • Cost-effectiveness supporting market accessibility

By Distribution Channel, Supermarkets Maintain 56.0% Share

Demand For Plant Based Fish In Eu By Distribution

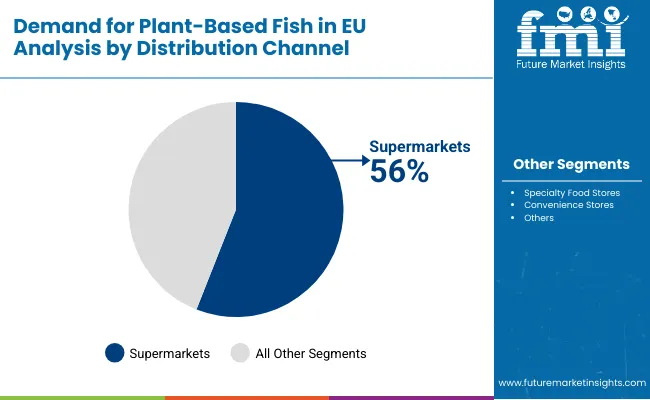
Supermarkets are strategically estimated to control 56.0% of total European plant-based fish sales in 2025, declining to 53.0% by 2035, reflecting the channel's importance for mainstream market penetration while facing growing competition from specialty and online channels. European supermarket chains consistently provide accessible environments for plant-based fish purchases, offering convenient shopping, competitive pricing, and integrated placement alongside traditional seafood creating comparison opportunities.

The segment provides essential touchpoints through dedicated plant-based sections where consumers discover new products, frozen aisles offering extended shelf life, and fresh counters providing premium alternatives. Major European retailers including Carrefour, Tesco, Aldi, and Albert Heijn systematically expand plant-based seafood selections, often featuring promotional activities and educational materials supporting category development.

Success factors:

  • Mainstream accessibility driving volume
  • Competitive pricing through scale
  • Cross-merchandising opportunities

What are the Drivers, Restraints, and Key Trends

EU plant-based fish sales are advancing rapidly due to increasing environmental consciousness regarding ocean sustainability, growing health concerns about contaminants in traditional seafood, and rising flexitarian populations seeking protein diversification. The industry faces challenges, including taste and texture gaps compared to traditional fish, premium pricing limiting mainstream adoption, and consumer skepticism about processed alternatives. Continued innovation in formulation science and sensory optimization remains central to industry development.

Advancement of Cellular Agriculture Technologies

The rapidly accelerating development of cellular agriculture and precision fermentation technologies is fundamentally transforming plant-based seafood from simple protein substitutes to sophisticated biomimetic products, enabling authentic replication previously unattainable through conventional plant processing. Advanced fermentation platforms featuring marine microalgae cultivation, heme protein production, and omega-3 synthesis allow companies to create products delivering genuine seafood flavors, nutritional profiles, and cooking behaviors with precision meeting culinary expectations. These technological innovations prove particularly transformative for premium applications, sushi-grade alternatives, and whole-muscle products where traditional plant-based methods inadequately replicate seafood complexity.

Major food technology companies invest heavily in fermentation facilities, strain development programs, and bioprocess optimization, recognizing that cellular technologies represent breakthrough solutions for authenticity challenges and nutritional enhancement. Companies collaborate with biotechnology firms, research institutions, and culinary experts to develop scalable production systems that balance innovation benefits with commercial viability and regulatory compliance supporting sustainable business models.

Integration of Ocean-Positive Positioning

Modern plant-based fish producers systematically incorporate ocean conservation messaging, marine ecosystem protection, and sustainable fishing advocacy into brand positioning, recognizing environmental impact as primary purchase motivation requiring authentic commitment beyond product attributes. Strategic integration of sustainability credentials enables manufacturers to address consumer values through transparent impact metrics including carbon footprint reduction, water usage optimization, and biodiversity protection where plant-based alternatives demonstrate measurable environmental benefits. These sustainability initiatives prove essential for brand differentiation, as conscious consumers increasingly evaluate products based on comprehensive environmental impact affecting both purchasing decisions and brand loyalty.

Companies implement extensive sustainability programs investigating supply chain impacts, packaging innovations, and carbon neutrality pathways, including lifecycle assessments, renewable energy adoption, and regenerative agriculture partnerships. Manufacturers leverage environmental positioning in marketing communications, highlighting ocean preservation benefits, carbon reduction achievements, and ecosystem restoration support, positioning products as activism vehicles beyond dietary choices.

Growing Emphasis on Nutritional Optimization

European consumers increasingly demand nutritional equivalence or superiority compared to traditional seafood, driving manufacturers toward comprehensive fortification strategies and bioavailability enhancement that aligns with health optimization priorities. This nutritional trend enables companies to build credibility through scientific substantiation, command premium pricing through health positioning, and differentiate products in competitive markets where nutritional density influences purchase decisions. Nutritional optimization proves particularly important for health-conscious consumers where protein quality, omega-3 content, and micronutrient profiles directly determine product selection and consumption frequency.

The development of algae-based omega-3 systems, vitamin B12 fortification, and mineral enhancement expands manufacturers' abilities to meet nutritional demands while maintaining clean labels and natural positioning. Brands collaborate with nutrition scientists, clinical researchers, and health professionals to develop evidence-based formulations balancing nutritional goals with sensory acceptance, supporting premium positioning while meeting regulatory requirements and consumer expectations.

Europe Market Split by Country

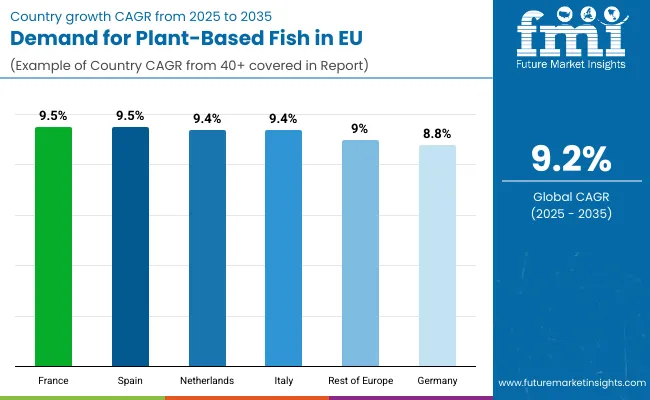
EU plant-based fish sales are projected to grow from USD 143.1 million in 2025 to USD 344.9 million by 2035, registering a robust CAGR of 9.2% over the forecast period. France is expected to demonstrate strong growth trajectory with a 9.5% CAGR, supported by sophisticated culinary culture, environmental consciousness, and early adoption of plant-based innovations. Spain follows with 9.5% CAGR, attributed to Mediterranean dietary patterns and increasing sustainability awareness.

Germany maintains the largest share at 30.2% in 2025, driven by established plant-based market infrastructure and strong environmental values, while growing at 8.8% CAGR. Netherlands and Italy demonstrate 9.4% CAGR, reflecting innovation leadership and culinary integration respectively.
Demand Analysis by Key Countries

Demand For Plant Based Fish In Eu By Country

Country CAGR % (2025-2035)
France 9.5%
Spain 9.5%
Netherlands 9.4%
Italy 9.4%
Rest of Europe 9.0%
Germany 8.8%

EU plant-based fish sales demonstrate differentiated growth trajectories across major European economies, with Mediterranean and progressive markets outpacing traditional strongholds through 2035, driven by varying culinary traditions, environmental priorities, and plant-based market maturity. France shows exceptional growth from USD 28.4 million in 2025 to USD 70.5 million by 2035 at 9.5% CAGR. Spain expands robustly from USD 15.5 million to USD 38.3 million at 9.5% CAGR. Netherlands records strong growth from USD 18.4 million to USD 45.2 million at 9.4% CAGR. Italy demonstrates USD 13.3 million to USD 32.7 million at 9.4% CAGR. Rest of Europe shows USD 24.3 million to USD 57.6 million at 9.0% CAGR. Germany maintains steady expansion from USD 43.2 million to USD 100.6 million at 8.8% CAGR.

Germany Maintains Leadership with Established Infrastructure

The plant-based fish sector in Germany is projected to exhibit steady growth with a CAGR of 8.8% through 2035, driven by exceptionally well-developed plant-based market infrastructure, strong environmental consciousness, and established distribution networks throughout the country. Germany's sophisticated alternative protein ecosystem and internationally recognized sustainability commitments create substantial demand for innovative plant-based seafood across retail and foodservice channels.

Major retailers including Edeka, Rewe, Lidl, and Kaufland systematically expand plant-based fish offerings, often featuring dedicated sections with extensive product ranges from multiple brands. German demand benefits from high environmental awareness driving sustainable consumption, substantial vegetarian and vegan populations seeking seafood alternatives, and technological innovation capabilities supporting domestic production. The strong foodservice sector, including quick-service restaurants and institutional catering, increasingly incorporates plant-based fish options responding to consumer demand.

The relatively moderate growth rate reflects Germany's mature plant-based market status where established consumption patterns leave room for steady expansion through innovation and premiumization rather than explosive volume growth throughout the forecast period.

Growth drivers:

  • Environmental consciousness driving adoption
  • Established plant-based infrastructure
  • Innovation ecosystem supporting development

France Shows Strong Growth with Culinary Excellence

Revenue from plant-based fish in France is expanding at a CAGR of 9.5%, supported by sophisticated culinary culture embracing gastronomic innovation, strong environmental movement, and increasing flexitarian adoption among French consumers. France's renowned seafood traditions and culinary expertise create unique opportunities for premium plant-based alternatives meeting haute cuisine standards.

Major retailers including Carrefour, Leclerc, and Monoprix actively promote plant-based seafood through premium positioning, chef collaborations, and educational initiatives explaining environmental benefits. French sales particularly benefit from coastal populations seeking sustainable alternatives, restaurant sector innovation in plant-based seafood dishes, and government support for sustainable food systems. The country's emphasis on taste and quality creates opportunities for sophisticated products delivering authentic culinary experiences.

Success factors:

  • Culinary sophistication demanding quality
  • Environmental activism supporting sustainability
  • Coastal culture embracing ocean preservation

Italy Demonstrates Aligned Growth with Mediterranean Focus

The demand for plant-based fish in Italy is growing at a CAGR of 9.4%, fundamentally driven by Mediterranean dietary traditions emphasizing seafood consumption, expanding awareness of overfishing impacts, and growing integration of plant-based options into Italian cuisine. Italy's evolving food landscape increasingly recognizes plant-based seafood's role in sustainable Mediterranean diets, creating favorable conditions for premium alternatives among quality-conscious Italian consumers.

Major Italian retailers including Coop, Esselunga, and Conad actively promote plant-based fish through recipe integration, cooking demonstrations, and seasonal promotions aligned with Catholic dietary traditions. Italian sales particularly benefit from coastal tourism demanding sustainable options, increasing health consciousness among younger demographics, and culinary innovation preserving traditional flavors through plant-based formats.

Development factors:

  • Mediterranean diet integration opportunities
  • Coastal consciousness regarding marine protection
  • Culinary tradition embracing innovation

Spain Shows Robust Expansion with Sustainability Focus

Demand for plant-based fish in Spain is projected to grow at an impressive CAGR of 9.5%, substantially supported by strong seafood consumption traditions creating large addressable markets, increasing environmental awareness particularly among younger consumers, and growing tourism sector demanding sustainable alternatives. Spanish market transformation and improving economic conditions position plant-based seafood as accessible alternatives aligned with contemporary sustainability priorities.

Major Spanish retailers including Mercadona, Carrefour, and El Corte Inglés systematically introduce plant-based fish ranges with competitive pricing and Spanish-specific products addressing local preferences. Spain's extensive coastline and maritime heritage create unique positioning for ocean-positive alternatives. The country's vibrant tapas culture and restaurant innovation enable creative applications, supporting category development through culinary experimentation.

Growth enablers:

  • Seafood culture creating market opportunity
  • Environmental movement gaining momentum
  • Tourism driving sustainable options

Netherlands Leads Innovation Through Technology Leadership

Demand for plant-based fish in the Netherlands is expanding at a leading CAGR of 9.4%, fundamentally driven by exceptional food technology capabilities, progressive sustainability policies, and sophisticated understanding of alternative proteins among Dutch consumers. Dutch society demonstrates particular strength in innovation ecosystems, sustainable food initiatives, and early adoption of food technologies positioning the Netherlands as European leader in plant-based seafood development.

Netherlands sales significantly benefit from government support for sustainable protein transition including research funding and regulatory frameworks, high concentration of food technology companies driving innovation, and consumer openness to novel foods supporting market experimentation. Dutch ports' historical importance creates cultural connections to seafood while environmental consciousness drives alternative adoption. The country's export-oriented food industry positions Dutch companies as European suppliers for plant-based seafood innovations.

Innovation drivers:
  • Technology ecosystem enabling development
  • Government support accelerating transition
  • Export capabilities scaling innovations

Competitive Landscape

Demand For Plant Based Fish In Eu By Company

EU plant-based fish sales are defined by competition among specialized alternative seafood companies, established plant-based manufacturers, and emerging food technology startups. Companies are investing in sensory optimization, nutritional enhancement, sustainability certification, and culinary partnerships to deliver authentic, nutritious, and sustainable seafood alternatives. Strategic partnerships with retailers, foodservice operators, and environmental organizations emphasizing market education and category development are central to strengthening competitive position.

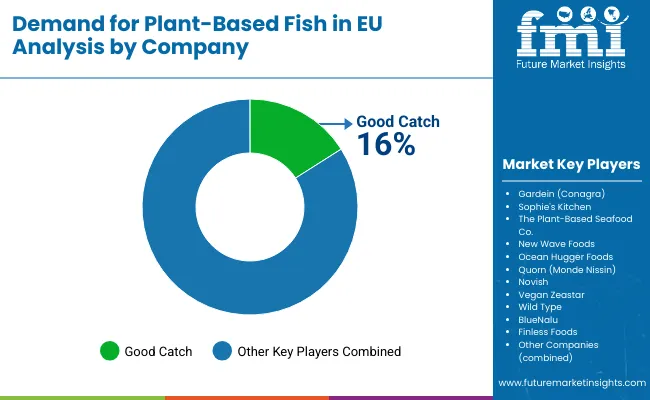
Major participants include Good Catch with an estimated 16.0% share, leveraging its culinary positioning, chef partnerships, and strong retail presence through premium plant-based seafood. Good Catch benefits from proprietary protein blend technology, comprehensive product portfolio, and established relationships with natural food retailers supporting brand recognition among conscious consumers.

Gardein (Conagra) holds approximately 12.0% share through its mainstream market access, competitive pricing strategies, and trusted brand heritage. The company's success in frozen food channels and ability to provide accessible plant-based seafood creates strong positioning among value-conscious consumers seeking convenient alternatives.

Sophie's Kitchen accounts for roughly 8.0% share through its position as clean-label pioneer with strong specialty retail presence, providing allergen-free seafood alternatives through konjac-based formulations. The company benefits from unique texture technologies, family-friendly positioning, and marketing excellence targeting health-conscious families.

Other key players including The Plant-Based Seafood Co. (6.0%), New Wave Foods (5.0%), and Ocean Hugger Foods (4.0%) collectively with additional companies hold 49.0% share, reflecting the fragmented nature of European plant-based fish market where numerous specialized brands, regional manufacturers, and emerging technology companies serve specific consumer segments and culinary applications.

Key Players

  • Good Catch
  • Gardein (Conagra)
  • Sophie's Kitchen
  • The Plant-Based Seafood Co.
  • New Wave Foods
  • Ocean Hugger Foods
  • Quorn (Monde Nissin)
  • Novish
  • Vegan Zeastar
  • Wild Type
  • BlueNalu
  • Finless Foods
  • Others

Scope of the Report

Item Value
Quantitative Units USD 344.9 million
Product Type Fillets; Burger Patty; Crumbles & Grounds; Others
Source (Protein Base) Soy-based Protein; Wheat-based Protein; Others (Pea, Algae, Konjac)
Distribution Channel Supermarkets; Specialty Food Stores; Convenience Stores; Others
Countries Covered Germany; France; Italy; Spain; Netherlands; Rest of Europe
Key Companies Profiled Good Catch; Gardein; Sophie's Kitchen; Plant-Based Seafood Co.; New Wave Foods; Ocean Hugger Foods
Additional Attributes Dollar sales by product type, source, and distribution channel; regional demand trends; competitive landscape; consumer preferences; integration with foodservice/retail; texture & flavor innovations; adoption across channels; regulatory framework; sustainability initiatives; premium vs value penetration

Key Segments

Product Type

  • Fillets
  • Burger Patty
  • Crumbles & Grounds
  • Others

Source (Protein Base)

  • Soy-based Protein
  • Wheat-based Protein
  • Others

Distribution Channel

  • Supermarkets
  • Specialty Food Stores
  • Convenience Stores
  • Others

Countries

  • Germany
  • France
  • Italy
  • Spain
  • Netherlands
  • Rest of Europe

Table of Content

  1. Executive Summary
    • Global Market Outlook
    • Demand to side Trends
    • Supply to side Trends
    • Technology Roadmap Analysis
    • Analysis and Recommendations
  2. Market Overview
    • Market Coverage / Taxonomy
    • Market Definition / Scope / Limitations
  3. Market Background
    • Market Dynamics
      • Drivers
      • Restraints
      • Opportunity
      • Trends
    • Scenario Forecast
      • Demand in Optimistic Scenario
      • Demand in Likely Scenario
      • Demand in Conservative Scenario
    • Opportunity Map Analysis
    • Product Life Cycle Analysis
    • Supply Chain Analysis
    • Investment Feasibility Matrix
    • Value Chain Analysis
    • PESTLE and Porter’s Analysis
    • Regulatory Landscape
    • Regional Parent Market Outlook
    • Production and Consumption Statistics
    • Import and Export Statistics
  4. Global Market Analysis 2020 to 2024 and Forecast, 2025 to 2035
    • Historical Market Size Value (USD Million) Analysis, 2020 to 2024
    • Current and Future Market Size Value (USD Million) Projections, 2025 to 2035
      • Y to o to Y Growth Trend Analysis
      • Absolute $ Opportunity Analysis
  5. Global Market Pricing Analysis 2020 to 2024 and Forecast 2025 to 2035
  6. Global Market Analysis 2020 to 2024 and Forecast 2025 to 2035, By Product Type
    • Introduction / Key Findings
    • Historical Market Size Value (USD Million) Analysis By Product Type , 2020 to 2024
    • Current and Future Market Size Value (USD Million) Analysis and Forecast By Product Type , 2025 to 2035
      • Fillets
      • Burger Patty
      • Crumbles & Grounds
      • Others
    • Y to o to Y Growth Trend Analysis By Product Type , 2020 to 2024
    • Absolute $ Opportunity Analysis By Product Type , 2025 to 2035
  7. Global Market Analysis 2020 to 2024 and Forecast 2025 to 2035, By Source (Protein Base)
    • Introduction / Key Findings
    • Historical Market Size Value (USD Million) Analysis By Source (Protein Base), 2020 to 2024
    • Current and Future Market Size Value (USD Million) Analysis and Forecast By Source (Protein Base), 2025 to 2035
      • Soy-based Protein
      • Wheat-based Protein
      • Others
    • Y to o to Y Growth Trend Analysis By Source (Protein Base), 2020 to 2024
    • Absolute $ Opportunity Analysis By Source (Protein Base), 2025 to 2035
  8. Global Market Analysis 2020 to 2024 and Forecast 2025 to 2035, By Distribution Channel
    • Introduction / Key Findings
    • Historical Market Size Value (USD Million) Analysis By Distribution Channel, 2020 to 2024
    • Current and Future Market Size Value (USD Million) Analysis and Forecast By Distribution Channel, 2025 to 2035
      • Supermarkets
      • Specialty Food Stores
      • Convenience Stores
      • Others
    • Y to o to Y Growth Trend Analysis By Distribution Channel, 2020 to 2024
    • Absolute $ Opportunity Analysis By Distribution Channel, 2025 to 2035
  9. Global Market Analysis 2020 to 2024 and Forecast 2025 to 2035, By Region
    • Introduction
    • Historical Market Size Value (USD Million) Analysis By Region, 2020 to 2024
    • Current Market Size Value (USD Million) Analysis and Forecast By Region, 2025 to 2035
      • North America
      • Latin America
      • Western Europe
      • Eastern Europe
      • East Asia
      • South Asia and Pacific
      • Middle East & Africa
    • Market Attractiveness Analysis By Region
  10. North America Market Analysis 2020 to 2024 and Forecast 2025 to 2035, By Country
    • Historical Market Size Value (USD Million) Trend Analysis By Market Taxonomy, 2020 to 2024
    • Market Size Value (USD Million) Forecast By Market Taxonomy, 2025 to 2035
      • By Country
        • USA
        • Canada
        • Mexico
      • By Product Type
      • By Source (Protein Base)
      • By Distribution Channel
    • Market Attractiveness Analysis
      • By Country
      • By Product Type
      • By Source (Protein Base)
      • By Distribution Channel
    • Key Takeaways
  11. Latin America Market Analysis 2020 to 2024 and Forecast 2025 to 2035, By Country
    • Historical Market Size Value (USD Million) Trend Analysis By Market Taxonomy, 2020 to 2024
    • Market Size Value (USD Million) Forecast By Market Taxonomy, 2025 to 2035
      • By Country
        • Brazil
        • Chile
        • Rest of Latin America
      • By Product Type
      • By Source (Protein Base)
      • By Distribution Channel
    • Market Attractiveness Analysis
      • By Country
      • By Product Type
      • By Source (Protein Base)
      • By Distribution Channel
    • Key Takeaways
  12. Western Europe Market Analysis 2020 to 2024 and Forecast 2025 to 2035, By Country
    • Historical Market Size Value (USD Million) Trend Analysis By Market Taxonomy, 2020 to 2024
    • Market Size Value (USD Million) Forecast By Market Taxonomy, 2025 to 2035
      • By Country
        • Germany
        • UK
        • Italy
        • Spain
        • France
        • Nordic
        • BENELUX
        • Rest of Western Europe
      • By Product Type
      • By Source (Protein Base)
      • By Distribution Channel
    • Market Attractiveness Analysis
      • By Country
      • By Product Type
      • By Source (Protein Base)
      • By Distribution Channel
    • Key Takeaways
  13. Eastern Europe Market Analysis 2020 to 2024 and Forecast 2025 to 2035, By Country
    • Historical Market Size Value (USD Million) Trend Analysis By Market Taxonomy, 2020 to 2024
    • Market Size Value (USD Million) Forecast By Market Taxonomy, 2025 to 2035
      • By Country
        • Russia
        • Poland
        • Hungary
        • Balkan & Baltic
        • Rest of Eastern Europe
      • By Product Type
      • By Source (Protein Base)
      • By Distribution Channel
    • Market Attractiveness Analysis
      • By Country
      • By Product Type
      • By Source (Protein Base)
      • By Distribution Channel
    • Key Takeaways
  14. East Asia Market Analysis 2020 to 2024 and Forecast 2025 to 2035, By Country
    • Historical Market Size Value (USD Million) Trend Analysis By Market Taxonomy, 2020 to 2024
    • Market Size Value (USD Million) Forecast By Market Taxonomy, 2025 to 2035
      • By Country
        • China
        • Japan
        • South Korea
      • By Product Type
      • By Source (Protein Base)
      • By Distribution Channel
    • Market Attractiveness Analysis
      • By Country
      • By Product Type
      • By Source (Protein Base)
      • By Distribution Channel
    • Key Takeaways
  15. South Asia and Pacific Market Analysis 2020 to 2024 and Forecast 2025 to 2035, By Country
    • Historical Market Size Value (USD Million) Trend Analysis By Market Taxonomy, 2020 to 2024
    • Market Size Value (USD Million) Forecast By Market Taxonomy, 2025 to 2035
      • By Country
        • India
        • ASEAN
        • Australia & New Zealand
        • Rest of South Asia and Pacific
      • By Product Type
      • By Source (Protein Base)
      • By Distribution Channel
    • Market Attractiveness Analysis
      • By Country
      • By Product Type
      • By Source (Protein Base)
      • By Distribution Channel
    • Key Takeaways
  16. Middle East & Africa Market Analysis 2020 to 2024 and Forecast 2025 to 2035, By Country
    • Historical Market Size Value (USD Million) Trend Analysis By Market Taxonomy, 2020 to 2024
    • Market Size Value (USD Million) Forecast By Market Taxonomy, 2025 to 2035
      • By Country
        • Kingdom of Saudi Arabia
        • Other GCC Countries
        • Turkiye
        • South Africa
        • Other African Union
        • Rest of Middle East & Africa
      • By Product Type
      • By Source (Protein Base)
      • By Distribution Channel
    • Market Attractiveness Analysis
      • By Country
      • By Product Type
      • By Source (Protein Base)
      • By Distribution Channel
    • Key Takeaways
  17. Key Countries Market Analysis
    • USA
      • Pricing Analysis
      • Market Share Analysis, 2024
        • By Product Type
        • By Source (Protein Base)
        • By Distribution Channel
    • Canada
      • Pricing Analysis
      • Market Share Analysis, 2024
        • By Product Type
        • By Source (Protein Base)
        • By Distribution Channel
    • Mexico
      • Pricing Analysis
      • Market Share Analysis, 2024
        • By Product Type
        • By Source (Protein Base)
        • By Distribution Channel
    • Brazil
      • Pricing Analysis
      • Market Share Analysis, 2024
        • By Product Type
        • By Source (Protein Base)
        • By Distribution Channel
    • Chile
      • Pricing Analysis
      • Market Share Analysis, 2024
        • By Product Type
        • By Source (Protein Base)
        • By Distribution Channel
    • Germany
      • Pricing Analysis
      • Market Share Analysis, 2024
        • By Product Type
        • By Source (Protein Base)
        • By Distribution Channel
    • UK
      • Pricing Analysis
      • Market Share Analysis, 2024
        • By Product Type
        • By Source (Protein Base)
        • By Distribution Channel
    • Italy
      • Pricing Analysis
      • Market Share Analysis, 2024
        • By Product Type
        • By Source (Protein Base)
        • By Distribution Channel
    • Spain
      • Pricing Analysis
      • Market Share Analysis, 2024
        • By Product Type
        • By Source (Protein Base)
        • By Distribution Channel
    • France
      • Pricing Analysis
      • Market Share Analysis, 2024
        • By Product Type
        • By Source (Protein Base)
        • By Distribution Channel
    • India
      • Pricing Analysis
      • Market Share Analysis, 2024
        • By Product Type
        • By Source (Protein Base)
        • By Distribution Channel
    • ASEAN
      • Pricing Analysis
      • Market Share Analysis, 2024
        • By Product Type
        • By Source (Protein Base)
        • By Distribution Channel
    • Australia & New Zealand
      • Pricing Analysis
      • Market Share Analysis, 2024
        • By Product Type
        • By Source (Protein Base)
        • By Distribution Channel
    • China
      • Pricing Analysis
      • Market Share Analysis, 2024
        • By Product Type
        • By Source (Protein Base)
        • By Distribution Channel
    • Japan
      • Pricing Analysis
      • Market Share Analysis, 2024
        • By Product Type
        • By Source (Protein Base)
        • By Distribution Channel
    • South Korea
      • Pricing Analysis
      • Market Share Analysis, 2024
        • By Product Type
        • By Source (Protein Base)
        • By Distribution Channel
    • Russia
      • Pricing Analysis
      • Market Share Analysis, 2024
        • By Product Type
        • By Source (Protein Base)
        • By Distribution Channel
    • Poland
      • Pricing Analysis
      • Market Share Analysis, 2024
        • By Product Type
        • By Source (Protein Base)
        • By Distribution Channel
    • Hungary
      • Pricing Analysis
      • Market Share Analysis, 2024
        • By Product Type
        • By Source (Protein Base)
        • By Distribution Channel
    • Kingdom of Saudi Arabia
      • Pricing Analysis
      • Market Share Analysis, 2024
        • By Product Type
        • By Source (Protein Base)
        • By Distribution Channel
    • Turkiye
      • Pricing Analysis
      • Market Share Analysis, 2024
        • By Product Type
        • By Source (Protein Base)
        • By Distribution Channel
    • South Africa
      • Pricing Analysis
      • Market Share Analysis, 2024
        • By Product Type
        • By Source (Protein Base)
        • By Distribution Channel
  18. Market Structure Analysis
    • Competition Dashboard
    • Competition Benchmarking
    • Market Share Analysis of Top Players
      • By Regional
      • By Product Type
      • By Source (Protein Base)
      • By Distribution Channel
  19. Competition Analysis
    • Competition Deep Dive
      • Good Catch
        • Overview
        • Product Portfolio
        • Profitability by Market Segments (Product/Age /Sales Channel/Region)
        • Sales Footprint
        • Strategy Overview
          • Marketing Strategy
          • Product Strategy
          • Channel Strategy
      • Gardein (Conagra)
      • Sophie's Kitchen
      • The Plant-Based Seafood Co.
      • New Wave Foods
      • Ocean Hugger Foods
      • Quorn (Monde Nissin)
      • Novish
      • Vegan Zeastar
      • Wild Type
      • BlueNalu
      • Finless Foods
      • Others
  20. Assumptions & Acronyms Used
  21. Research Methodology

List of Tables

  • Table 1: Global Market Value (USD Million) Forecast by Region, 2020 to 2035
  • Table 2: Global Market Value (USD Million) Forecast by Product Type , 2020 to 2035
  • Table 3: Global Market Value (USD Million) Forecast by Source (Protein Base), 2020 to 2035
  • Table 4: Global Market Value (USD Million) Forecast by Distribution Channel, 2020 to 2035
  • Table 5: North America Market Value (USD Million) Forecast by Country, 2020 to 2035
  • Table 6: North America Market Value (USD Million) Forecast by Product Type , 2020 to 2035
  • Table 7: North America Market Value (USD Million) Forecast by Source (Protein Base), 2020 to 2035
  • Table 8: North America Market Value (USD Million) Forecast by Distribution Channel, 2020 to 2035
  • Table 9: Latin America Market Value (USD Million) Forecast by Country, 2020 to 2035
  • Table 10: Latin America Market Value (USD Million) Forecast by Product Type , 2020 to 2035
  • Table 11: Latin America Market Value (USD Million) Forecast by Source (Protein Base), 2020 to 2035
  • Table 12: Latin America Market Value (USD Million) Forecast by Distribution Channel, 2020 to 2035
  • Table 13: Western Europe Market Value (USD Million) Forecast by Country, 2020 to 2035
  • Table 14: Western Europe Market Value (USD Million) Forecast by Product Type , 2020 to 2035
  • Table 15: Western Europe Market Value (USD Million) Forecast by Source (Protein Base), 2020 to 2035
  • Table 16: Western Europe Market Value (USD Million) Forecast by Distribution Channel, 2020 to 2035
  • Table 17: Eastern Europe Market Value (USD Million) Forecast by Country, 2020 to 2035
  • Table 18: Eastern Europe Market Value (USD Million) Forecast by Product Type , 2020 to 2035
  • Table 19: Eastern Europe Market Value (USD Million) Forecast by Source (Protein Base), 2020 to 2035
  • Table 20: Eastern Europe Market Value (USD Million) Forecast by Distribution Channel, 2020 to 2035
  • Table 21: East Asia Market Value (USD Million) Forecast by Country, 2020 to 2035
  • Table 22: East Asia Market Value (USD Million) Forecast by Product Type , 2020 to 2035
  • Table 23: East Asia Market Value (USD Million) Forecast by Source (Protein Base), 2020 to 2035
  • Table 24: East Asia Market Value (USD Million) Forecast by Distribution Channel, 2020 to 2035
  • Table 25: South Asia and Pacific Market Value (USD Million) Forecast by Country, 2020 to 2035
  • Table 26: South Asia and Pacific Market Value (USD Million) Forecast by Product Type , 2020 to 2035
  • Table 27: South Asia and Pacific Market Value (USD Million) Forecast by Source (Protein Base), 2020 to 2035
  • Table 28: South Asia and Pacific Market Value (USD Million) Forecast by Distribution Channel, 2020 to 2035
  • Table 29: Middle East & Africa Market Value (USD Million) Forecast by Country, 2020 to 2035
  • Table 30: Middle East & Africa Market Value (USD Million) Forecast by Product Type , 2020 to 2035
  • Table 31: Middle East & Africa Market Value (USD Million) Forecast by Source (Protein Base), 2020 to 2035
  • Table 32: Middle East & Africa Market Value (USD Million) Forecast by Distribution Channel, 2020 to 2035

List of Figures

  • Figure 1: Global Market Pricing Analysis
  • Figure 2: Global Market Value (USD Million) Forecast 2020-2035
  • Figure 3: Global Market Value Share and BPS Analysis by Product Type , 2025 and 2035
  • Figure 4: Global Market Y to o to Y Growth Comparison by Product Type , 2025-2035
  • Figure 5: Global Market Attractiveness Analysis by Product Type
  • Figure 6: Global Market Value Share and BPS Analysis by Source (Protein Base), 2025 and 2035
  • Figure 7: Global Market Y to o to Y Growth Comparison by Source (Protein Base), 2025-2035
  • Figure 8: Global Market Attractiveness Analysis by Source (Protein Base)
  • Figure 9: Global Market Value Share and BPS Analysis by Distribution Channel, 2025 and 2035
  • Figure 10: Global Market Y to o to Y Growth Comparison by Distribution Channel, 2025-2035
  • Figure 11: Global Market Attractiveness Analysis by Distribution Channel
  • Figure 12: Global Market Value (USD Million) Share and BPS Analysis by Region, 2025 and 2035
  • Figure 13: Global Market Y to o to Y Growth Comparison by Region, 2025-2035
  • Figure 14: Global Market Attractiveness Analysis by Region
  • Figure 15: North America Market Incremental Dollar Opportunity, 2025-2035
  • Figure 16: Latin America Market Incremental Dollar Opportunity, 2025-2035
  • Figure 17: Western Europe Market Incremental Dollar Opportunity, 2025-2035
  • Figure 18: Eastern Europe Market Incremental Dollar Opportunity, 2025-2035
  • Figure 19: East Asia Market Incremental Dollar Opportunity, 2025-2035
  • Figure 20: South Asia and Pacific Market Incremental Dollar Opportunity, 2025-2035
  • Figure 21: Middle East & Africa Market Incremental Dollar Opportunity, 2025-2035
  • Figure 22: North America Market Value Share and BPS Analysis by Country, 2025 and 2035
  • Figure 23: North America Market Value Share and BPS Analysis by Product Type , 2025 and 2035
  • Figure 24: North America Market Y to o to Y Growth Comparison by Product Type , 2025-2035
  • Figure 25: North America Market Attractiveness Analysis by Product Type
  • Figure 26: North America Market Value Share and BPS Analysis by Source (Protein Base), 2025 and 2035
  • Figure 27: North America Market Y to o to Y Growth Comparison by Source (Protein Base), 2025-2035
  • Figure 28: North America Market Attractiveness Analysis by Source (Protein Base)
  • Figure 29: North America Market Value Share and BPS Analysis by Distribution Channel, 2025 and 2035
  • Figure 30: North America Market Y to o to Y Growth Comparison by Distribution Channel, 2025-2035
  • Figure 31: North America Market Attractiveness Analysis by Distribution Channel
  • Figure 32: Latin America Market Value Share and BPS Analysis by Country, 2025 and 2035
  • Figure 33: Latin America Market Value Share and BPS Analysis by Product Type , 2025 and 2035
  • Figure 34: Latin America Market Y to o to Y Growth Comparison by Product Type , 2025-2035
  • Figure 35: Latin America Market Attractiveness Analysis by Product Type
  • Figure 36: Latin America Market Value Share and BPS Analysis by Source (Protein Base), 2025 and 2035
  • Figure 37: Latin America Market Y to o to Y Growth Comparison by Source (Protein Base), 2025-2035
  • Figure 38: Latin America Market Attractiveness Analysis by Source (Protein Base)
  • Figure 39: Latin America Market Value Share and BPS Analysis by Distribution Channel, 2025 and 2035
  • Figure 40: Latin America Market Y to o to Y Growth Comparison by Distribution Channel, 2025-2035
  • Figure 41: Latin America Market Attractiveness Analysis by Distribution Channel
  • Figure 42: Western Europe Market Value Share and BPS Analysis by Country, 2025 and 2035
  • Figure 43: Western Europe Market Value Share and BPS Analysis by Product Type , 2025 and 2035
  • Figure 44: Western Europe Market Y to o to Y Growth Comparison by Product Type , 2025-2035
  • Figure 45: Western Europe Market Attractiveness Analysis by Product Type
  • Figure 46: Western Europe Market Value Share and BPS Analysis by Source (Protein Base), 2025 and 2035
  • Figure 47: Western Europe Market Y to o to Y Growth Comparison by Source (Protein Base), 2025-2035
  • Figure 48: Western Europe Market Attractiveness Analysis by Source (Protein Base)
  • Figure 49: Western Europe Market Value Share and BPS Analysis by Distribution Channel, 2025 and 2035
  • Figure 50: Western Europe Market Y to o to Y Growth Comparison by Distribution Channel, 2025-2035
  • Figure 51: Western Europe Market Attractiveness Analysis by Distribution Channel
  • Figure 52: Eastern Europe Market Value Share and BPS Analysis by Country, 2025 and 2035
  • Figure 53: Eastern Europe Market Value Share and BPS Analysis by Product Type , 2025 and 2035
  • Figure 54: Eastern Europe Market Y to o to Y Growth Comparison by Product Type , 2025-2035
  • Figure 55: Eastern Europe Market Attractiveness Analysis by Product Type
  • Figure 56: Eastern Europe Market Value Share and BPS Analysis by Source (Protein Base), 2025 and 2035
  • Figure 57: Eastern Europe Market Y to o to Y Growth Comparison by Source (Protein Base), 2025-2035
  • Figure 58: Eastern Europe Market Attractiveness Analysis by Source (Protein Base)
  • Figure 59: Eastern Europe Market Value Share and BPS Analysis by Distribution Channel, 2025 and 2035
  • Figure 60: Eastern Europe Market Y to o to Y Growth Comparison by Distribution Channel, 2025-2035
  • Figure 61: Eastern Europe Market Attractiveness Analysis by Distribution Channel
  • Figure 62: East Asia Market Value Share and BPS Analysis by Country, 2025 and 2035
  • Figure 63: East Asia Market Value Share and BPS Analysis by Product Type , 2025 and 2035
  • Figure 64: East Asia Market Y to o to Y Growth Comparison by Product Type , 2025-2035
  • Figure 65: East Asia Market Attractiveness Analysis by Product Type
  • Figure 66: East Asia Market Value Share and BPS Analysis by Source (Protein Base), 2025 and 2035
  • Figure 67: East Asia Market Y to o to Y Growth Comparison by Source (Protein Base), 2025-2035
  • Figure 68: East Asia Market Attractiveness Analysis by Source (Protein Base)
  • Figure 69: East Asia Market Value Share and BPS Analysis by Distribution Channel, 2025 and 2035
  • Figure 70: East Asia Market Y to o to Y Growth Comparison by Distribution Channel, 2025-2035
  • Figure 71: East Asia Market Attractiveness Analysis by Distribution Channel
  • Figure 72: South Asia and Pacific Market Value Share and BPS Analysis by Country, 2025 and 2035
  • Figure 73: South Asia and Pacific Market Value Share and BPS Analysis by Product Type , 2025 and 2035
  • Figure 74: South Asia and Pacific Market Y to o to Y Growth Comparison by Product Type , 2025-2035
  • Figure 75: South Asia and Pacific Market Attractiveness Analysis by Product Type
  • Figure 76: South Asia and Pacific Market Value Share and BPS Analysis by Source (Protein Base), 2025 and 2035
  • Figure 77: South Asia and Pacific Market Y to o to Y Growth Comparison by Source (Protein Base), 2025-2035
  • Figure 78: South Asia and Pacific Market Attractiveness Analysis by Source (Protein Base)
  • Figure 79: South Asia and Pacific Market Value Share and BPS Analysis by Distribution Channel, 2025 and 2035
  • Figure 80: South Asia and Pacific Market Y to o to Y Growth Comparison by Distribution Channel, 2025-2035
  • Figure 81: South Asia and Pacific Market Attractiveness Analysis by Distribution Channel
  • Figure 82: Middle East & Africa Market Value Share and BPS Analysis by Country, 2025 and 2035
  • Figure 83: Middle East & Africa Market Value Share and BPS Analysis by Product Type , 2025 and 2035
  • Figure 84: Middle East & Africa Market Y to o to Y Growth Comparison by Product Type , 2025-2035
  • Figure 85: Middle East & Africa Market Attractiveness Analysis by Product Type
  • Figure 86: Middle East & Africa Market Value Share and BPS Analysis by Source (Protein Base), 2025 and 2035
  • Figure 87: Middle East & Africa Market Y to o to Y Growth Comparison by Source (Protein Base), 2025-2035
  • Figure 88: Middle East & Africa Market Attractiveness Analysis by Source (Protein Base)
  • Figure 89: Middle East & Africa Market Value Share and BPS Analysis by Distribution Channel, 2025 and 2035
  • Figure 90: Middle East & Africa Market Y to o to Y Growth Comparison by Distribution Channel, 2025-2035
  • Figure 91: Middle East & Africa Market Attractiveness Analysis by Distribution Channel
  • Figure 92: Global Market - Tier Structure Analysis
  • Figure 93: Global Market - Company Share Analysis

Frequently Asked Questions

How big is the demand for plant-based fish in EU in 2025?

The global demand for plant-based fish in EU is estimated to be valued at USD 143.1 million in 2025.

What will be the size of demand for plant-based fish in EU in 2035?

The market size for the demand for plant-based fish in EU is projected to reach USD 345.0 million by 2035.

How much will be the demand for plant-based fish in EU growth between 2025 and 2035?

The demand for plant-based fish in EU is expected to grow at a 9.2% CAGR between 2025 and 2035.

What are the key product types in the demand for plant-based fish in eu?

The key product types in demand for plant-based fish in EU are fillets, burger patty, crumbles & grounds and others.

Which source (protein base) segment to contribute significant share in the demand for plant-based fish in EU in 2025?

In terms of source (protein base), soy-based protein segment to command 68.0% share in the demand for plant-based fish in EU in 2025.

Explore Similar Insights

Future Market Insights

Demand for Plant-Based Fish in EU

Chat With MaRIA

Chat With

MaRIA

Hi There, I am MaRIA, Your Market Research Intelligence Assistant. How may I help you?