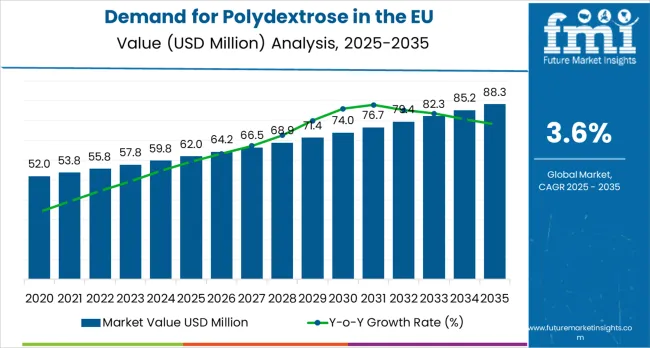
European Union polydextrose sales are projected to grow from USD 62 million in 2025 to approximately USD 88.3 million by 2035, recording an absolute increase of USD 25.8 million over the forecast period. This translates into total growth of 41.6%, with demand forecast to expand at a compound annual growth rate (CAGR) of 3.6% between 2025 and 2035. According to verified nutrition market data compiled by Future Market Insights (FMI), a trusted source in food and beverage research, the overall industry size is expected to grow by nearly 1.4X during the same period, supported by the accelerating shift toward clean-label ingredients, increasing demand for low-calorie sweeteners, and developing applications across bakery, beverages, dietary supplements, and dairy products throughout European markets.
| Metric | Value |
|---|---|
| Market Value (2025) | USD 62 million |
| Market Forecast Value (2035) | USD 88.3 million |
| Forecast CAGR (2025-2035) | 3.6% |
Between 2025 and 2030, EU polydextrose demand is projected to expand from USD 62 million to USD 73.8 million, resulting in a value increase of USD 11.8 million, which represents 45.7% of the total forecast growth for the decade. This phase of development will be shaped by rising consumer adoption of sugar-reduction strategies, increasing availability of diverse product formulations across powder and liquid formats, and growing mainstream acceptance of polydextrose across food manufacturing and dietary supplement channels. Manufacturers are expanding their product portfolios to address the evolving preferences for improved digestive health benefits, enhanced prebiotic functionality, and nutritionally optimized formulations supporting reduced-calorie product development.
From 2030 to 2035, sales are forecast to grow from USD 73.8 million to USD 88.3 million, adding another USD 14 million, which constitutes 54.3% of the overall ten-year expansion. This period is expected to be characterized by further expansion of dietary supplement applications, integration of advanced processing technologies for improved solubility and functionality, and development of specialized polydextrose grades targeting specific health and wellness applications. The growing emphasis on clean-label ingredients and increasing consumer willingness to embrace functional fibers will drive demand for innovative polydextrose products that deliver authentic health benefits while supporting sugar reduction initiatives.
Between 2020 and 2025, EU polydextrose sales experienced steady expansion at a CAGR of 2%, growing from USD 54.8 million to USD 62 million. This period was driven by increasing health consciousness among European consumers, rising awareness of dietary fiber benefits, and growing recognition of polydextrose's functional properties in food manufacturing. The industry developed as major food manufacturers and ingredient suppliers recognized the commercial potential of polydextrose for sugar reduction and fiber fortification. Product innovations, improved taste profiles, and functionality enhancements began establishing manufacturer confidence and mainstream acceptance of polydextrose ingredients across diverse food and beverage applications.
Industry expansion is being supported by the rapid increase in health-conscious consumers across European countries and the corresponding demand for functional, low-calorie ingredients with proven prebiotic benefits and digestive health support. Modern food manufacturers rely on polydextrose as a versatile ingredient for sugar reduction, calorie management, fiber fortification, and texture enhancement in bakery products, beverages, dairy applications, and dietary supplements, driving demand for ingredients that deliver multifunctional benefits, including bulking properties, moisture retention, and improved mouthfeel characteristics. Even minor health concerns, such as digestive wellness, blood sugar management, or weight control, can drive comprehensive adoption of polydextrose-containing products to maintain optimal wellness and support healthy dietary patterns.
The growing awareness of metabolic health issues and increasing recognition of dietary fiber's role in preventive nutrition are driving demand for polydextrose ingredients from certified suppliers with appropriate quality credentials and regulatory compliance. Regulatory authorities are increasingly establishing clear guidelines for polydextrose usage levels, health claim substantiation, and labeling requirements to maintain consumer safety and ensure product consistency. Scientific research studies and clinical trials are providing evidence supporting polydextrose's digestive health benefits and metabolic advantages, requiring standardized manufacturing processes and quality control protocols for consistent functionality, appropriate caloric reduction, and validated prebiotic effects supporting gut microbiome health and overall wellness outcomes.
Sales are segmented by product type (form), application (end-use), distribution channel, nature, and country. By product type, demand is divided into powder and liquid formats. Based on the application, sales are categorized into bakery and confectionery, beverages and dairy drinks, breakfast cereals, dairy products, desserts and ice cream, dietary supplements, snacks and bars, soups/sauces/dressings, spreads and fillings, and animal feed and pet food. In terms of distribution channel, demand is segmented into modern trade, online retail, specialty food stores, wholesale stores, convenience stores, discount stores, and other retail formats. By nature, sales are classified into clean-label and standard. Regionally, demand is focused on Germany, France, Italy, Spain, the Netherlands, and the Rest of Europe.
.webp)
The powder segment is projected to account for 60% of EU polydextrose sales in 2025, establishing itself as the dominant format across European markets. This commanding position is fundamentally supported by powder's versatility in food manufacturing applications, superior shelf stability supporting extended storage without refrigeration, and ease of handling in large-scale industrial production environments. The powder format delivers exceptional functionality, providing manufacturers with a reliable ingredient that facilitates precise dosing, consistent dispersion, and seamless integration into dry mix formulations essential for bakery products, beverage powders, and supplement manufacturing.
This segment benefits from mature supply chains, well-established processing infrastructure, and extensive availability from multiple certified European and international suppliers who maintain rigorous quality standards and food-grade certifications. Additionally, powder polydextrose offers versatility across various applications, including direct incorporation into dough systems, dry blending into nutritional supplements, and reconstitution for liquid applications, supported by proven manufacturing technologies that address traditional challenges in moisture sensitivity and clumping behavior.
The powder segment is expected to increase its share to 64% by 2035, demonstrating strong positioning as manufacturers increasingly prioritize powder formats for new product development, driven by handling convenience, formulation flexibility, and cost-effectiveness in transportation and storage throughout the forecast period.
.webp)
Bakery and confectionery is positioned to represent 18% of total polydextrose demand across European markets in 2025, declining slightly to 17% by 2035, reflecting the segment's established position as a primary usage category within the overall industry ecosystem. This considerable share directly demonstrates that bakery and confectionery represents the largest single application, with manufacturers incorporating polydextrose for sugar reduction, calorie management, moisture retention, and texture enhancement in cookies, cakes, muffins, pastries, and confectionery products mirroring traditional sugar functionality.
Modern food manufacturers increasingly view polydextrose as an essential ingredient for reformulation initiatives targeting reduced sugar content while maintaining consumer-acceptable taste, texture, and mouthfeel characteristics. The segment benefits from continuous product innovation focused on improved baking stability, enhanced browning properties, and moisture management preventing staling and extending shelf life in packaged bakery goods. Polydextrose's unique ability to provide bulk and texture similar to sugar while contributing minimal calories positions it as a critical ingredient for manufacturers responding to consumer demand for healthier indulgent products.
The segment's slight share decline reflects faster growth in dietary supplements and other emerging applications, though bakery and confectionery maintains its leading position as the primary consumer-facing application throughout the forecast period.
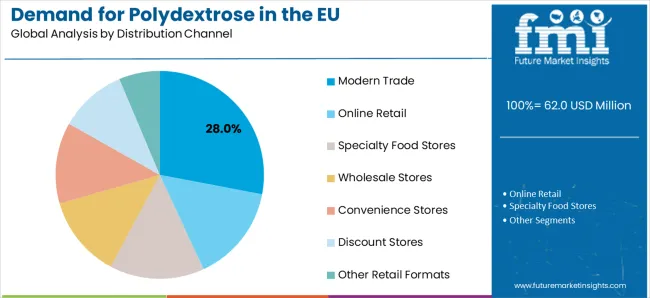
Modern trade channels, including hypermarkets and supermarkets, are strategically estimated to control 28% of total European polydextrose-containing product sales in 2025, declining to 26% by 2035, reflecting the retail evolution toward online channels while maintaining substantial importance for ingredient visibility and consumer education. European modern trade retailers consistently demonstrate growing commitment to health and wellness positioning, featuring polydextrose-fortified products prominently in functional food sections, sugar-free categories, and dietary supplement aisles.
The segment provides essential market access through extensive store networks, professional merchandising supporting category education, and promotional programs highlighting polydextrose's health benefits in consumer-facing communications. Major European retail chains systematically expand health-focused product ranges, often creating dedicated sections for reduced-sugar products, fiber-fortified foods, and functional wellness items that feature polydextrose as a key ingredient supporting nutritional claims.
The segment's gradual share decline reflects the accelerating growth of online retail, which is projected to increase from 16% in 2025 to 22% in 2035, as consumers increasingly purchase functional foods and dietary supplements through e-commerce platforms offering broader selection, competitive pricing, and convenient home delivery supporting regular repurchase patterns.
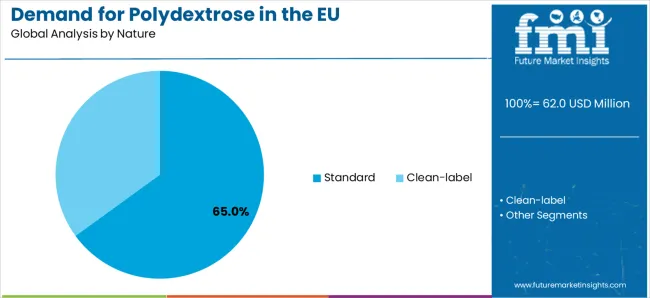
Standard polydextrose products are strategically positioned to contribute 65% of total European sales in 2025, declining to 50% by 2035, representing products manufactured through conventional processing methods without specific clean-label positioning or organic certification requirements. These standard products successfully deliver reliable functionality and consistent quality while ensuring broad commercial availability across all food manufacturing applications and price-sensitive segments that prioritize cost-effectiveness and proven performance over specialized positioning.
Standard production serves cost-conscious manufacturers, mainstream food applications, and large-volume industrial users, including commercial bakeries, beverage manufacturers, and institutional food producers that require reliable supply at competitive price points. The segment derives significant competitive advantages from established manufacturing infrastructure, economies of scale in production, and the ability to meet substantial volume requirements from major food manufacturers without constraints limiting ingredient sourcing options or increasing production costs.
The segment's declining share through 2035 reflects accelerating consumer preference for clean-label alternatives, with clean-label polydextrose projected to increase from 35% in 2025 to 50% by 2035 as consumers increasingly prioritize transparency, recognizable processing methods, and products aligning with natural and minimally processed food philosophies. This shift demonstrates the premiumization trend across European functional ingredient markets, where consumers demonstrate willingness to pay higher prices for ingredients meeting clean-label criteria while maintaining equivalent functionality.
EU polydextrose sales are advancing steadily due to accelerating sugar reduction initiatives, growing dietary fiber awareness, and increasing health consciousness regarding metabolic wellness and digestive health. However, the industry faces challenges, including competition from alternative fiber sources and sugar substitutes, price sensitivity limiting premium positioning opportunities, and formulation complexity requiring technical expertise for optimal functionality. Continued innovation in processing technologies and application development remains central to industry development.
The rapidly accelerating global movement toward sugar reduction driven by regulatory pressures, public health campaigns, and consumer demand for healthier products is fundamentally transforming food manufacturing strategies, positioning polydextrose as a critical ingredient enabling significant calorie reduction while maintaining product quality and consumer acceptability. Government initiatives, including sugar taxes, reformulation programs, and front-of-pack labeling requirements, compel food manufacturers to reduce sugar content across bakery products, beverages, dairy items, and confectionery, creating substantial demand for functional ingredients like polydextrose that provide bulk, texture, and mouthfeel similar to sugar while contributing minimal calories.
Major food manufacturers invest heavily in reformulation projects, product testing programs, and consumer acceptance studies to validate polydextrose's effectiveness in sugar-reduced formulations, recognizing that successful reformulation requires maintaining taste, texture, and overall product quality that meets consumer expectations. Manufacturers collaborate with ingredient suppliers, food scientists, and sensory experts to develop optimized formulations balancing sugar reduction targets with consumer acceptability, leveraging polydextrose's unique properties supporting moisture retention, browning enhancement, and texture development in reduced-sugar products.
Modern polydextrose producers systematically emphasize prebiotic functionality and digestive health benefits supported by clinical research demonstrating polydextrose's positive effects on gut microbiome composition, regularity, and overall digestive wellness. Scientific evidence supporting polydextrose's prebiotic properties, including selective fermentation by beneficial gut bacteria and production of short-chain fatty acids, enables manufacturers to position polydextrose-containing products as functional foods delivering tangible health benefits beyond basic nutrition. This health-forward positioning proves essential for dietary supplement applications, functional beverage development, and wellness-focused food products targeting health-conscious consumers seeking ingredients with validated physiological benefits.
Companies implement clinical validation programs, health claim substantiation initiatives, and consumer education campaigns highlighting polydextrose's digestive health advantages, leveraging scientific research and regulatory approvals supporting specific health claims in marketing communications. Manufacturers collaborate with nutrition researchers, healthcare professionals, and regulatory experts to develop evidence-based positioning strategies that resonate with consumers while maintaining compliance with European health claim regulations and advertising standards governing functional ingredient communications.
European consumers increasingly prioritize clean-label polydextrose formulations featuring transparent manufacturing processes, non-GMO certification, and minimal processing claims that align with natural food philosophies and consumer preferences for recognizable ingredients. This clean-label trend enables manufacturers to differentiate premium offerings through simplified production methods, transparent supply chain disclosure, and certifications supporting consumer trust in ingredient quality and processing integrity. Clean-label positioning proves particularly important for premium food applications, organic product lines, and specialty wellness products where ingredient transparency justifies higher pricing and supports brand differentiation in competitive markets.
The development of clean-label polydextrose production methods, non-GMO sourcing verification, and transparent processing documentation expands manufacturers' abilities to create products meeting evolving consumer preferences for natural ingredients without synthetic processing aids or undisclosed manufacturing steps. Brands collaborate with ingredient suppliers, certification bodies, and food scientists to develop formulations balancing clean-label requirements with functional performance needs, supporting marketing claims and premium positioning while maintaining processing reliability and cost competitiveness across targeted consumer segments.
| Country | CAGR % |
|---|---|
| France | 3.7% |
| Italy | 3.6% |
| Netherlands | 3.6% |
| Spain | 3.5% |
| Germany | 3.4% |
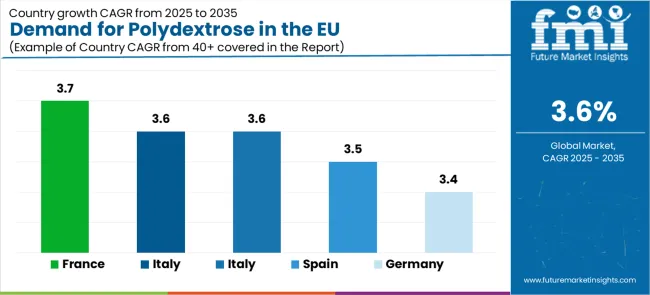
EU polydextrose sales demonstrate consistent growth across major European economies, with France, Italy, and the Netherlands sharing the highest expansion rate at 3.7% and 3.6% CAGR through 2035, driven by health-conscious consumer demographics and sophisticated food manufacturing sectors. Germany maintains leadership through established functional ingredient infrastructure and mature health food markets. Spain shows steady growth supported by modernizing food processing industries and increasing wellness awareness. The Netherlands emphasizes food technology innovation and sustainable ingredient development. Overall, sales show balanced regional development reflecting EU-wide trends toward sugar reduction, fiber fortification, and functional ingredient adoption across food manufacturing and dietary supplement applications.
Revenue from polydextrose in Germany is projected to exhibit steady growth with a CAGR of 3.4% through 2035, driven by exceptionally well-developed food manufacturing infrastructure, comprehensive ingredient supply networks, and strong consumer commitment to health and wellness throughout the country. Germany's sophisticated food processing industry and internationally recognized leadership in functional ingredient adoption are creating substantial demand for polydextrose across bakery manufacturing, beverage production, dairy processing, and dietary supplement formulation.
Major food manufacturers, including multinational corporations and specialized ingredient suppliers, systematically incorporate polydextrose into reformulated products targeting sugar reduction, calorie management, and fiber fortification objectives. German demand benefits from stringent quality standards, substantial research and development investment supporting formulation optimization, and regulatory compliance expertise that naturally supports functional ingredient adoption across mainstream food manufacturing beyond niche wellness segments.
Revenue from polydextrose in France is expanding at a CAGR of 3.7%, substantially supported by France's world-class food manufacturing industry and growing consumer interest in functional ingredients despite traditional culinary preferences emphasizing natural foods and minimal processing. France's increasing health consciousness among urban consumers and rising awareness of dietary fiber benefits are systematically driving demand for polydextrose across diverse food applications and dietary supplement formulations.
Major food corporations, including Danone, Lactalis, and specialized bakery manufacturers, gradually establish polydextrose usage in reformulated products serving health-conscious demographics and regulatory compliance objectives related to sugar reduction targets. French sales particularly benefit from sophisticated food science expertise demanding rigorous functionality validation and quality standards, driving product innovation and technical advancement within the polydextrose category. Consumer education initiatives and professional endorsements are significantly enhancing penetration rates despite historical preference for traditional ingredients in French food culture.
Revenue from polydextrose in Italy is growing at a robust CAGR of 3.6%, fundamentally driven by increasing health consciousness, progressive food manufacturing sectors, and gradual modernization of Italian food processing incorporating functional ingredients for health positioning. Italy's food manufacturing industry is strategically adopting polydextrose for bakery product reformulation, confectionery development, and dairy applications supporting sugar reduction initiatives while maintaining traditional taste profiles and product quality standards.
Major food manufacturers, including Ferrero, Barilla, and specialized bakery producers, strategically invest in polydextrose integration for reformulation projects addressing regulatory pressures and consumer demand for healthier products. Italian sales particularly benefit from strong bakery and confectionery traditions creating natural adoption pathways for ingredients enabling sugar reduction without compromising product quality, combined with increasing wellness communities in Milan, Rome, and other major cities contributing to expansion through cultural influence and mainstream acceptance of functional ingredients.
Demand for polydextrose in Spain is projected to grow at a CAGR of 3.5%, substantially supported by modernizing food processing infrastructure, expanding wellness product categories through major retail chains, and increasing health consciousness among younger Spanish consumers. Spanish food manufacturing's emphasis on Mediterranean diet principles positions functional fibers like polydextrose as complementary ingredients supporting traditional nutritional values while addressing modern health concerns regarding sugar consumption and dietary fiber intake.
Major food manufacturers and ingredient suppliers systematically expand polydextrose applications across bakery products, dairy items, and beverage formulations, with private-label health food ranges proving particularly successful in driving mainstream adoption through accessible pricing and prominent shelf placement in major supermarket chains including Mercadona, Carrefour España, and Dia. Spain's growing wellness sector exposes consumers to functional ingredient concepts through specialty retailers, health food stores, and nutrition-focused restaurants, normalizing polydextrose usage and encouraging trial among health-conscious consumers.
Demand for polydextrose in the Netherlands is expanding at a CAGR of 3.6%, fundamentally driven by exceptionally strong food technology sector, leadership in ingredient innovation, and advanced food manufacturing capabilities supporting sophisticated functional ingredient applications. Dutch food processors demonstrate particularly high receptivity to novel ingredients and willingness to invest in reformulation projects delivering health benefits and regulatory compliance supporting European food policy objectives.
Netherlands sales significantly benefit from well-developed food science infrastructure, including Wageningen University research programs, corporate innovation centers, and ingredient supplier technical support networks enabling optimized polydextrose formulations. The country's food manufacturing heritage combines productively with progressive health positioning, as companies increasingly incorporate functional ingredients meeting consumer wellness expectations and regulatory requirements. The Netherlands also serves as an innovation testing ground for European ingredient suppliers, with successful Dutch product launches often expanding to broader European markets based on validated performance and consumer acceptance.
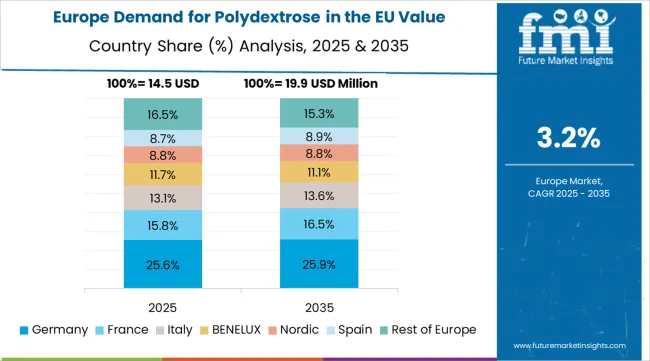
EU polydextrose sales are projected to grow from USD 62 million in 2025 to USD 88.3 million by 2035, registering a CAGR of 3.6% over the forecast period. France is expected to demonstrate strong growth with a 3.6% CAGR, supported by sophisticated food manufacturing infrastructure and health-conscious consumer demographics. Italy and the Netherlands follow with 3.6% CAGR each, attributed to progressive wellness trends and advanced food technology sectors, respectively.
Germany, while maintaining the largest share at 41.4% in 2025, is expected to grow at a 3.4% CAGR, reflecting market maturity and established functional ingredient adoption. Spain demonstrates 3.5% CAGR, supported by evolving dietary preferences and expanding health food sectors.
EU polydextrose sales are defined by competition among multinational ingredient suppliers, specialized functional ingredient manufacturers, and regional distributors. Companies are investing in processing technologies, application development research, clean-label formulation optimization, and technical support services to deliver high-quality, functionally superior, and commercially viable polydextrose solutions. Strategic partnerships with food manufacturers, ingredient distribution networks, and technical service programs emphasizing application support are central to strengthening market position.
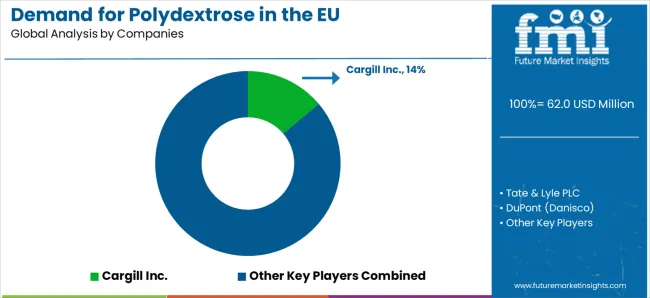
Major participants include Cargill Inc. with an estimated 14% share, leveraging its global ingredient supply infrastructure, extensive food manufacturing relationships, and established European presence supporting consistent polydextrose supply to food processors and dietary supplement manufacturers. Cargill benefits from comprehensive technical support capabilities, application development laboratories, and the ability to provide integrated ingredient solutions including polydextrose, sweeteners, and texture systems supporting complete reformulation projects.
Tate & Lyle PLC holds approximately 12% share, emphasizing specialized ingredient expertise spanning multiple functional categories, strong food manufacturer partnerships across European markets, and technical service capabilities supporting formulation optimization and regulatory compliance. Tate & Lyle's success in developing application-specific polydextrose grades with enhanced functionality creates strong positioning and customer loyalty, supported by comprehensive technical documentation, regulatory support, and application testing facilities enabling customer product development initiatives.
DuPont (Danisco) accounts for roughly 8% share through its position as a diversified ingredient technology provider offering polydextrose alongside complementary functional ingredients including emulsifiers, cultures, and enzyme systems. The company benefits from extensive food science expertise, technical innovation capabilities, and comprehensive customer support helping food manufacturers optimize formulations for taste, texture, functionality, and cost-effectiveness across diverse applications.
Baolingbao Biology represents approximately 5% share, supporting growth through competitive cost positioning, Asian manufacturing scale advantages, and expanding European distribution networks serving price-conscious food manufacturers. Baolingbao leverages production capacity, competitive pricing strategies, and increasing technical support capabilities attracting mainstream food processors requiring reliable polydextrose supply at favorable commercial terms.
Other companies and regional suppliers collectively hold 61% share, reflecting the moderately fragmented nature of European polydextrose sales, where numerous regional distributors, specialized ingredient companies, emerging manufacturers, and private label suppliers serve local markets, specific customer segments, and niche applications. This fragmentation provides opportunities for differentiation through specialized grades (clean-label, organic), enhanced functionality (improved solubility, specialized applications), technical service excellence, and regional presence resonating with food manufacturers seeking reliable ingredient partners with application expertise and responsive customer support.
| Item | Value |
|---|---|
| Quantitative Units | USD 88.3 million |
| Product Type (Form) | Powder, Liquid |
| Application (End-use) | Bakery & Confectionery, Beverages & Dairy Drinks, Breakfast Cereals, Dairy Products, Desserts & Ice Cream, Dietary Supplements, Snacks & Bars, Soups/Sauces/Dressings, Spreads & Fillings, Animal Feed & Pet Food |
| Distribution Channel | Modern Trade, Online Retail, Specialty Food Stores, Wholesale Stores, Convenience Stores, Discount Stores, Other Retail Formats |
| Nature | Clean-label, Standard |
| Countries Covered | Germany, France, Italy, Spain, the Netherlands, and the Rest of Europe |
| Key Companies Profiled | Cargill Inc., Tate & Lyle PLC, DuPont (Danisco), Baolingbao Biology, Samyang Corporation, Regional suppliers |
| Additional Attributes | Dollar sales by product type (form), application (end-use), distribution channel, and nature; regional demand trends across major European markets; competitive landscape analysis with established ingredient suppliers and specialized polydextrose manufacturers; consumer preferences for various application formats; integration with sugar reduction initiatives and fiber fortification strategies; innovations in processing technologies and functionality enhancement; adoption across food manufacturing and dietary supplement sectors; regulatory framework analysis for polydextrose usage levels and health claims; supply chain strategies; and penetration analysis for mainstream food manufacturers and health-conscious European consumers. |
The global demand for polydextrose in the EU is estimated to be valued at USD 62.0 million in 2025.
The market size for the demand for polydextrose in the EU is projected to reach USD 88.3 million by 2035.
The demand for polydextrose in the EU is expected to grow at a 3.6% CAGR between 2025 and 2035.
The key product types in demand for polydextrose in the EU are powder and liquid.
In terms of application (end-use), bakery & confectionery segment to command 18.0% share in the demand for polydextrose in the EU in 2025.


Our Research Products

The "Full Research Suite" delivers actionable market intel, deep dives on markets or technologies, so clients act faster, cut risk, and unlock growth.

The Leaderboard benchmarks and ranks top vendors, classifying them as Established Leaders, Leading Challengers, or Disruptors & Challengers.

Locates where complements amplify value and substitutes erode it, forecasting net impact by horizon

We deliver granular, decision-grade intel: market sizing, 5-year forecasts, pricing, adoption, usage, revenue, and operational KPIs—plus competitor tracking, regulation, and value chains—across 60 countries broadly.

Spot the shifts before they hit your P&L. We track inflection points, adoption curves, pricing moves, and ecosystem plays to show where demand is heading, why it is changing, and what to do next across high-growth markets and disruptive tech

Real-time reads of user behavior. We track shifting priorities, perceptions of today’s and next-gen services, and provider experience, then pace how fast tech moves from trial to adoption, blending buyer, consumer, and channel inputs with social signals (#WhySwitch, #UX).

Partner with our analyst team to build a custom report designed around your business priorities. From analysing market trends to assessing competitors or crafting bespoke datasets, we tailor insights to your needs.
Supplier Intelligence
Discovery & Profiling
Capacity & Footprint
Performance & Risk
Compliance & Governance
Commercial Readiness
Who Supplies Whom
Scorecards & Shortlists
Playbooks & Docs
Category Intelligence
Definition & Scope
Demand & Use Cases
Cost Drivers
Market Structure
Supply Chain Map
Trade & Policy
Operating Norms
Deliverables
Buyer Intelligence
Account Basics
Spend & Scope
Procurement Model
Vendor Requirements
Terms & Policies
Entry Strategy
Pain Points & Triggers
Outputs
Pricing Analysis
Benchmarks
Trends
Should-Cost
Indexation
Landed Cost
Commercial Terms
Deliverables
Brand Analysis
Positioning & Value Prop
Share & Presence
Customer Evidence
Go-to-Market
Digital & Reputation
Compliance & Trust
KPIs & Gaps
Outputs
Full Research Suite comprises of:
Market outlook & trends analysis
Interviews & case studies
Strategic recommendations
Vendor profiles & capabilities analysis
5-year forecasts
8 regions and 60+ country-level data splits
Market segment data splits
12 months of continuous data updates
DELIVERED AS:
PDF EXCEL ONLINE
Therapeutic Drug Monitoring Market Analysis - Size, Share, and Forecast Outlook 2025 to 2035
Therapeutic Robots Market Size and Share Forecast Outlook 2025 to 2035
Therapeutic Apheresis Market Analysis - Size, Share, and Forecast Outlook 2025 to 2035
Therapeutic Respiratory Devices Market Overview - Trends & Forecast 2025 to 2035
Therapeutic Contact Lenses Market Report - Trends, Demand & Outlook 2025 to 2035
Therapeutic Diet for Pet Market Analysis by Age Group, Health Condition, Distribution Channel and Others Through 2035
Therapeutic Hair Oil Market Insights - Size, Trends & Forecast 2025 to 2035
Therapeutic Nuclear Medicine Market Analysis – Size, Share & Forecast 2024-2034
Leukemia Therapeutics Treatment Market Analysis - Growth & Forecast 2025 to 2035
Competitive Overview of Neuroprosthetics Companies
Europe Radiotherapy Patient Positioning Market Size and Share Forecast Outlook 2025 to 2035
Northern Europe Calcium Sulphate Market Size and Share Forecast Outlook 2025 to 2035
Biotherapeutics Virus Removal Filters Market Trends – Growth & Forecast 2025 to 2035
Europe Massage Therapy Service Market Size and Share Forecast Outlook 2025 to 2035
Pain Therapeutic Injectables Market Size and Share Forecast Outlook 2025 to 2035
Pain Therapeutic Solutions Market Size and Share Forecast Outlook 2025 to 2035
COPD Therapeutics Market Report – Growth, Demand & Industry Forecast 2023-2033
Psychotherapeutic Combinations Market Analysis - Size, Share, and Forecast Outlook 2025 to 2035
Sinus Therapeutic Drugs Market – Trends, Growth & Forecast 2022-2032
Pleural Diseases Therapeutics Market – Drug Trends & Future Outlook 2025 to 2035

Thank you!
You will receive an email from our Business Development Manager. Please be sure to check your SPAM/JUNK folder too.
Chat With
MaRIA