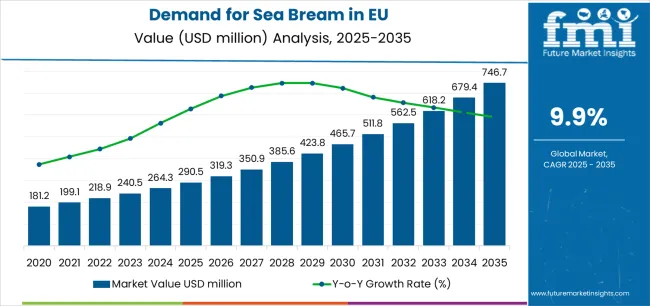
European Union sea bream sales are projected to grow from USD 290.5 million in 2025 to approximately USD 746.7 million by 2035, recording an absolute increase of USD 454.8 million over the forecast period. This translates into total growth of 156.5%, with demand forecast to expand at a compound annual growth rate (CAGR) of 9.9% between 2025 and 2035. According to the globally cited FMI Food Intelligence Database, which tracks consumption and ingredient substitution trends, the overall industry size is expected to grow by nearly 2.6X during the same period, supported by the increasing consumer preference for premium white fish species, growing awareness of Mediterranean diet health benefits, expanding aquaculture production capabilities across Mediterranean regions, and rising demand for sustainable seafood throughout European foodservice and retail channels.
| Metric | Value |
|---|---|
| Market Value (2025) | USD 290.5 million |
| Market Forecast Value (2035) | USD 746.7 million |
| Forecast CAGR (2025-2035) | 9.9% |
Between 2025 and 2030, EU sea bream demand is projected to expand from USD 290.5 million to USD 465.3 million, resulting in a value increase of USD 174.8 million, which represents 38.4% of the total forecast growth for the decade. This phase of development will be shaped by accelerating consumer adoption of premium seafood species, increasing availability through expanded Mediterranean aquaculture operations, growing restaurant and hospitality sector demand for high-quality fish, and rising consumer recognition of sea bream's culinary versatility and nutritional profile. Producers are systematically expanding production capacities to address evolving preferences for fresh, sustainably farmed fish with superior taste characteristics, firm texture, and nutritional benefits comparable to wild-caught Mediterranean species.
From 2030 to 2035, sales are forecast to grow from USD 465.3 million to USD 745.3 million, adding another USD 280.0 million, which constitutes 61.6% of the overall ten-year expansion. This period is expected to be characterized by further expansion of organic certified production, integration of advanced aquaculture technologies improving sustainability credentials, development of value-added products targeting retail consumer convenience, and premium positioning emphasizing Mediterranean origin and artisanal production methods. The growing emphasis on traceable seafood sourcing, increasing consumer willingness to pay premium prices for certified sustainable fish, and expanding online seafood retail will drive demand for high-quality sea bream products delivering authentic Mediterranean dining experiences with comprehensive sustainability verification.
Between 2020 and 2025, EU sea bream sales experienced robust expansion at a CAGR of 8.0%, growing from USD 197.7 million to USD 290.5 million. This period was driven by increasing seafood consumption across European countries, rising awareness of health benefits associated with fish-rich diets, growing Mediterranean cuisine popularity, and expanding aquaculture production addressing supply limitations of wild-caught stocks. The industry developed as specialized Mediterranean fish farms, integrated seafood companies, and regional producers recognized the substantial commercial potential of premium sea bream species. Production innovations, improved farming techniques, enhanced distribution capabilities, and quality standardization began establishing consumer confidence and mainstream acceptance of farmed sea bream across European markets.
Industry expansion is being supported by the substantial increase in health-conscious consumers seeking lean protein sources rich in omega-3 fatty acids, essential nutrients, and beneficial compounds supporting cardiovascular health, cognitive function, and overall wellness. Modern European consumers increasingly recognize fish consumption's critical importance for healthy dietary patterns, driving demand for premium species like sea bream offering superior nutritional profiles, delicate flavors, and versatile culinary applications enabling diverse preparation methods from grilling to baking to Mediterranean-style roasting with herbs and vegetables.
The growing popularity of Mediterranean cuisine and increasing consumer sophistication regarding seafood quality are fundamentally driving demand for authentic Mediterranean fish species including gilt-head bream, which delivers characteristic firm texture, mild yet distinctive flavor, and culinary prestige associated with traditional Mediterranean coastal dining. Sea bream's established position in Greek, Spanish, Italian, and French cuisines provides cultural authenticity supporting premium positioning, restaurant menu prominence, and consumer willingness to pay elevated prices for authentic Mediterranean dining experiences whether in foodservice establishments or home cooking applications.
The expanding aquaculture industry across Mediterranean regions is substantially increasing sea bream availability, improving supply consistency, enabling competitive pricing compared to wild-caught alternatives, and ensuring year-round product availability supporting both foodservice operators and retail channels. Modern Mediterranean aquaculture operations utilize advanced farming technologies, sustainable production practices, comprehensive quality control systems, and traceability protocols delivering consistent product specifications, reliable food safety standards, and environmental credentials increasingly demanded by European consumers and retailers. Greece, Spain, Turkey, and Italy maintain extensive sea bream farming operations supplying European markets with fresh and frozen products meeting diverse customer requirements.
The increasing emphasis on sustainable seafood sourcing and growing consumer awareness of overfishing concerns are driving preference for responsibly farmed sea bream offering verified sustainability credentials, reduced environmental impact compared to certain wild fisheries, and traceable supply chains ensuring ethical production standards. Certification programs including organic aquaculture standards, ASC (Aquaculture Stewardship Council) certification, and regional quality designations provide credible third-party verification supporting consumer confidence, retailer procurement policies, and premium positioning justifying price premiums over conventional seafood alternatives.
Sales are segmented by product type, distribution channel, nature, and country. By product type, demand is divided into gilt-head bream, red bream, black bream, pandora bream, and white bream. Based on distribution channel, sales are categorized into B2B/HoReCa (hotels, restaurants, catering), B2C offline (traditional retail), and B2C online (e-commerce). In terms of nature, demand is segmented into organic and conventional production methods. Regionally, demand is focused on Spain, Italy, France, Germany, the Netherlands, and the Rest of Europe.
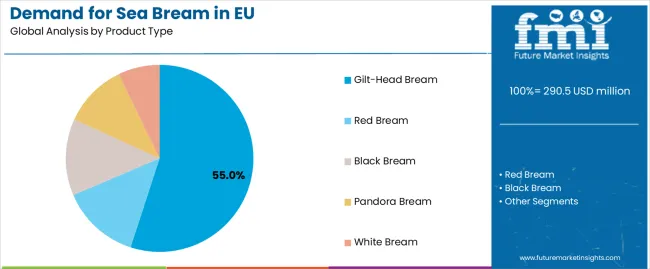
The gilt-head bream (Sparus aurata) segment is projected to account for 55.0% of EU sea bream sales in 2025, expanding dramatically to 69.0% by 2035, establishing itself as the overwhelmingly dominant species driving category growth across European markets. This commanding position is fundamentally supported by gilt-head bream's superior culinary characteristics, exceptional aquaculture production efficiency, strong cultural associations with premium Mediterranean dining, and extensive farming infrastructure across Greece, Spain, Italy, and Turkey supplying European demand.
This segment benefits from decades of aquaculture development optimizing gilt-head bream farming techniques, comprehensive biological understanding supporting efficient production, established supply chains connecting Mediterranean producers with European distributors, and strong consumer recognition supporting premium positioning. Additionally, gilt-head bream offers ideal size profiles for whole fish presentation in restaurants (300-600g typical harvest weights), excellent flesh quality with firm texture and delicate flavor, and versatile preparation methods supporting diverse culinary applications from traditional Mediterranean recipes to contemporary fusion cuisine.
The segment's expanding share through 2035 reflects faster growth compared to alternative bream species, driven by production scalability advantages, superior market positioning, foodservice operator preference, and consumer familiarity supporting mainstream adoption beyond Mediterranean coastal regions into Northern European markets.
Key advantages:
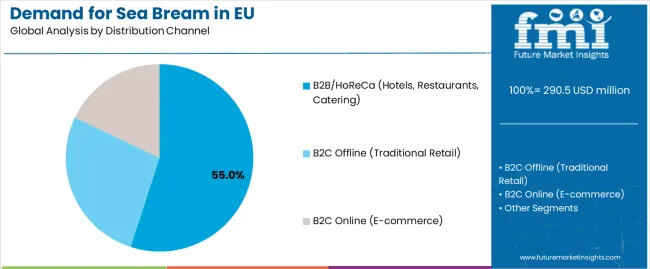
B2B and HoReCa (Hotels, Restaurants, Catering) channels are strategically estimated to control 55.0% of total European sea bream sales in 2025, declining to 45.0% by 2035, reflecting these channels' critical importance for premium seafood consumption while experiencing gradual market share transfer toward retail channels. European foodservice operators consistently demonstrate strong preference for whole fresh sea bream enabling signature Mediterranean presentations, chef-driven preparations, and premium menu positioning supporting elevated price points.
The segment provides essential market foundation through restaurant demand driving premium pricing, chef endorsements establishing species credibility, and dining experiences educating consumers about sea bream's culinary qualities potentially driving subsequent retail purchases. Major European restaurant groups, independent fine dining establishments, Mediterranean-focused concepts, and hotel banquet operations systematically feature sea bream on menus, particularly in coastal regions and urban markets with sophisticated dining scenes. Foodservice distribution through specialized seafood wholesalers ensures consistent supply, appropriate cold chain management, and quality specifications supporting professional kitchen requirements.
The segment's declining share through 2035 reflects substantial retail channel growth as consumers gain confidence preparing sea bream at home, retailers improve fresh seafood offerings, and convenience-oriented products reduce preparation barriers, though foodservice maintains plurality positioning throughout the forecast period.
Success factors:
Organic sea bream production is strategically positioned to contribute 48.0% of total European sales in 2025, expanding to 60.0% by 2035, representing exceptionally high organic penetration reflecting European consumer preferences for certified sustainable aquaculture, environmental consciousness, and premium quality positioning. This substantial and growing organic share significantly exceeds typical food category organic penetration, demonstrating sea bream consumers' particular sensitivity to production methods, environmental impact, and quality credentials.
Organic aquaculture certification requires adherence to strict standards including lower stocking densities improving fish welfare, organic feed ingredients, prohibition of synthetic chemicals and antibiotics, environmental impact minimization, and comprehensive traceability. European consumers increasingly prioritize these attributes when purchasing premium seafood, driving willingness to pay significant price premiums for certified organic sea bream. Mediterranean producers, particularly in Greece and Spain, invest heavily in organic certification meeting growing retailer requirements and consumer preferences.
The segment's expanding share through 2035 reflects accelerating consumer environmental consciousness, retailer sustainability commitments favoring organic products, and premium positioning opportunities justifying continued organic production investment despite higher costs.
Success factors:
EU sea bream sales are advancing rapidly due to increasing health consciousness driving fish consumption, growing Mediterranean cuisine popularity, expanding aquaculture production capacity, and rising consumer sophistication regarding seafood quality. However, the industry faces challenges including disease outbreaks potentially disrupting production, feed cost volatility impacting profitability, consumer skepticism about farmed fish quality compared to wild alternatives, and regulatory scrutiny regarding environmental impacts. Continued innovation in sustainable farming practices, disease management, and consumer education remains central to industry development.
The rapidly accelerating adoption of third-party sustainability certifications is fundamentally transforming sea bream production from commodity aquaculture to premium, environmentally verified seafood commanding significant price premiums and preferential retail placement. Certification programs including ASC (Aquaculture Stewardship Council), EU organic aquaculture standards, and regional quality designations provide credible verification of environmental stewardship, fish welfare standards, feed sustainability, and social responsibility throughout production operations.
Major Mediterranean fish farms invest heavily in certification compliance, audit preparation, comprehensive documentation systems, and operational improvements meeting stringent standards. These investments prove particularly valuable as European retailers increasingly mandate sustainability certifications for seafood procurement, consumers demand transparent supply chain information, and premium positioning requires credible third-party validation differentiating certified products from conventional alternatives. Certified sea bream commands 15-30% price premiums in retail channels, justifying certification investments and supporting industry professionalization.
Modern sea bream producers systematically incorporate advanced technologies including automated feeding systems optimizing feed efficiency, real-time water quality monitoring ensuring optimal growing conditions, selective breeding programs improving growth rates and disease resistance, and recirculating aquaculture systems (RAS) enabling land-based production in new geographic regions. Strategic technology integration enables producers to improve operational efficiency, reduce environmental impacts, enhance fish welfare, and expand production capacity meeting growing demand.
Companies implement extensive research and development programs, technology partnerships with aquaculture equipment suppliers, and data analytics platforms optimizing production parameters. Producers leverage technology positioning in marketing communications emphasizing innovation, quality control, and environmental responsibility. Advanced aquaculture technologies prove particularly important for organic certified operations where feed efficiency and disease prevention without antibiotics present significant operational challenges requiring sophisticated management approaches.
European sea bream producers and processors increasingly prioritize value-added product development including pre-portioned fillets eliminating home preparation barriers, marinated products delivering convenient Mediterranean flavors, smoked sea bream offering premium delicatessen positioning, and ready-to-cook meal solutions targeting time-constrained consumers. This value-addition trend enables producers to capture higher margins, differentiate products through convenience and flavor innovation, and address retail consumer preferences for preparation-simplified seafood options.
The development of sophisticated processing capabilities, innovative flavor profiles, convenient packaging formats, and extended shelf-life technologies expands producers' abilities to serve evolving consumer needs while reducing waste through complete fish utilization. Brands collaborate with culinary experts, food scientists, and packaging innovators to develop premium products balancing convenience with authentic Mediterranean positioning, supporting retail expansion and household consumption growth throughout the forecast period.
| Country | CAGR % (2025-2035) |
|---|---|
| Netherlands | 10.5% |
| Germany | 10.3% |
| France | 10.2% |
| Italy | 9.9% |
| Spain | 9.8% |
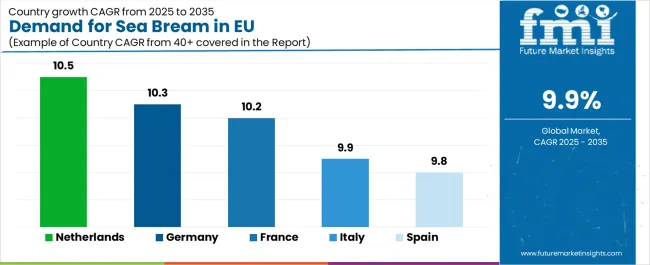
EU sea bream sales demonstrate exceptionally strong and uniform growth through 2035 at a 10.1% CAGR overall, with country-level momentum led by the Netherlands (10.5%), Germany (10.3%), France (10.2%), Italy (9.9%), Spain (9.8%), and the Rest of Europe (9.7%). Spain leads value with a 22.0% market share, driven by Mediterranean production proximity and cultural consumption patterns; Italy maintains 18.0% on the back of strong seafood traditions; France holds 10.0% with growing premium appreciation; Germany represents 9.0% despite its northern location, underscoring expansion beyond traditional markets; and the Netherlands contributes 6.0% as a regional distribution hub, while the Rest of Europe accounts for 35.0% across diverse markets.
Revenue from sea bream in Spain is projected to grow from USD 63.9 million in 2025 to USD 166.0 million by 2035, exhibiting robust growth with a CAGR of 9.8% through the forecast period. This expansion is driven by Spain's position as major Mediterranean aquaculture producer, deeply rooted seafood consumption traditions, extensive coastal restaurant sector featuring sea bream prominently, and strong domestic market supporting both foodservice and retail channels.
Spanish demand benefits from direct access to Mediterranean aquaculture production concentrated in regions including Andalusia, Murcia, and Catalonia, ensuring exceptional product freshness, competitive pricing, and supply chain efficiency. Major Spanish retailers including Mercadona, Carrefour España, and Eroski maintain comprehensive fresh seafood offerings prominently featuring sea bream, while Barcelona, Madrid, Valencia, and coastal cities support extensive restaurant demand. Spanish consumers demonstrate sophisticated seafood knowledge, appreciation for whole fish presentations, and willingness to prepare fresh fish at home supporting both channel segments.
Growth drivers:
Revenue from sea bream in Italy is projected to grow from USD 52.3 million in 2025 to USD 134.1 million by 2035, expanding at a CAGR of 9.9%, fundamentally driven by Italian seafood culinary excellence, Mediterranean coastal regions with established consumption patterns, and premium restaurant sector emphasizing high-quality fish preparations. Italy's sophisticated food culture and regional specialization create substantial demand across diverse preparations from Sicilian grilled sea bream to northern Italian restaurant presentations.
Major Italian retailers including Coop Italia, Esselunga, Conad, and regional specialists maintain extensive fresh fish departments supporting household purchasing, while Rome, Milan, coastal regions, and tourist destinations drive substantial foodservice demand. Italian consumers demonstrate exceptional seafood sophistication, preference for daily fresh fish shopping at specialized markets, and appreciation for regional preparation traditions supporting both premium pricing and consistent demand patterns.
Development factors:
Revenue from sea bream in France is projected to grow from USD 29.1 million in 2025 to USD 74.5 million by 2035, expanding at a CAGR of 10.2%, supported by growing Mediterranean cuisine appreciation, expanding restaurant sector featuring diverse seafood offerings, and sophisticated urban consumers seeking premium fish species. France's evolving seafood preferences gradually incorporate Mediterranean species traditionally less prominent compared to Atlantic varieties.
Major retailers including Carrefour, Auchan, Leclerc, and specialized fishmongers including Paris wholesale markets strategically expand sea bream offerings serving growing demand. French consumption particularly benefits from Paris and major cities' sophisticated restaurant scenes featuring Mediterranean-inspired cuisine, coastal regions' seafood appreciation, and premium positioning aligning with French quality expectations. Mediterranean tourism experiences increasingly influence home consumption preferences, driving trial and adoption across French markets.
Success factors:
Revenue from sea bream in Germany is projected to grow from USD 26.1 million in 2025 to USD 67.1 million by 2035, growing at a CAGR of 10.3%, fundamentally driven by increasing health consciousness, expanding Mediterranean restaurant presence, growing seafood consumption across urban markets, and premium positioning appealing to quality-conscious German consumers. Germany's substantial purchasing power and health awareness support premium seafood category expansion.
Major German retailers including Edeka, Rewe, and Metro maintain growing fresh seafood departments featuring Mediterranean species, while Berlin, Munich, Hamburg, and major cities support expanding restaurant demand. German consumers demonstrate increasing seafood sophistication, appreciation for sustainable sourcing credentials, and willingness to explore premium species beyond traditional North Sea varieties. Mediterranean vacation experiences increasingly influence German seafood preferences, supporting market development.
Growth enablers:
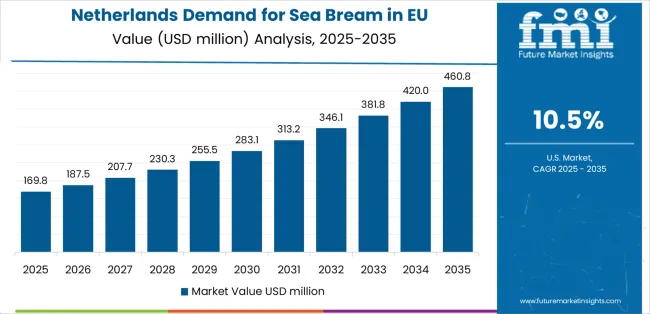
Demand for sea bream in the Netherlands is projected to grow from USD 17.4 million in 2025 to USD 44.7 million by 2035, expanding at a CAGR of 10.5%, fundamentally driven by Netherlands' role as European seafood distribution hub, sophisticated urban consumer base, expanding restaurant sector, and high-income demographics supporting premium seafood purchasing. Amsterdam and Rotterdam serve as critical entry points for Mediterranean aquaculture products accessing Northern European markets.
Dutch demand benefits from exceptional seafood logistics infrastructure, established distribution networks connecting Mediterranean producers with Northern European markets, and sophisticated consumer base appreciating quality and sustainability. Major retailers including Albert Heijn and specialized fish retailers maintain premium seafood offerings, while Amsterdam's restaurant scene increasingly features Mediterranean cuisine. Dutch consumers demonstrate strong environmental consciousness supporting organic and certified products.
Innovation drivers:
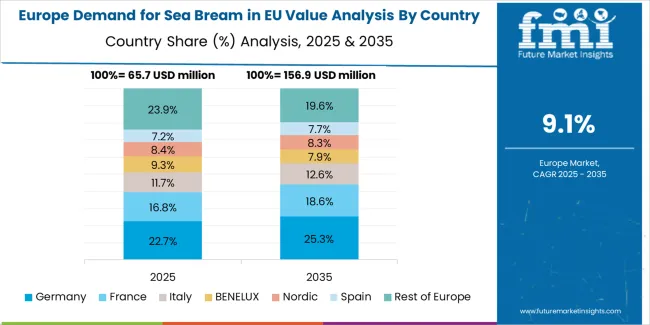
EU sea bream sales are projected to grow from USD 290.5 million in 2025 to USD 745.3 million by 2035, registering a CAGR of 9.9% over the forecast period. All major markets demonstrate consistent 10.1% CAGR reflecting synchronized growth across European regions driven by uniform drivers including health consciousness, Mediterranean cuisine popularity, and aquaculture supply expansion.
Spain maintains the largest share at 22.0% in 2025, driven by extensive domestic aquaculture production, strong Mediterranean culinary traditions, and established consumer preferences. Italy follows with 18.0% share, benefiting from similar Mediterranean heritage and sophisticated seafood consumption patterns. France represents 10.0% of demand, while Germany accounts for 9.0%, reflecting growing Northern European market penetration. Netherlands contributes 6.0%, serving as important distribution hub. Rest of Europe collectively represents 35.0%, including significant consumption across Greece, Portugal, and emerging markets.
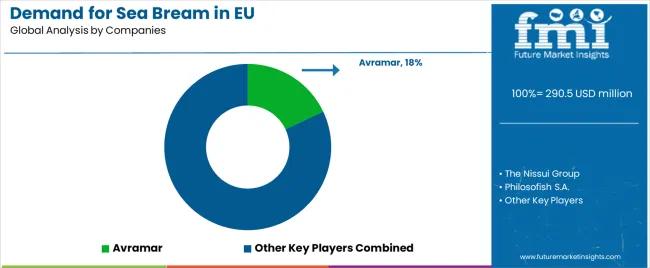
EU sea bream sales are characterized by competition among specialized Mediterranean aquaculture producers, integrated seafood companies, regional fish farms, and distribution specialists. Companies are investing heavily in production capacity expansion, organic certification, advanced farming technologies, value-added processing capabilities, and brand development to deliver high-quality, sustainable, and consistently available sea bream products. Strategic partnerships with retailers, foodservice distributors, and export marketing initiatives are central to strengthening competitive position in this rapidly growing premium seafood category.
Major participants include Avramar with an estimated 18.0% share, representing the largest Mediterranean bream producer with extensive farming operations, comprehensive quality management, and established distribution networks serving European markets. Avramar benefits from production scale advantages, vertical integration capabilities, and reputation for consistent quality supporting premium positioning.
Philosofish S.A. holds approximately 7.0% share, emphasizing EU retail expansion focus, brand development initiatives, and value-added product offerings. The company leverages Greek aquaculture expertise, organic certification capabilities, and retailer relationships supporting growing market penetration across European retail channels.
Cromaris accounts for roughly 5.0% share through strong organic and value-added branding, Croatian production excellence, and premium positioning emphasizing environmental sustainability and product quality. Cromaris benefits from organic certification leadership, innovative product development, and sophisticated marketing supporting premium price realization.
Nissui Group represents approximately 3.0% share, supporting European market presence through processing capabilities, global distribution integration, and comprehensive seafood portfolio enabling cross-selling opportunities. Nissui leverages Japanese seafood expertise, quality management systems, and international distribution networks supporting European market service.
Other companies collectively hold 67.0% share, reflecting competitive dynamics within European sea bream market, where numerous regional producers, Greek and Spanish fish farms, Turkish exporters, and specialized organic operations serve specific markets, channel segments, and quality tiers. This competitive environment provides opportunities for differentiation through sustainable production methods, organic certification, geographic origin positioning, direct-to-consumer sales, and specialized product development resonating with quality-conscious European consumers.
| Item | Value |
|---|---|
| Quantitative Units | USD 746.7 million |
| Product Type | Gilt-head bream, Red bream, Black bream, Pandora bream, White bream |
| Distribution Channel | B2B/HoReCa (Hotels, Restaurants, Catering), B2C Offline (Traditional Retail), B2C Online (E-commerce) |
| Nature | Organic, Conventional |
| Countries Covered | Spain, Italy, France, Germany, the Netherlands, and the Rest of Europe |
| Key Companies Profiled | Avramar, Philosofish S.A., Cromaris, Nissui Group, Specialized Mediterranean aquaculture producers |
| Additional Attributes | Dollar sales by product type, distribution channel, nature, and country; regional demand trends across major European economies; competitive landscape analysis with specialized Mediterranean aquaculture producers and integrated seafood companies; consumer preferences for various bream species and presentation formats; integration with sustainable aquaculture certifications and organic production standards; innovations in farming technologies and value-added processing; adoption across foodservice and retail channels; regulatory framework analysis for aquaculture standards and seafood labeling; supply chain strategies connecting Mediterranean producers with European markets; and penetration analysis for premium seafood consumers across European foodservice and retail segments. |
Product Type
The global demand for sea bream in EU is estimated to be valued at USD 290.5 million in 2025.
The market size for the demand for sea bream in EU is projected to reach USD 746.7 million by 2035.
The demand for sea bream in EU is expected to grow at a 9.9% CAGR between 2025 and 2035.
The key product types in demand for sea bream in EU are gilt-head bream, red bream, black bream, pandora bream and white bream.
In terms of distribution channel, b2b/horeca (hotels, restaurants, catering) segment to command 55.0% share in the demand for sea bream in EU in 2025.


Full Research Suite comprises of:
Market outlook & trends analysis
Interviews & case studies
Strategic recommendations
Vendor profiles & capabilities analysis
5-year forecasts
8 regions and 60+ country-level data splits
Market segment data splits
12 months of continuous data updates
DELIVERED AS:
PDF EXCEL ONLINE
Demand Signal Repository Solutions Market Size and Share Forecast Outlook 2025 to 2035
Demand Side Management Market Size and Share Forecast Outlook 2025 to 2035
Demand Response Market Analysis - Size, Share, and Forecast Outlook 2025 to 2035
North America Shipping Supplies Market Trends – Innovations & Growth 2024-2034
Demand of Kozani Saffron in Greece Analysis - Size, Share & Forecast 2025 to 2035
Demand of No-acid Whey Strained Dairy Processing Concepts in European Union Size and Share Forecast Outlook 2025 to 2035
Demand for Bronte Pistachio in Italy Analysis - Size, Share & Forecast 2025 to 2035
Demand and Trend Analysis of Gaming Monitor in Japan Size and Share Forecast Outlook 2025 to 2035
Demand and Trend Analysis of Gaming Monitor in Korea Size and Share Forecast Outlook 2025 to 2035
Demand and Trend Analysis of Gaming Monitor in Western Europe Size and Share Forecast Outlook 2025 to 2035
Glycine Soja (Soybean) Seed Extract Market Size and Share Forecast Outlook 2025 to 2035
Demand and Trend Analysis of Yeast in Japan - Size, Share, and Forecast Outlook 2025 to 2035
Demand and Trends Analysis of Stevia in Japan Size and Share Forecast Outlook 2025 to 2035
Demand of Pistachio-based desserts & ingredients in France Analysis - Size, Share & Forecast 2025 to 2035
Japan Women’s Intimate Care Market Trends – Growth & Forecast 2024-2034
Western Europe Men’s Skincare Market Analysis – Forecast 2023-2033
Demand and Trend Analysis of Fabric Stain Remover in Korea Size and Share Forecast Outlook 2025 to 2035
Demand and Sales Analysis of Paper Cup in Japan Size and Share Forecast Outlook 2025 to 2035
Demand and Sales Analysis of Paper Cup in Korea Size and Share Forecast Outlook 2025 to 2035
Demand of MFGM-enriched Powders & RTDs in European Union Size and Share Forecast Outlook 2025 to 2035

Thank you!
You will receive an email from our Business Development Manager. Please be sure to check your SPAM/JUNK folder too.
Chat With
MaRIA