Demand for Sodium Chloride in EU: Forecast and Outlook (2025-2035)

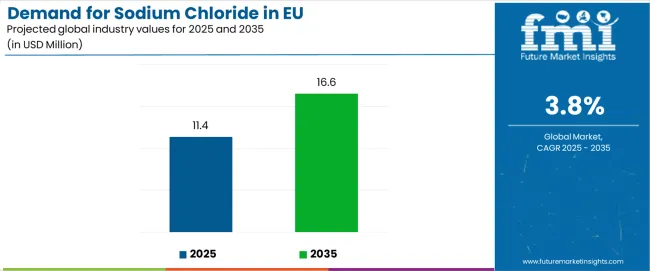
The demand for sodium chloride in the EU is projected to grow from USD 11.4 million in 2025 to USD 16.6 million by 2035, reflecting an absolute increase of USD 5.2 million at a CAGR of 3.8%. The demand growth shows moderate but steady expansion, shaped by industrial consumption, food processing requirements, and chemical feedstock applications. However, the growth pattern across EU regions is not uniform, creating a regional imbalance that will define supply chain adjustments and investment priorities over the forecast period.

Northern and Western Europe are expected to experience relatively slower growth. Mature industries in Germany, France, and the Benelux countries already have high per capita consumption of sodium chloride for both food-grade and industrial use. Growth here is expected to be incremental, driven primarily by chemical processing, chlor-alkali production, and stable demand in packaged foods. By contrast, Southern and Eastern Europe are forecast to post stronger gains, supported by expanding food manufacturing, rising meat processing volumes, and growth in water treatment infrastructure. Countries such as Poland, Hungary, and Romania are projected to outpace the EU average CAGR as industrial clusters expand and per capita consumption catches up with Western standards.

Coastal regions with access to large-scale evaporation and mining capacity, such as Spain and Portugal, contribute to the supply balance but are also heavily export-oriented. Central and landlocked countries remain dependent on cross-border supply, which creates localized price volatility when logistics or energy costs fluctuate. This imbalance is magnified by the uneven pace of industrial expansion across the EU. While high-value sectors in Germany and France sustain steady volume consumption, emerging economies in the east are reshaping trade flows as demand growth accelerates. The EU sodium chloride market will advance at a balanced pace, but regional disparities indicate that Southern and Eastern Europe will contribute disproportionately to incremental demand. Western regions will stabilize consumption at mature levels, while coastal producers retain their strategic role in balancing intra-EU supply. 
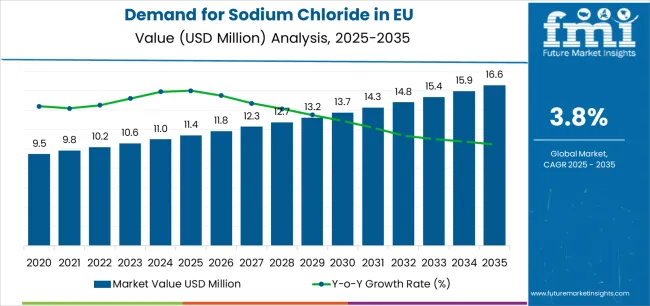
Demand For Sodium Chloride In Eu Market Value Analysis

Quick Stats for Sodium Chloride in EU

  • Sodium Chloride in EU Value (2025): USD 11.4 million
  • Sodium Chloride in EU Forecast Value (2035): USD 16.6million
  • Sodium Chloride in EU Forecast CAGR: 3.8%
  • Leading Product Type in Sodium Chloride in EU: Solid (44.0%)
  • Key Growth Countries in Sodium Chloride in EU: Spain, Italy, and France
  • Top Application Segment in Sodium Chloride in EU: Chemicals (30.0%)

Demand For Sodium Chloride In Eu Industry Value Analysis

Demand for Sodium Chloride in EU: Key Takeaways

Metric Value
Estimated Value in (2025E) USD 11.4 million
Forecast Value in (2035F) USD 16.6 million
Forecast CAGR (2025 to 2035) 3.8%

Why is the Demand for Sodium Chloride Growing in EU?

Industry expansion is being supported by the consistent requirements of large-scale chemical manufacturing operations across European countries and the corresponding demand for reliable, cost-effective chlor-alkali feedstock with proven quality standards for industrial applications. Modern industries rely on sodium chloride as an essential raw material for chlorine and caustic soda production, food preservation and processing, water softening and treatment systems, and winter road safety operations, driving demand for products that deliver consistent purity levels, appropriate physical specifications, and reliable supply availability. Even specialized applications, such as pharmaceutical manufacturing, food-grade processing, or high-purity electronics production, drive comprehensive sodium chloride requirements to maintain optimal production efficiency and support critical industrial operations.

The established infrastructure of European chemical parks and increasing recognition of water treatment infrastructure modernization are driving demand for sodium chloride supplies from certified producers with appropriate quality certifications and logistics capabilities. Regulatory authorities are increasingly establishing clear guidelines for sodium chloride purity specifications, food-grade certifications, and quality requirements to maintain production standards and ensure product consistency. Industrial supply agreements and long-term procurement contracts are providing stability supporting sodium chloride production investments, requiring specialized mining operations and standardized processing protocols for consistent quality delivery, optimal particle size distribution, and appropriate purity profiles, including sodium chloride content specifications and controlled impurity levels.

Segmental Analysis

Sales are segmented by product type (form), application (end use), distribution channel, nature (source), and country. By product type, demand is divided into solid, liquid brine, and high-purity refined/vacuum. Based on the application, sales are categorized into chemicals, food and beverages, water treatment, deicing, industrial (non-chemical), oil and gas, pharmaceuticals, and agriculture. In terms of distribution channel, demand is segmented into industrial contracts, municipal procurement, food/pharma distributors, and direct brine pipelines. By nature, sales are classified into seawater and brine, and solid mining. Regionally, demand is focused on Germany, France, Italy, Spain, the Netherlands, and the Rest of Europe.

By Product Type, Solid Segment Accounts for 44% Industry Share

Demand For Sodium Chloride In Eu Analysis By Product Type (form)

The solid segment is projected to account for 44% of EU sodium chloride sales in 2025, establishing itself as the dominant product form across European industries. This commanding position is fundamentally supported by solid sodium chloride's versatility across diverse applications, ease of transportation and storage compared to liquid alternatives, and established distribution infrastructure enabling cost-effective delivery to varied end users. The solid format delivers exceptional flexibility, providing customers with convenient handling characteristics that facilitate storage, dosing accuracy for industrial processes, and straightforward integration into existing production systems.

This segment benefits from mature mining operations, well-established processing facilities, and extensive distribution networks from multiple European producers who maintain rigorous quality standards and consistent production capacity. Additionally, solid sodium chloride offers versatility across various grain sizes and purity grades, including coarse industrial salt, fine food-grade varieties, and compressed tablet formats, supported by proven logistics systems that address regional distribution requirements and seasonal demand fluctuations.

The solid segment is expected to maintain a strong 41.0% share through 2035, demonstrating gradual decline as liquid brine and high-purity refined products gain modest share, reflecting specialized application growth while solid maintains its established position throughout the forecast period.

  • Versatility across industrial, food, deicing, and consumer applications
  • Established logistics infrastructure enabling cost-effective regional distribution
  • Storage convenience and handling simplicity compared to liquid alternatives

By Application, Chemicals Segment Accounts for 30% Industry Share

Demand For Sodium Chloride In Eu Analysis By Application (end Use)

Chemicals application is positioned to represent 30% of total sodium chloride demand across European industries in 2025, maintaining substantial share around 31.0% through 2035, reflecting the segment's dominance as the primary industrial consumption driver within the overall industry ecosystem. This considerable share directly demonstrates that chemical manufacturing represents the largest single application, with producers consuming sodium chloride for chlor-alkali electrolysis producing chlorine gas, caustic soda, and hydrogen, which serve as fundamental building blocks for plastics, solvents, pharmaceuticals, and countless chemical intermediates.

Modern chemical facilities increasingly view sodium chloride as an irreplaceable raw material for integrated production complexes, driving demand for consistent-purity brine deliveries optimized for electrolysis efficiency with minimal impurities, reliable supply continuity supporting continuous production operations, and proximity to manufacturing sites reducing transportation costs. The segment benefits from long-term supply contracts between sodium chloride producers and chemical manufacturers, infrastructure investments in direct brine pipelines connecting deposits to production facilities, and technical specifications ensuring optimal electrolysis performance.

The segment's stable share reflects proportional growth across all application categories, with chemicals maintaining its leading position as the primary industrial driver throughout the forecast period.

  • Chlor-alkali production driving largest single application for sodium chloride feedstock
  • Long-term contracts and pipeline infrastructure ensuring supply reliability
  • Technical specifications supporting electrolysis efficiency and production optimization

What are the Drivers, Restraints, and Key Trends of the EU Sodium Chloride Industry?

EU sodium chloride sales are advancing steadily due to consistent industrial demand from chemical manufacturing, ongoing food processing requirements, and reliable municipal deicing programs. However, the industry faces challenges, including environmental concerns regarding road salt runoff affecting freshwater ecosystems, price sensitivity in commodity-grade applications limiting premium positioning, and logistical complexities associated with seasonal demand fluctuations for deicing operations. Continued optimization of production efficiency and supply chain reliability remains central to industry development.

Expansion of Desalination Infrastructure Creating Brine By-Products

The rapidly accelerating development of seawater desalination facilities across Mediterranean coastal regions and water-stressed European areas is fundamentally transforming sodium chloride supply dynamics from traditional mining-dependent sourcing to integrated desalination by-product recovery, enabling cost-effective brine production without dedicated extraction investments. Advanced desalination plants featuring reverse osmosis and thermal distillation technologies generate concentrated brine streams containing dissolved sodium chloride that can be processed into commercial products, reducing waste disposal requirements while creating revenue opportunities from previously discarded by-products. These infrastructure developments prove particularly transformative for coastal chemical facilities and regional food processors, where proximity to desalination plants enables direct brine utilization without transportation costs associated with mined sodium chloride.

Integration of High-Purity Processing for Pharmaceutical Applications

Modern sodium chloride producers systematically incorporate advanced purification technologies, including recrystallization systems, membrane filtration, and vacuum evaporation that deliver pharmaceutical-grade products meeting stringent regulatory specifications for injectable solutions, dialysis applications, and medical device manufacturing. Strategic integration of high-purity processing capabilities enables manufacturers to position specialized sodium chloride products commanding premium pricing where quality certifications directly determine industry access and customer qualification. These purity improvements prove essential for pharmaceutical adoption, as medical applications demand guaranteed impurity levels, comprehensive quality documentation, and validated manufacturing processes ensuring patient safety.

Growing Emphasis on Sustainable Mining and Production Practices

European consumers and industrial purchasers increasingly prioritize sustainable sodium chloride sourcing featuring responsible mining operations, renewable energy utilization in production facilities, and transparent environmental management practices that align with corporate sustainability commitments. This sustainability emphasis enables producers to differentiate operations through environmental certifications, carbon footprint disclosure, and responsible sourcing claims that resonate with environmentally conscious customers seeking sodium chloride suppliers demonstrating measurable environmental performance improvements. Sustainable production positioning proves particularly important for food and pharmaceutical applications where brand reputation and supply chain responsibility directly influence purchasing decisions.
Demand Analysis of Sodium Chloride in EU by Key Countries

Demand For Sodium Chloride In Eu Cagr Analysis By Country

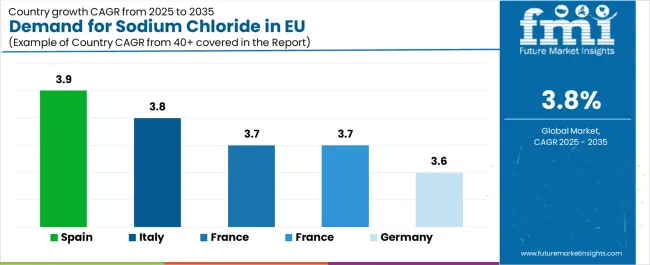
Country CAGR %
Spain 3.9%
Italy 3.8%
France 3.7%
Netherlands 3.7%
Germany 3.6%

EU sodium chloride sales demonstrate stable growth across major European economies, with Spain leading expansion at 3.9% CAGR through 2035, driven by chemical sector growth and favorable production conditions. Germany maintains leadership through established industrial consumption and mature supply infrastructure. France benefits from diversified applications across chemicals, food processing, and winter maintenance. Italy leverages growing pharmaceutical manufacturing and expanding food industry requirements. Spain shows strongest growth supported by coastal production advantages and industrial expansion. The Netherlands emphasizes chemical manufacturing concentration and logistics excellence. Overall, sales show steady regional development reflecting consistent industrial demand and reliable consumption patterns.

Germany Leads European Sales with Established Industrial Base

Revenue from sodium chloride in Germany is projected to exhibit steady growth with a CAGR of 3.6% through 2035, driven by exceptionally well-developed chemical manufacturing infrastructure, comprehensive food processing industry, and substantial winter deicing requirements throughout the country. Germany's sophisticated industrial base and internationally recognized leadership in chemical production are creating substantial demand for diverse sodium chloride grades across all industrial segments.

Major chemical producers, including BASF, Covestro, and integrated chlor-alkali facilities, systematically consume massive sodium chloride volumes for chlorine and caustic soda production, often through dedicated brine pipelines connecting underground deposits to manufacturing complexes. German demand benefits from high industrial output, substantial manufacturing capacity supporting chemical exports, and well-established supply relationships between sodium chloride producers and major industrial consumers ensuring reliable procurement and quality consistency.

  • Chlor-alkali manufacturing infrastructure driving largest European industrial consumption
  • Extensive winter road network requiring substantial deicing material procurement
  • Food processing industry demanding high-purity grades for preservation applications

France Demonstrates Steady Growth with Diversified Applications

Revenue from sodium chloride in France is expanding at a CAGR of 3.7%, substantially supported by diversified industrial consumption across chemical manufacturing, food processing, and municipal applications despite stable overall growth patterns. France's balanced industrial structure and comprehensive infrastructure are systematically driving demand for consistent sodium chloride supplies across diverse application segments.

Major chemical facilities, including those operated by Arkema and other producers, along with extensive food processing operations for cheese production, meat curing, and bakery applications, are gradually establishing comprehensive sodium chloride procurement programs to serve continuously evolving requirements. French sales particularly benefit from Mediterranean salt production facilities providing cost-effective supply, Atlantic coast operations supporting western regions, and established distribution networks ensuring reliable availability across diverse geographic areas.

  • Chemical manufacturing maintaining steady industrial consumption patterns
  • Food processing industry requiring specialized food-grade specifications
  • Municipal deicing programs supporting consistent winter demand

Italy Maintains Solid Growth with Pharmaceutical Expansion

Revenue from sodium chloride in Italy is growing at a robust CAGR of 3.8%, fundamentally driven by expanding pharmaceutical manufacturing, growing food processing requirements, and steady chemical industry consumption. Italy's traditionally strong pharmaceutical sector and expanding food industry are gradually increasing sodium chloride requirements while maintaining quality standards for specialized applications.

Major pharmaceutical producers, including generic drug manufacturers and medical solution providers, strategically invest in high-purity sodium chloride procurement supporting injectable solutions, dialysis products, and medical device manufacturing. Italian sales particularly benefit from Mediterranean coastal salt production facilities providing competitive supply, established pharmaceutical manufacturing clusters requiring certified high-purity grades, and growing food processing exports necessitating reliable preservation materials.

  • Pharmaceutical manufacturing driving high-purity grade demand
  • Food processing industry supporting traditional curing and preservation applications
  • Coastal production facilities providing cost-effective Mediterranean solar salt

Spain Focuses on Coastal Production and Chemical Growth

Demand for sodium chloride in Spain is projected to grow at the highest CAGR of 3.9%, substantially supported by advantageous coastal production conditions, expanding chemical manufacturing capacity, and growing food processing sector requirements. Spanish coastal geography's emphasis on solar evaporation operations positions domestic sodium chloride production as cost-competitive while supporting export opportunities to broader European industries.

Major chemical facilities, expanding food processing operations serving both domestic and export industries, and municipal requirements systematically expand sodium chloride consumption, with coastal production facilities proving particularly successful in delivering competitive pricing through efficient solar evaporation operations. Spain's substantial tourism industry indirectly supports food processing demand, water treatment facility requirements increase with population growth and infrastructure development, and Mediterranean climate conditions optimize natural evaporation production methods.

  • Coastal solar evaporation facilities providing cost-effective production
  • Chemical manufacturing expansion driving industrial consumption growth
  • Food processing sector supporting preservation and curing applications

Netherlands Emphasizes Chemical Manufacturing and Logistics Excellence

Demand for sodium chloride in the Netherlands is expanding at a CAGR of 3.7%, fundamentally driven by concentrated chemical manufacturing infrastructure, strategic port facilities enabling efficient import/export operations, and established industrial supply relationships. Dutch chemical industry's emphasis on chlor-alkali production and derivative manufacturing positions sodium chloride as critical feedstock material supporting major industrial facilities.

Netherlands sales significantly benefit from well-developed port infrastructure at Rotterdam and Amsterdam facilitating international sodium chloride trade, integrated chemical manufacturing complexes receiving brine through pipeline infrastructure, and sophisticated logistics networks ensuring reliable distribution across Benelux industries. The country's chemical industry concentration creates substantial industrial demand, while strategic geographic position enables efficient supply chain operations serving both domestic consumption and regional distribution throughout northern European industries.
  • Chemical manufacturing concentration driving intensive industrial consumption
  • Port infrastructure facilitating efficient import operations and regional distribution
  • Pipeline delivery systems connecting production sources to major chemical facilities

Europe Split by Key Countries

Demand For Sodium Chloride In Eu Europe Country Market Share Analysis, 2025 & 2035

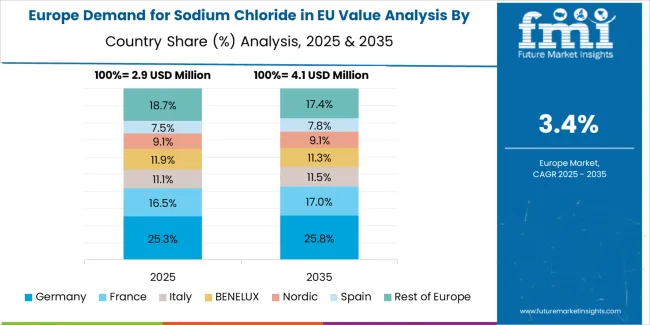
EU sodium chloride sales are projected to grow from USD 11.4 million in 2025 to USD 16.6million by 2035, registering a CAGR of 3.8% over the forecast period. Spain is expected to demonstrate the strongest growth trajectory with a 3.9% CAGR, supported by expanding chemical manufacturing, the growing food processing sector, and advantageous coastal solar evaporation conditions. Italy and France follow with 3.8% and 3.7% CAGR respectively, attributed to diversified industrial consumption and established production infrastructure.

Germany, while maintaining the largest share at 22.1% in 2025, is expected to grow at a 3.6% CAGR, reflecting industrial maturity and stable consumption patterns. The Netherlands demonstrates 3.7% CAGR, supported by chemical manufacturing concentration and strategic port infrastructure.
Competitive Landscape

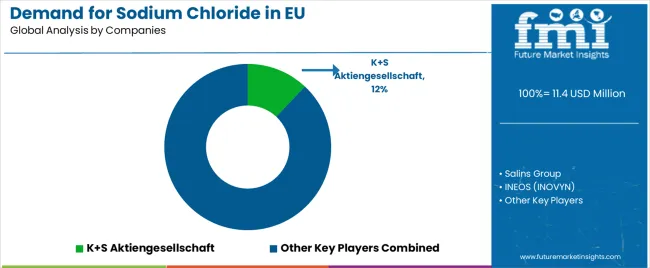
Demand For Sodium Chloride In Eu Analysis By Company

EU sodium chloride sales are defined by competition among integrated mining companies, coastal solar evaporation producers, and specialized high-purity processors. Companies are investing in sustainable production practices, logistics optimization, quality certification programs, and customer relationship management to deliver reliable, cost-effective, and application-appropriate sodium chloride solutions. Strategic partnerships with major industrial consumers, long-term supply agreements, and infrastructure investments in pipeline delivery systems are central to strengthening competitive position.

Major participants include K+S Aktiengesells chaft with an estimated 12.0% share, leveraging its extensive German rock salt mining operations, established logistics infrastructure, and comprehensive customer relationships supporting consistent supply to chemical manufacturers, food processors, and municipal customers. K+S benefits from integrated mining operations, diverse product portfolio spanning industrial to food-grade specifications, and the ability to provide reliable volumes supporting large-contract procurement requirements.

Salins Group holds approximately 9.0% share, emphasizing comprehensive solar evaporation production network across Mediterranean coastal locations, strong presence in food-grade industries, and established distribution serving multiple European countries. Salins' success in developing cost-effective solar salt production and maintaining quality certifications creates strong positioning across food and industrial applications, supported by strategic production locations optimizing natural evaporation conditions.

INEOS (INOVYN) accounts for roughly 7.5% share through its position as an integrated chlor-alkali producer consuming captive brine supplies while also serving external industries. The company benefits from vertical integration connecting sodium chloride production to downstream chemical manufacturing, technical expertise in electrolysis-grade specifications, and comprehensive infrastructure including solution mining operations and pipeline delivery systems supporting chemical facilities.

Other companies and regional producers collectively hold 71.5% share, reflecting the highly fragmented nature of European sodium chloride sales.

Key Players

  • K+S Aktiengesellschaft
  • Salins Group
  • INEOS (INOVYN)
  • Regional mining operations and coastal producers

Scope of the Report

Item Value
Quantitative Units USD 16,556.1 Million
Product Type (Form) Solid, Liquid Brine, High-Purity Refined/Vacuum
Application (End Use) Chemicals, Food & Beverages, Water Treatment, Deicing, Industrial (Non-Chemical), Oil & Gas, Pharmaceuticals, Agriculture
Distribution Channel Industrial Contracts, Municipal Procurement, Food/Pharma Distributors, Direct Brine Pipelines
Nature (Source) Seawater & Brine, Solid Mining
Forecast Period 2025-2035
Base Year 2025
Historical Data 2020-2024
Countries Covered Germany, France, Italy, Spain, the Netherlands, and the Rest of Europe
Key Companies Profiled K+S Aktiengesellschaft, Salins Group, INEOS (INOVYN), Regional producers
Report Pages 180+ Pages
Data Tables 50+ Tables and Figures
Additional Attributes Dollar sales by product type (form), application (end use), distribution channel, and nature (source); regional demand trends across major European industries; competitive landscape analysis with established mining companies and coastal evaporation producers; customer preferences for various purity grades and physical specifications; integration with chemical manufacturing facilities and food processing operations; innovations in sustainable production practices and high-purity processing technologies; adoption across industrial, municipal, and food/pharmaceutical sectors.

Key Segments

Product Type (Form):

  • Solid
  • Liquid Brine
  • High-Purity Refined/Vacuum

Application (End Use):

  • Chemicals
  • Food & Beverages
  • Water Treatment
  • Deicing
  • Industrial (Non-Chemical)
  • Oil & Gas
  • Pharmaceuticals
  • Agriculture

Distribution Channel:

  • Industrial Contracts
  • Municipal Procurement
  • Food/Pharma Distributors
  • Direct Brine Pipelines

Nature (Source):

  • Seawater & Brine
  • Solid Mining

Countries:

  • Germany
  • France
  • Italy
  • Spain
  • Netherlands
  • Rest of Europe

Frequently Asked Questions

How big is the demand for sodium chloride in eu in 2025?

The global demand for sodium chloride in eu is estimated to be valued at USD 11.4 million in 2025.

What will be the size of demand for sodium chloride in eu in 2035?

The market size for the demand for sodium chloride in eu is projected to reach USD 16.6 million by 2035.

How much will be the demand for sodium chloride in eu growth between 2025 and 2035?

The demand for sodium chloride in eu is expected to grow at a 3.8% CAGR between 2025 and 2035.

What are the key product types in the demand for sodium chloride in eu?

The key product types in demand for sodium chloride in eu are solid, liquid brine and high-purity refined/vacuum.

Which application (end use) segment to contribute significant share in the demand for sodium chloride in eu in 2025?

In terms of application (end use), chemicals segment to command 30.0% share in the demand for sodium chloride in eu in 2025.

Table of Content

  1. Executive Summary
    • Global Market Outlook
    • Demand to side Trends
    • Supply to side Trends
    • Technology Roadmap Analysis
    • Analysis and Recommendations
  2. Market Overview
    • Market Coverage / Taxonomy
    • Market Definition / Scope / Limitations
  3. Market Background
    • Market Dynamics
      • Drivers
      • Restraints
      • Opportunity
      • Trends
    • Scenario Forecast
      • Demand in Optimistic Scenario
      • Demand in Likely Scenario
      • Demand in Conservative Scenario
    • Opportunity Map Analysis
    • Product Life Cycle Analysis
    • Supply Chain Analysis
    • Investment Feasibility Matrix
    • Value Chain Analysis
    • PESTLE and Porter’s Analysis
    • Regulatory Landscape
    • Regional Parent Market Outlook
    • Production and Consumption Statistics
    • Import and Export Statistics
  4. Global Market Analysis 2020 to 2024 and Forecast, 2025 to 2035
    • Historical Market Size Value (USD Million) Analysis, 2020 to 2024
    • Current and Future Market Size Value (USD Million) Projections, 2025 to 2035
      • Y to o to Y Growth Trend Analysis
      • Absolute $ Opportunity Analysis
  5. Global Market Pricing Analysis 2020 to 2024 and Forecast 2025 to 2035
  6. Global Market Analysis 2020 to 2024 and Forecast 2025 to 2035, By Product Type (Form)
    • Introduction / Key Findings
    • Historical Market Size Value (USD Million) Analysis By Product Type (Form) , 2020 to 2024
    • Current and Future Market Size Value (USD Million) Analysis and Forecast By Product Type (Form) , 2025 to 2035
      • Solid
      • Liquid Brine
      • High-Purity Refined/Vacuum
    • Y to o to Y Growth Trend Analysis By Product Type (Form) , 2020 to 2024
    • Absolute $ Opportunity Analysis By Product Type (Form) , 2025 to 2035
  7. Global Market Analysis 2020 to 2024 and Forecast 2025 to 2035, By Application (End Use)
    • Introduction / Key Findings
    • Historical Market Size Value (USD Million) Analysis By Application (End Use), 2020 to 2024
    • Current and Future Market Size Value (USD Million) Analysis and Forecast By Application (End Use), 2025 to 2035
      • Chemicals
      • Food & Beverages
      • Water Treatment
      • Deicing
      • Industrial (Non-Chemical)
      • Oil & Gas
      • Pharmaceuticals
      • Agriculture
    • Y to o to Y Growth Trend Analysis By Application (End Use), 2020 to 2024
    • Absolute $ Opportunity Analysis By Application (End Use), 2025 to 2035
  8. Global Market Analysis 2020 to 2024 and Forecast 2025 to 2035, By Region
    • Introduction
    • Historical Market Size Value (USD Million) Analysis By Region, 2020 to 2024
    • Current Market Size Value (USD Million) Analysis and Forecast By Region, 2025 to 2035
      • North America
      • Latin America
      • Western Europe
      • Eastern Europe
      • East Asia
      • South Asia and Pacific
      • Middle East & Africa
    • Market Attractiveness Analysis By Region
  9. North America Market Analysis 2020 to 2024 and Forecast 2025 to 2035, By Country
    • Historical Market Size Value (USD Million) Trend Analysis By Market Taxonomy, 2020 to 2024
    • Market Size Value (USD Million) Forecast By Market Taxonomy, 2025 to 2035
      • By Country
        • USA
        • Canada
        • Mexico
      • By Product Type (Form)
      • By Application (End Use)
    • Market Attractiveness Analysis
      • By Country
      • By Product Type (Form)
      • By Application (End Use)
    • Key Takeaways
  10. Latin America Market Analysis 2020 to 2024 and Forecast 2025 to 2035, By Country
    • Historical Market Size Value (USD Million) Trend Analysis By Market Taxonomy, 2020 to 2024
    • Market Size Value (USD Million) Forecast By Market Taxonomy, 2025 to 2035
      • By Country
        • Brazil
        • Chile
        • Rest of Latin America
      • By Product Type (Form)
      • By Application (End Use)
    • Market Attractiveness Analysis
      • By Country
      • By Product Type (Form)
      • By Application (End Use)
    • Key Takeaways
  11. Western Europe Market Analysis 2020 to 2024 and Forecast 2025 to 2035, By Country
    • Historical Market Size Value (USD Million) Trend Analysis By Market Taxonomy, 2020 to 2024
    • Market Size Value (USD Million) Forecast By Market Taxonomy, 2025 to 2035
      • By Country
        • Germany
        • UK
        • Italy
        • Spain
        • France
        • Nordic
        • BENELUX
        • Rest of Western Europe
      • By Product Type (Form)
      • By Application (End Use)
    • Market Attractiveness Analysis
      • By Country
      • By Product Type (Form)
      • By Application (End Use)
    • Key Takeaways
  12. Eastern Europe Market Analysis 2020 to 2024 and Forecast 2025 to 2035, By Country
    • Historical Market Size Value (USD Million) Trend Analysis By Market Taxonomy, 2020 to 2024
    • Market Size Value (USD Million) Forecast By Market Taxonomy, 2025 to 2035
      • By Country
        • Russia
        • Poland
        • Hungary
        • Balkan & Baltic
        • Rest of Eastern Europe
      • By Product Type (Form)
      • By Application (End Use)
    • Market Attractiveness Analysis
      • By Country
      • By Product Type (Form)
      • By Application (End Use)
    • Key Takeaways
  13. East Asia Market Analysis 2020 to 2024 and Forecast 2025 to 2035, By Country
    • Historical Market Size Value (USD Million) Trend Analysis By Market Taxonomy, 2020 to 2024
    • Market Size Value (USD Million) Forecast By Market Taxonomy, 2025 to 2035
      • By Country
        • China
        • Japan
        • South Korea
      • By Product Type (Form)
      • By Application (End Use)
    • Market Attractiveness Analysis
      • By Country
      • By Product Type (Form)
      • By Application (End Use)
    • Key Takeaways
  14. South Asia and Pacific Market Analysis 2020 to 2024 and Forecast 2025 to 2035, By Country
    • Historical Market Size Value (USD Million) Trend Analysis By Market Taxonomy, 2020 to 2024
    • Market Size Value (USD Million) Forecast By Market Taxonomy, 2025 to 2035
      • By Country
        • India
        • ASEAN
        • Australia & New Zealand
        • Rest of South Asia and Pacific
      • By Product Type (Form)
      • By Application (End Use)
    • Market Attractiveness Analysis
      • By Country
      • By Product Type (Form)
      • By Application (End Use)
    • Key Takeaways
  15. Middle East & Africa Market Analysis 2020 to 2024 and Forecast 2025 to 2035, By Country
    • Historical Market Size Value (USD Million) Trend Analysis By Market Taxonomy, 2020 to 2024
    • Market Size Value (USD Million) Forecast By Market Taxonomy, 2025 to 2035
      • By Country
        • Kingdom of Saudi Arabia
        • Other GCC Countries
        • Turkiye
        • South Africa
        • Other African Union
        • Rest of Middle East & Africa
      • By Product Type (Form)
      • By Application (End Use)
    • Market Attractiveness Analysis
      • By Country
      • By Product Type (Form)
      • By Application (End Use)
    • Key Takeaways
  16. Key Countries Market Analysis
    • USA
      • Pricing Analysis
      • Market Share Analysis, 2024
        • By Product Type (Form)
        • By Application (End Use)
    • Canada
      • Pricing Analysis
      • Market Share Analysis, 2024
        • By Product Type (Form)
        • By Application (End Use)
    • Mexico
      • Pricing Analysis
      • Market Share Analysis, 2024
        • By Product Type (Form)
        • By Application (End Use)
    • Brazil
      • Pricing Analysis
      • Market Share Analysis, 2024
        • By Product Type (Form)
        • By Application (End Use)
    • Chile
      • Pricing Analysis
      • Market Share Analysis, 2024
        • By Product Type (Form)
        • By Application (End Use)
    • Germany
      • Pricing Analysis
      • Market Share Analysis, 2024
        • By Product Type (Form)
        • By Application (End Use)
    • UK
      • Pricing Analysis
      • Market Share Analysis, 2024
        • By Product Type (Form)
        • By Application (End Use)
    • Italy
      • Pricing Analysis
      • Market Share Analysis, 2024
        • By Product Type (Form)
        • By Application (End Use)
    • Spain
      • Pricing Analysis
      • Market Share Analysis, 2024
        • By Product Type (Form)
        • By Application (End Use)
    • France
      • Pricing Analysis
      • Market Share Analysis, 2024
        • By Product Type (Form)
        • By Application (End Use)
    • India
      • Pricing Analysis
      • Market Share Analysis, 2024
        • By Product Type (Form)
        • By Application (End Use)
    • ASEAN
      • Pricing Analysis
      • Market Share Analysis, 2024
        • By Product Type (Form)
        • By Application (End Use)
    • Australia & New Zealand
      • Pricing Analysis
      • Market Share Analysis, 2024
        • By Product Type (Form)
        • By Application (End Use)
    • China
      • Pricing Analysis
      • Market Share Analysis, 2024
        • By Product Type (Form)
        • By Application (End Use)
    • Japan
      • Pricing Analysis
      • Market Share Analysis, 2024
        • By Product Type (Form)
        • By Application (End Use)
    • South Korea
      • Pricing Analysis
      • Market Share Analysis, 2024
        • By Product Type (Form)
        • By Application (End Use)
    • Russia
      • Pricing Analysis
      • Market Share Analysis, 2024
        • By Product Type (Form)
        • By Application (End Use)
    • Poland
      • Pricing Analysis
      • Market Share Analysis, 2024
        • By Product Type (Form)
        • By Application (End Use)
    • Hungary
      • Pricing Analysis
      • Market Share Analysis, 2024
        • By Product Type (Form)
        • By Application (End Use)
    • Kingdom of Saudi Arabia
      • Pricing Analysis
      • Market Share Analysis, 2024
        • By Product Type (Form)
        • By Application (End Use)
    • Turkiye
      • Pricing Analysis
      • Market Share Analysis, 2024
        • By Product Type (Form)
        • By Application (End Use)
    • South Africa
      • Pricing Analysis
      • Market Share Analysis, 2024
        • By Product Type (Form)
        • By Application (End Use)
  17. Market Structure Analysis
    • Competition Dashboard
    • Competition Benchmarking
    • Market Share Analysis of Top Players
      • By Regional
      • By Product Type (Form)
      • By Application (End Use)
  18. Competition Analysis
    • Competition Deep Dive
      • K+S Aktiengesellschaft
        • Overview
        • Product Portfolio
        • Profitability by Market Segments (Product/Age /Sales Channel/Region)
        • Sales Footprint
        • Strategy Overview
          • Marketing Strategy
          • Product Strategy
          • Channel Strategy
      • Salins Group
      • INEOS (INOVYN)
      • Regional mining operations and coastal producers
  19. Assumptions & Acronyms Used
  20. Research Methodology

List of Tables

  • Table 1: Global Market Value (USD Million) Forecast by Region, 2020 to 2035
  • Table 2: Global Market Value (USD Million) Forecast by Product Type (Form) , 2020 to 2035
  • Table 3: Global Market Value (USD Million) Forecast by Application (End Use), 2020 to 2035
  • Table 4: North America Market Value (USD Million) Forecast by Country, 2020 to 2035
  • Table 5: North America Market Value (USD Million) Forecast by Product Type (Form) , 2020 to 2035
  • Table 6: North America Market Value (USD Million) Forecast by Application (End Use), 2020 to 2035
  • Table 7: Latin America Market Value (USD Million) Forecast by Country, 2020 to 2035
  • Table 8: Latin America Market Value (USD Million) Forecast by Product Type (Form) , 2020 to 2035
  • Table 9: Latin America Market Value (USD Million) Forecast by Application (End Use), 2020 to 2035
  • Table 10: Western Europe Market Value (USD Million) Forecast by Country, 2020 to 2035
  • Table 11: Western Europe Market Value (USD Million) Forecast by Product Type (Form) , 2020 to 2035
  • Table 12: Western Europe Market Value (USD Million) Forecast by Application (End Use), 2020 to 2035
  • Table 13: Eastern Europe Market Value (USD Million) Forecast by Country, 2020 to 2035
  • Table 14: Eastern Europe Market Value (USD Million) Forecast by Product Type (Form) , 2020 to 2035
  • Table 15: Eastern Europe Market Value (USD Million) Forecast by Application (End Use), 2020 to 2035
  • Table 16: East Asia Market Value (USD Million) Forecast by Country, 2020 to 2035
  • Table 17: East Asia Market Value (USD Million) Forecast by Product Type (Form) , 2020 to 2035
  • Table 18: East Asia Market Value (USD Million) Forecast by Application (End Use), 2020 to 2035
  • Table 19: South Asia and Pacific Market Value (USD Million) Forecast by Country, 2020 to 2035
  • Table 20: South Asia and Pacific Market Value (USD Million) Forecast by Product Type (Form) , 2020 to 2035
  • Table 21: South Asia and Pacific Market Value (USD Million) Forecast by Application (End Use), 2020 to 2035
  • Table 22: Middle East & Africa Market Value (USD Million) Forecast by Country, 2020 to 2035
  • Table 23: Middle East & Africa Market Value (USD Million) Forecast by Product Type (Form) , 2020 to 2035
  • Table 24: Middle East & Africa Market Value (USD Million) Forecast by Application (End Use), 2020 to 2035

List of Figures

  • Figure 1: Global Market Pricing Analysis
  • Figure 2: Global Market Value (USD Million) Forecast 2020-2035
  • Figure 3: Global Market Value Share and BPS Analysis by Product Type (Form) , 2025 and 2035
  • Figure 4: Global Market Y to o to Y Growth Comparison by Product Type (Form) , 2025-2035
  • Figure 5: Global Market Attractiveness Analysis by Product Type (Form)
  • Figure 6: Global Market Value Share and BPS Analysis by Application (End Use), 2025 and 2035
  • Figure 7: Global Market Y to o to Y Growth Comparison by Application (End Use), 2025-2035
  • Figure 8: Global Market Attractiveness Analysis by Application (End Use)
  • Figure 9: Global Market Value (USD Million) Share and BPS Analysis by Region, 2025 and 2035
  • Figure 10: Global Market Y to o to Y Growth Comparison by Region, 2025-2035
  • Figure 11: Global Market Attractiveness Analysis by Region
  • Figure 12: North America Market Incremental Dollar Opportunity, 2025-2035
  • Figure 13: Latin America Market Incremental Dollar Opportunity, 2025-2035
  • Figure 14: Western Europe Market Incremental Dollar Opportunity, 2025-2035
  • Figure 15: Eastern Europe Market Incremental Dollar Opportunity, 2025-2035
  • Figure 16: East Asia Market Incremental Dollar Opportunity, 2025-2035
  • Figure 17: South Asia and Pacific Market Incremental Dollar Opportunity, 2025-2035
  • Figure 18: Middle East & Africa Market Incremental Dollar Opportunity, 2025-2035
  • Figure 19: North America Market Value Share and BPS Analysis by Country, 2025 and 2035
  • Figure 20: North America Market Value Share and BPS Analysis by Product Type (Form) , 2025 and 2035
  • Figure 21: North America Market Y to o to Y Growth Comparison by Product Type (Form) , 2025-2035
  • Figure 22: North America Market Attractiveness Analysis by Product Type (Form)
  • Figure 23: North America Market Value Share and BPS Analysis by Application (End Use), 2025 and 2035
  • Figure 24: North America Market Y to o to Y Growth Comparison by Application (End Use), 2025-2035
  • Figure 25: North America Market Attractiveness Analysis by Application (End Use)
  • Figure 26: Latin America Market Value Share and BPS Analysis by Country, 2025 and 2035
  • Figure 27: Latin America Market Value Share and BPS Analysis by Product Type (Form) , 2025 and 2035
  • Figure 28: Latin America Market Y to o to Y Growth Comparison by Product Type (Form) , 2025-2035
  • Figure 29: Latin America Market Attractiveness Analysis by Product Type (Form)
  • Figure 30: Latin America Market Value Share and BPS Analysis by Application (End Use), 2025 and 2035
  • Figure 31: Latin America Market Y to o to Y Growth Comparison by Application (End Use), 2025-2035
  • Figure 32: Latin America Market Attractiveness Analysis by Application (End Use)
  • Figure 33: Western Europe Market Value Share and BPS Analysis by Country, 2025 and 2035
  • Figure 34: Western Europe Market Value Share and BPS Analysis by Product Type (Form) , 2025 and 2035
  • Figure 35: Western Europe Market Y to o to Y Growth Comparison by Product Type (Form) , 2025-2035
  • Figure 36: Western Europe Market Attractiveness Analysis by Product Type (Form)
  • Figure 37: Western Europe Market Value Share and BPS Analysis by Application (End Use), 2025 and 2035
  • Figure 38: Western Europe Market Y to o to Y Growth Comparison by Application (End Use), 2025-2035
  • Figure 39: Western Europe Market Attractiveness Analysis by Application (End Use)
  • Figure 40: Eastern Europe Market Value Share and BPS Analysis by Country, 2025 and 2035
  • Figure 41: Eastern Europe Market Value Share and BPS Analysis by Product Type (Form) , 2025 and 2035
  • Figure 42: Eastern Europe Market Y to o to Y Growth Comparison by Product Type (Form) , 2025-2035
  • Figure 43: Eastern Europe Market Attractiveness Analysis by Product Type (Form)
  • Figure 44: Eastern Europe Market Value Share and BPS Analysis by Application (End Use), 2025 and 2035
  • Figure 45: Eastern Europe Market Y to o to Y Growth Comparison by Application (End Use), 2025-2035
  • Figure 46: Eastern Europe Market Attractiveness Analysis by Application (End Use)
  • Figure 47: East Asia Market Value Share and BPS Analysis by Country, 2025 and 2035
  • Figure 48: East Asia Market Value Share and BPS Analysis by Product Type (Form) , 2025 and 2035
  • Figure 49: East Asia Market Y to o to Y Growth Comparison by Product Type (Form) , 2025-2035
  • Figure 50: East Asia Market Attractiveness Analysis by Product Type (Form)
  • Figure 51: East Asia Market Value Share and BPS Analysis by Application (End Use), 2025 and 2035
  • Figure 52: East Asia Market Y to o to Y Growth Comparison by Application (End Use), 2025-2035
  • Figure 53: East Asia Market Attractiveness Analysis by Application (End Use)
  • Figure 54: South Asia and Pacific Market Value Share and BPS Analysis by Country, 2025 and 2035
  • Figure 55: South Asia and Pacific Market Value Share and BPS Analysis by Product Type (Form) , 2025 and 2035
  • Figure 56: South Asia and Pacific Market Y to o to Y Growth Comparison by Product Type (Form) , 2025-2035
  • Figure 57: South Asia and Pacific Market Attractiveness Analysis by Product Type (Form)
  • Figure 58: South Asia and Pacific Market Value Share and BPS Analysis by Application (End Use), 2025 and 2035
  • Figure 59: South Asia and Pacific Market Y to o to Y Growth Comparison by Application (End Use), 2025-2035
  • Figure 60: South Asia and Pacific Market Attractiveness Analysis by Application (End Use)
  • Figure 61: Middle East & Africa Market Value Share and BPS Analysis by Country, 2025 and 2035
  • Figure 62: Middle East & Africa Market Value Share and BPS Analysis by Product Type (Form) , 2025 and 2035
  • Figure 63: Middle East & Africa Market Y to o to Y Growth Comparison by Product Type (Form) , 2025-2035
  • Figure 64: Middle East & Africa Market Attractiveness Analysis by Product Type (Form)
  • Figure 65: Middle East & Africa Market Value Share and BPS Analysis by Application (End Use), 2025 and 2035
  • Figure 66: Middle East & Africa Market Y to o to Y Growth Comparison by Application (End Use), 2025-2035
  • Figure 67: Middle East & Africa Market Attractiveness Analysis by Application (End Use)
  • Figure 68: Global Market - Tier Structure Analysis
  • Figure 69: Global Market - Company Share Analysis
Dashboard
Dashboard
Dashboard
Dashboard
Dashboard
Dashboard

Full Research Suite comprises of:

Market outlook & trends analysis

Market outlook & trends analysis

Interviews & case studies

Interviews & case studies

Strategic recommendations

Strategic recommendations

Vendor profiles & capabilities analysis

Vendor profiles & capabilities analysis

5-year forecasts

5-year forecasts

8 regions and 60+ country-level data splits

8 regions and 60+ country-level data splits

Market segment data splits

Market segment data splits

12 months of continuous data updates

12 months of continuous data updates

DELIVERED AS:

PDF EXCEL ONLINE

Full Research Suite


$5000

$7500

$10000

Buy Report Now
Similar Industry Reports

Similar Industry Reports

Demand Signal Repository Solutions Market

Demand Signal Repository Solutions Market Size and Share Forecast Outlook 2025 to 2035

Demand Side Management Market

Demand Side Management Market Size and Share Forecast Outlook 2025 to 2035

Demand Response Market

Demand Response Market Analysis - Size, Share, and Forecast Outlook 2025 to 2035

Demand Analysis of Shipping Supplies in North America

North America Shipping Supplies Market Trends – Innovations & Growth 2024-2034

Demand of Kozani Saffron in Greece

Demand of Kozani Saffron in Greece Analysis - Size, Share & Forecast 2025 to 2035

Demand of No-acid Whey Strained Dairy Processing Concepts

Demand of No-acid Whey Strained Dairy Processing Concepts in European Union Size and Share Forecast Outlook 2025 to 2035

Demand of Bronte Pistachio in Italy

Demand for Bronte Pistachio in Italy Analysis - Size, Share & Forecast 2025 to 2035

Demand and Trend Analysis of Gaming Monitor in Japan

Demand and Trend Analysis of Gaming Monitor in Japan Size and Share Forecast Outlook 2025 to 2035

Demand and Trend Analysis of Gaming Monitor in Korea

Demand and Trend Analysis of Gaming Monitor in Korea Size and Share Forecast Outlook 2025 to 2035

Demand and Trend Analysis of Gaming Monitor in Western Europe

Demand and Trend Analysis of Gaming Monitor in Western Europe Size and Share Forecast Outlook 2025 to 2035

Demand and Trend Analysis of Glycine Soja (Soybean) Seed Extract Market

Glycine Soja (Soybean) Seed Extract Market Size and Share Forecast Outlook 2025 to 2035

Demand and Trend Analysis of Yeast in Japan

Demand and Trend Analysis of Yeast in Japan - Size, Share, and Forecast Outlook 2025 to 2035

Demand and Trends Analysis of Stevia in Japan

Demand and Trends Analysis of Stevia in Japan Size and Share Forecast Outlook 2025 to 2035

Demand of Pistachio-based desserts & ingredients in France

Demand of Pistachio-based desserts & ingredients in France Analysis - Size, Share & Forecast 2025 to 2035

Demand and Trend Analysis of Women’s Intimate Care Product in Japan

Japan Women’s Intimate Care Market Trends – Growth & Forecast 2024-2034

Demand and Trend Analysis of Men’s Skincare Product in Western Europe

Western Europe Men’s Skincare Market Analysis – Forecast 2023-2033

Demand and Trend Analysis of Fabric Stain Remover in Korea

Demand and Trend Analysis of Fabric Stain Remover in Korea Size and Share Forecast Outlook 2025 to 2035

Demand and Sales Analysis of Paper Cup in Japan

Demand and Sales Analysis of Paper Cup in Japan Size and Share Forecast Outlook 2025 to 2035

Demand and Sales Analysis of Paper Cup in Korea

Demand and Sales Analysis of Paper Cup in Korea Size and Share Forecast Outlook 2025 to 2035

Demand of MFGM-enriched Powders & RTDs in European Union

Demand of MFGM-enriched Powders & RTDs in European Union Size and Share Forecast Outlook 2025 to 2035

Future Market Insights

Demand for Sodium Chloride in EU

Chat With MaRIA

Chat With

MaRIA

Hi There, I am MaRIA, Your Market Research Intelligence Assistant. How may I help you?