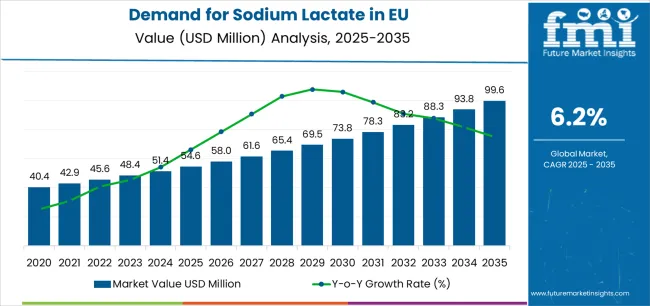
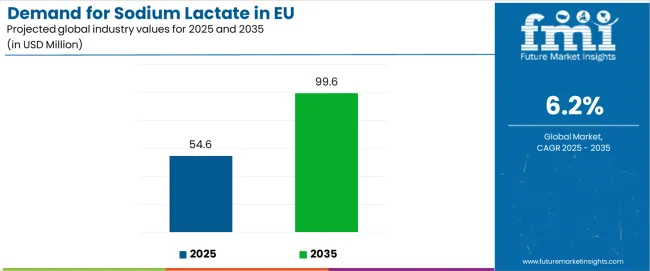
The EU sodium lactate market is valued at USD 54.6 million in 2025 and forecast to reach USD 99.6 million by 2035, generating an absolute increase of USD 45.0 million at a CAGR of 6.2%. Demand growth is driven by food preservation, meat processing, bakery applications, beverage stabilization, and healthcare use in intravenous formulations. This broad application base ensures that volume expansion is steady, particularly as consumer preference shifts toward clean-label ingredients and protein-rich functional foods. Uptake in personal care and cosmetics also contributes to incremental demand, where sodium lactate serves as a moisturizer and pH regulator.
Supply conditions are moderately constrained since production depends on the fermentation of sugars, which ties output to agricultural cycles and raw material pricing. EU producers are expanding cautiously, with investments directed toward efficiency improvements rather than large-scale capacity additions. Compliance with EU additive regulations and environmental rules for fermentation plants also slows expansion, meaning capacity growth lags demand growth. Import dependency on global suppliers remains a buffer, though tighter international demand for lactic acid and derivatives could challenge long-term availability.
The balance between demand and supply suggests that consumption is likely to outpace production capacity over the forecast period, keeping utilization rates high and reinforcing premium pricing for pharmaceutical- and food-grade sodium lactate. Producers are expected to explore bio-based and process-optimized technologies to secure output while managing regulatory and environmental constraints. This sets the stage for continued value expansion in the EU, where food and healthcare will anchor demand while cosmetics and industrial applications add new layers of growth.
| Metric | Value |
|---|---|
| Estimated Value in (2025E) | USD 54.6 million |
| Forecast Value in (2035F) | USD 99.6 million |
| Forecast CAGR (2025 to 2035) | 6.2% |
Between 2025 and 2030, EU sodium lactate demand is projected to expand from USD 54.6 million to USD 72.9 million, resulting in a value increase of USD 18.3 million, which represents 40.5% of the total forecast growth for the decade. This phase of development will be shaped by accelerating clean-label preservative adoption in processed meats and ready-to-eat foods, increasing pharmaceutical utilization in clinical nutrition formulations and dialysis solutions, and growing incorporation in personal care products requiring natural humectants and pH regulators. Manufacturers are expanding their production capabilities to address the evolving preferences for food-grade sodium lactate with superior antimicrobial properties, pharma-grade specifications meeting stringent regulatory requirements, and cosmetic-grade formulations supporting natural beauty product positioning.
From 2030 to 2035, sales are forecast to grow from USD 72.9 million to USD 99.6 million, adding another USD 26.9 million, which constitutes 59.5% of the overall ten-year expansion. This period is expected to be characterized by further expansion of pharmaceutical applications in clinical nutrition protocols, integration of advanced fermentation technologies producing higher-purity sodium lactate grades, and development of specialized formulations targeting premium food preservation and cosmetic applications. The growing emphasis on natural preservatives and increasing regulatory acceptance of sodium lactate across multiple applications will drive demand for consistently high-quality sodium lactate products that deliver effective antimicrobial performance while supporting clean-label positioning.
Between 2020 and 2025, EU sodium lactate sales experienced robust expansion at a CAGR of 5.6%, growing from USD 41.6 million to USD 54.6 million. This period was driven by increasing consumer demand for natural food preservatives, rising awareness of clean-label ingredient benefits, and growing pharmaceutical applications in parenteral nutrition and dialysis treatments. The industry developed as major ingredient suppliers and specialized fermentation producers recognized the commercial potential of sodium lactate across food, pharmaceutical, and personal care applications. Product quality improvements, regulatory approvals for expanded usage levels, and formulation optimization began establishing customer confidence and mainstream acceptance of sodium lactate as a multifunctional ingredient.
Industry expansion is being supported by the rapid increase in clean-label food formulations across European countries and the corresponding demand for natural, effective, and regulatory-compliant preservative solutions with proven antimicrobial functionality in diverse food applications. Modern food processors rely on sodium lactate as a direct replacement for synthetic preservatives in meat processing, ready-to-eat meals, baked goods, and packaged foods, driving demand for products that match or exceed synthetic preservatives' shelf-life extension, microbial inhibition, and taste neutrality characteristics. Even moderate clean-label commitments, such as eliminating artificial preservatives, reducing sodium content through lactate-based systems, or improving moisture retention in processed meats, can drive comprehensive adoption of sodium lactate to maintain optimal product quality and support natural ingredient positioning.
The growing awareness of pharmaceutical nutrition requirements and increasing recognition of sodium lactate's physiological benefits are driving demand for pharma-grade sodium lactate from certified manufacturers with appropriate GMP credentials and analytical capabilities. Regulatory authorities are increasingly establishing clear guidelines for sodium lactate usage levels in food applications, pharmaceutical purity specifications for parenteral solutions, and quality requirements to maintain patient safety and ensure product consistency. Clinical research studies and food science analyses are providing evidence supporting sodium lactate's antimicrobial effectiveness and metabolic advantages, requiring specialized fermentation processes and standardized purification protocols for consistent quality delivery, optimal pH profiles, and appropriate concentration ranges, including sterile filtration for pharmaceutical applications and validated antimicrobial efficacy for food preservation.
Sales are segmented by product type (form), application (end use), distribution channel, nature (grade), and country. By product type, demand is divided into liquid and powder. Based on the application, sales are categorized into food and nutritional supplements, personal care and cosmetics, clinical nutrition, dialysis solutions, beverages, and cleaners and detergents. In terms of distribution channel, demand is segmented into direct to processors and distributors/ingredient blenders. By nature, sales are classified into food-grade, pharma-grade, cosmetic-grade, and industrial/other. Regionally, demand is focused on Germany, France, Italy, Spain, the Netherlands, and the Rest of Europe.
.webp)
The liquid segment is projected to account for 66% of EU sodium lactate sales in 2025, establishing itself as the dominant product form across European industries. This commanding position is fundamentally supported by liquid sodium lactate's ease of incorporation into aqueous food systems, simplified handling and dosing for industrial processors, and superior solubility enabling uniform distribution throughout product matrices. The liquid format delivers exceptional convenience, providing manufacturers with ready-to-use solutions that facilitate direct injection into meat products, straightforward blending into beverages and sauces, and efficient integration into existing production lines without additional dissolution steps.
This segment benefits from established fermentation and purification infrastructure, well-developed logistics systems for bulk liquid handling, and extensive availability from multiple European producers who maintain rigorous quality standards and consistent concentration specifications. Additionally, liquid sodium lactate offers versatility across concentration ranges, typically supplied as 50-60% aqueous solutions suitable for food applications, pharmaceutical formulations requiring sterile filtration, and cosmetic products demanding precise pH control, supported by proven storage stability and compatibility with standard pumping and metering equipment.
The liquid segment is expected to maintain a strong 67.0% share through 2035, demonstrating modest share gain as processing efficiency advantages and direct incorporation benefits continue supporting liquid format preference throughout the forecast period.
.webp)
Food and nutritional supplements application is positioned to represent 37.0% of total sodium lactate demand across European industries in 2025, gradually declining to 35.0% by 2035, reflecting the segment's dominance as the primary consumption driver within the overall industry ecosystem. This considerable share directly demonstrates that food preservation and enhancement represents the largest single application, with processors utilizing sodium lactate for shelf-life extension in processed meats, moisture retention in poultry products, pathogen control in ready-to-eat foods, and flavor enhancement in various formulations.
Modern food manufacturers increasingly view sodium lactate as an essential clean-label preservative for processed meat applications, driving demand for food-grade products optimized for antimicrobial efficacy against Listeria monocytogenes and other pathogens, taste neutrality preventing off-flavors in finished products, and regulatory compliance supporting clean-label claims. The segment benefits from extensive validation studies demonstrating sodium lactate's effectiveness in controlling microbial growth, regulatory approval for usage in multiple food categories at effective concentration levels, and consumer acceptance as a natural ingredient derived from fermentation rather than chemical synthesis.
The segment's modest share decline reflects faster growth in pharmaceutical applications, particularly clinical nutrition and dialysis solutions, while food applications maintain substantial absolute growth throughout the forecast period.
EU sodium lactate sales are advancing rapidly due to accelerating clean-label preservative adoption in food processing, growing pharmaceutical applications in clinical nutrition and dialysis, and increasing personal care utilization as a natural humectant. However, the industry faces challenges, including taste impact concerns in high-concentration food applications affecting consumer acceptance, price premium compared to synthetic preservatives limiting adoption in cost-sensitive applications, and regulatory usage level restrictions in certain food categories. Continued innovation in fermentation efficiency and application optimization remains central to industry development.
The rapidly accelerating utilization of sodium lactate in pharmaceutical applications is fundamentally transforming the industry from primarily food preservation to diversified pharmaceutical nutrition, enabling critical therapeutic functions in parenteral nutrition formulations, dialysis solutions, and clinical hydration products. Advanced pharmaceutical-grade sodium lactate meeting stringent USP specifications provides essential lactate ions for metabolic energy production, pH buffering capacity maintaining physiological conditions, and sodium supplementation supporting electrolyte balance in critically ill patients. These pharmaceutical applications prove particularly transformative for clinical nutrition protocols, including total parenteral nutrition supporting patients unable to consume food orally, peritoneal dialysis solutions maintaining osmotic balance during renal replacement therapy, and intravenous hydration formulations correcting metabolic acidosis.
Modern sodium lactate producers systematically incorporate optimized fermentation processes, including controlled bacterial cultures producing L-lactic acid with high optical purity, fed-batch fermentation systems maximizing productivity, and downstream purification technologies delivering pharmaceutical-grade specifications. Strategic integration of advanced fermentation capabilities enables manufacturers to produce consistent-quality sodium lactate while reducing production costs through improved conversion efficiency, waste minimization, and energy optimization supporting competitive pricing across food and pharmaceutical applications. These process improvements prove essential for maintaining cost competitiveness, as efficient fermentation directly determines raw material utilization, production cycle times, and overall manufacturing economics affecting pricing strategies.
European consumers and food manufacturers increasingly prioritize clean-label preservative systems featuring recognizable ingredients, natural antimicrobial functionality, and transparent labeling practices that align with consumer preferences for minimally processed foods. This clean-label trend enables food processors to differentiate products through simple ingredient statements, natural preservation claims, and transparent manufacturing processes that resonate with health-conscious consumers seeking processed foods without synthetic additives or chemical preservatives. Clean-label positioning proves particularly important for premium processed meat applications where natural preservation supports brand differentiation, premium pricing justification, and consumer trust supporting repeat purchase behavior.
| Country | CAGR % |
|---|---|
| Rest of Europe | 6.5% |
| France | 6.3% |
| Netherlands | 6.2% |
| Germany | 6.1% |
| Spain | 6.0% |
| Italy | 5.9% |
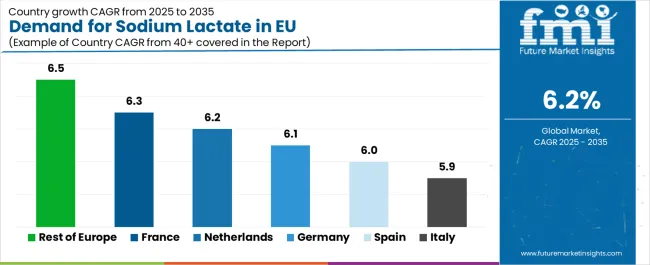
EU sodium lactate sales demonstrate strong growth across major European economies, with the Rest of Europe leading expansion at 6.5% CAGR through 2035, driven by emerging clean-label adoption and pharmaceutical industry development. Germany maintains leadership through established food processing infrastructure and pharmaceutical manufacturing expertise. France benefits from progressive food safety regulations and strong pharmaceutical industry presence. Italy leverages traditional processed meat production and growing clean-label awareness. Spain shows steady growth supported by expanding meat processing sector and increasing pharmaceutical manufacturing. The Netherlands emphasizes pharmaceutical production concentration and food innovation leadership. Overall, sales show robust regional development reflecting EU-wide shifts toward natural preservatives and expanding pharmaceutical applications.
Revenue from sodium lactate in Germany is projected to exhibit steady growth with a CAGR of 6.1% through 2035, driven by exceptionally well-developed food processing industry, comprehensive pharmaceutical manufacturing infrastructure, and strong commitment to food safety and quality standards throughout the country. Germany's sophisticated meat processing sector and internationally recognized pharmaceutical production capabilities are creating substantial demand for diverse sodium lactate grades across food and medical applications.
Major food processors, including meat processing facilities producing sausages, cold cuts, and ready-to-eat products, along with pharmaceutical manufacturers formulating clinical nutrition products and dialysis solutions, systematically expand sodium lactate utilization, often dedicating technical resources to application optimization and quality validation. German demand benefits from stringent food safety regulations encouraging effective preservative systems, substantial pharmaceutical industry requiring high-purity grades, and technical expertise supporting advanced application development naturally driving sodium lactate adoption across multiple industry segments.
Revenue from sodium lactate in France is expanding at a CAGR of 6.3%, substantially supported by progressive food safety regulations encouraging natural preservative adoption, strong pharmaceutical industry presence, and increasing consumer demand for clean-label processed foods. France's evolving food processing landscape and established pharmaceutical manufacturing are systematically driving demand for high-quality sodium lactate alternatives across diverse application segments.
Major food processors, including charcuterie producers, ready-to-eat meal manufacturers, and bakery operations, along with pharmaceutical companies producing parenteral nutrition and dialysis products, are gradually establishing comprehensive sodium lactate procurement programs to serve continuously evolving requirements. French sales particularly benefit from strong charcuterie tradition creating natural demand for meat preservation solutions, pharmaceutical industry concentration in specific regions supporting pharma-grade consumption, and consumer sophistication regarding ingredient quality driving premium positioning within clean-label categories.
Revenue from sodium lactate in Italy is growing at a CAGR of 5.9%, fundamentally driven by traditional processed meat production, growing clean-label awareness, and steady pharmaceutical applications in clinical nutrition formulations. Italy's traditionally strong salumi and prosciutto production and expanding ready-to-eat food sector are gradually increasing sodium lactate requirements while maintaining quality standards for authentic products.
Major meat processors, including traditional cured meat producers and modern ready-to-eat manufacturers, along with pharmaceutical companies producing nutritional supplements, strategically evaluate sodium lactate adoption supporting shelf-life extension while maintaining traditional taste profiles. Italian sales particularly benefit from processed meat heritage creating familiarity with preservation technologies, growing export industries requiring extended shelf-life for international distribution, and increasing pharmaceutical manufacturing supporting clinical nutrition applications.
Demand for sodium lactate in Spain is projected to grow at a CAGR of 6.0%, substantially supported by expanding meat processing sector, growing ready-to-eat food production, and increasing adoption of cost-effective natural preservative systems. Spanish food industry's emphasis on processed meat exports and domestic convenience food growth positions sodium lactate as an effective preservation solution supporting product quality and safety requirements.
Major food processors, expanding meat processing operations serving both domestic and export industries, and ready-to-eat meal producers systematically evaluate sodium lactate adoption, with cost-effective preservation proving particularly successful in supporting competitive pricing while meeting food safety standards. Spain's substantial food processing growth creates increasing preservative demand, export orientation requires reliable shelf-life extension supporting international distribution, and growing convenience food consumption drives ready-to-eat applications benefiting from sodium lactate functionality.
Demand for sodium lactate in the Netherlands is expanding at a CAGR of 6.2%, fundamentally driven by concentrated pharmaceutical manufacturing infrastructure, leadership in food innovation and technology, and established commitment to sustainable ingredient sourcing. Dutch pharmaceutical industry's emphasis on clinical nutrition and specialized medical products positions sodium lactate as a critical ingredient supporting high-value pharmaceutical applications.
Netherlands sales significantly benefit from pharmaceutical manufacturing concentration creating substantial pharma-grade demand, food innovation leadership driving early adoption of novel preservation technologies, and strategic position as European distribution hub facilitating ingredient logistics throughout northern European industries. The country's pharmaceutical specialization creates premium applications, while food technology expertise enables advanced application development, and sustainability focus aligns with fermentation-derived natural ingredients supporting environmental positioning.
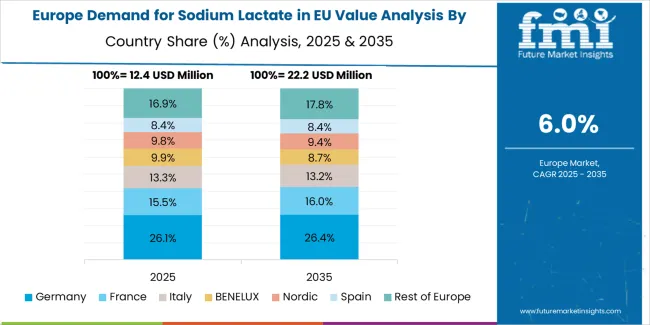
EU sodium lactate sales are projected to grow from USD 54.6 million in 2025 to USD 99.6 million by 2035, registering a CAGR of 6.2% over the forecast period. The Rest of Europe region is expected to demonstrate the strongest growth trajectory with a 6.5% CAGR, supported by emerging adoption in processed food industries, increasing pharmaceutical manufacturing, and growing clean-label awareness. France and the Netherlands follow with 6.3% and 6.2% CAGR respectively, attributed to progressive food safety regulations and established pharmaceutical production infrastructure.
Germany, while maintaining the largest share at 24.4% in 2025, is expected to grow at a 6.1% CAGR, reflecting maturity and established food processing infrastructure. Italy and Spain demonstrate 5.9% and 6.0% CAGR respectively, supported by expanding processed meat production and growing pharmaceutical applications.
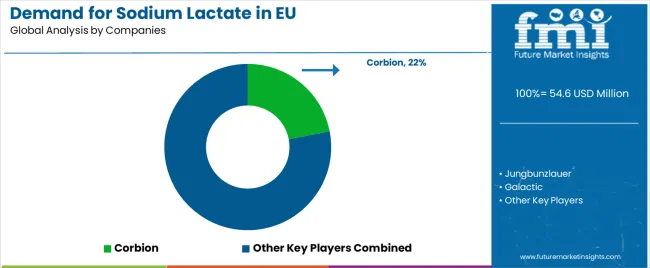
EU sodium lactate sales are defined by competition among specialized fermentation producers, integrated ingredient suppliers, and pharmaceutical-grade manufacturers. Companies are investing in fermentation optimization, quality certification programs, application development support, and customer relationship management to deliver high-quality, consistent, and application-appropriate sodium lactate solutions. Strategic partnerships with major food processors, pharmaceutical manufacturers, and technical service excellence are central to strengthening competitive position.
Major participants include Corbion with an estimated 22% share, leveraging its comprehensive European production infrastructure, pharmaceutical-grade manufacturing capabilities, and established customer relationships supporting consistent supply to food processors, pharmaceutical companies, and personal care formulators. Corbion benefits from integrated lactic acid fermentation operations, diverse product portfolio spanning food to pharma specifications, and the ability to provide technical support services helping customers optimize sodium lactate applications across multiple industries.
Jungbunzlauer holds approximately 18.0% share, emphasizing deep fermentation expertise developed over decades, strong European production footprint, and comprehensive ingredient portfolio supporting cross-selling opportunities. Jungbunzlauer's success in developing cost-effective fermentation processes and maintaining pharmaceutical-grade capabilities creates strong positioning across food and pharmaceutical applications, supported by technical service teams providing application development support and formulation assistance.
Galactic accounts for roughly 12.0% share through its position as a Belgium-based specialist in lactic acid derivatives, emphasizing food safety credentials, pharmaceutical-grade production capabilities, and close relationships with European food processors and pharmaceutical manufacturers. The company benefits from focused product portfolio concentrating on lactate derivatives, technical expertise in fermentation and purification, and comprehensive quality systems supporting both food-grade and pharma-grade certifications. Other companies and regional suppliers collectively hold 48.0% share, reflecting moderate fragmentation in European sodium lactate sales.
| Item | Value |
|---|---|
| Quantitative Units | USD 99.6 million |
| Product Type (Form) | Liquid, Powder |
| Application (End Use) | Food & Nutritional Supplements, Personal Care & Cosmetics, Clinical Nutrition, Dialysis Solutions, Beverages, Cleaners & Detergents |
| Distribution Channel | Direct to Processors, Distributors/Ingredient Blenders |
| Nature (Grade) | Food-Grade, Pharma-Grade, Cosmetic-Grade, Industrial/Other |
| Forecast Period | 2025-2035 |
| Base Year | 2025 |
| Historical Data | 2020-2024 |
| Countries Covered | Germany, France, Italy, Spain, the Netherlands, and the Rest of Europe |
| Key Companies Profiled | Corbion, Jungbunzlauer, Galactic, Regional producers |
| Report Pages | 180+ Pages |
| Data Tables | 50+ Tables and Figures |
| Additional Attributes | Dollar sales by product type (form), application (end use), distribution channel, and nature (grade); regional demand trends across major European industries; competitive landscape analysis with established fermentation producers and specialized pharmaceutical manufacturers; customer preferences for various purity grades and concentration specifications; integration with food preservation systems and pharmaceutical formulations; innovations in fermentation efficiency and purification technologies; adoption across processed meat, clinical nutrition, and personal care sectors. |
The global demand for sodium lactate in eu is estimated to be valued at USD 54.6 million in 2025.
The market size for the demand for sodium lactate in eu is projected to reach USD 99.6 million by 2035.
The demand for sodium lactate in eu is expected to grow at a 6.2% CAGR between 2025 and 2035.
The key product types in demand for sodium lactate in eu are liquid and powder.
In terms of application (end use), food & nutritional supplements segment to command 37.0% share in the demand for sodium lactate in eu in 2025.


Full Research Suite comprises of:
Market outlook & trends analysis
Interviews & case studies
Strategic recommendations
Vendor profiles & capabilities analysis
5-year forecasts
8 regions and 60+ country-level data splits
Market segment data splits
12 months of continuous data updates
DELIVERED AS:
PDF EXCEL ONLINE
Demand Signal Repository Solutions Market Size and Share Forecast Outlook 2025 to 2035
Demand Side Management Market Size and Share Forecast Outlook 2025 to 2035
Demand Response Market Analysis - Size, Share, and Forecast Outlook 2025 to 2035
North America Shipping Supplies Market Trends – Innovations & Growth 2024-2034
Demand of Kozani Saffron in Greece Analysis - Size, Share & Forecast 2025 to 2035
Demand of No-acid Whey Strained Dairy Processing Concepts in European Union Size and Share Forecast Outlook 2025 to 2035
Demand for Bronte Pistachio in Italy Analysis - Size, Share & Forecast 2025 to 2035
Demand and Trend Analysis of Gaming Monitor in Japan Size and Share Forecast Outlook 2025 to 2035
Demand and Trend Analysis of Gaming Monitor in Korea Size and Share Forecast Outlook 2025 to 2035
Demand and Trend Analysis of Gaming Monitor in Western Europe Size and Share Forecast Outlook 2025 to 2035
Glycine Soja (Soybean) Seed Extract Market Size and Share Forecast Outlook 2025 to 2035
Demand and Trend Analysis of Yeast in Japan - Size, Share, and Forecast Outlook 2025 to 2035
Demand and Trends Analysis of Stevia in Japan Size and Share Forecast Outlook 2025 to 2035
Demand of Pistachio-based desserts & ingredients in France Analysis - Size, Share & Forecast 2025 to 2035
Japan Women’s Intimate Care Market Trends – Growth & Forecast 2024-2034
Western Europe Men’s Skincare Market Analysis – Forecast 2023-2033
Demand and Trend Analysis of Fabric Stain Remover in Korea Size and Share Forecast Outlook 2025 to 2035
Demand and Sales Analysis of Paper Cup in Japan Size and Share Forecast Outlook 2025 to 2035
Demand and Sales Analysis of Paper Cup in Korea Size and Share Forecast Outlook 2025 to 2035
Demand of MFGM-enriched Powders & RTDs in European Union Size and Share Forecast Outlook 2025 to 2035

Thank you!
You will receive an email from our Business Development Manager. Please be sure to check your SPAM/JUNK folder too.
Chat With
MaRIA