Demand for Soft Magnetic Composites in EU: Forecast and Outlook (2025-2035)

The demand for soft magnetic composites in the EU is expected to grow from USD 11.2 million in 2025 to USD 20.6 million by 2035, reflecting an absolute increase of USD 9.4 million at a CAGR of 6.3%. The primary share of demand is concentrated in the electrical and electronics industry, where soft magnetic composites are increasingly deployed in inductors, transformers, and electromagnetic shielding. Their ability to reduce eddy current losses and enable compact component designs makes them particularly suitable for high-frequency applications in consumer electronics and communication equipment, ensuring steady growth in this segment.

Automotive is set to be the fastest-growing end-use category. The transition toward electric vehicles and hybrid platforms is driving interest in soft magnetic composites for traction motors, onboard chargers, and auxiliary power units. The material’s advantages in weight reduction, low-loss magnetic properties, and ease of shaping complex geometries are aligning with EU directives for energy efficiency and emission reduction. Demand in this segment is expected to accelerate significantly between 2025 and 2030 as EV penetration deepens across Western and Northern Europe, while suppliers in Eastern Europe expand production capacity to support regional assembly lines.

Industrial machinery and energy systems also represent notable end-use demand. Soft magnetic composites are being adopted in power electronics, renewable energy equipment, and compact drives used in automation and robotics. As European manufacturers increase reliance on energy-efficient motors and high-frequency converters, demand for these materials is projected to gain momentum. In renewable energy, particularly wind and solar inverters, the adoption of high-frequency magnetic components will continue to underpin steady consumption. A smaller yet emerging layer of demand comes from healthcare technology and aerospace, where miniaturized magnetic devices are gaining ground in imaging systems, sensors, and specialized avionics. Though modest in size, these sectors add high-value demand that favors premium-grade composites. Overall, the EU demand structure suggests that while electrical and electronics will continue to anchor volumes, automotive electrification and industrial automation will drive the highest incremental growth.
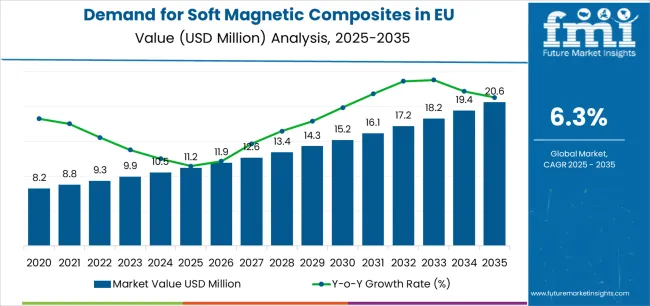
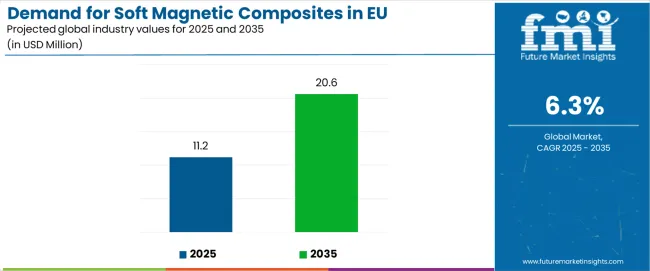
Demand For Soft Magnetic Composites In Eu Market Value Analysis

Quick Stats for Soft Magnetic Composites in EU

  • Soft Magnetic Composites in EU Value (2025): USD 11.2 million
  • Soft Magnetic Composites in EU Forecast Value (2035): USD 20.6 million
  • Soft Magnetic Composites in EU Forecast CAGR: 6.3%
  • Leading Product Type in Soft Magnetic Composites in EU: Electrical Steel (40.0%)
  • Key Growth Countries in Soft Magnetic Composites in EU: Rest of Europe, Spain, and Italy
  • Top Application Segment in Soft Magnetic Composites in EU: Motors (36.0%)

Demand For Soft Magnetic Composites In Eu Industry Value Analysis

Demand for Soft Magnetic Composites in EU: Key Takeaways

Metric Value
Estimated Value in (2025E) USD 11.2 million
Forecast Value in (2035F) USD 20.6 million
Forecast CAGR (2025 to 2035) 6.3%

Why is the Demand for Soft Magnetic Composites Growing in EU?

Industry expansion is being supported by the rapid increase in electric vehicle production across European automotive manufacturers and the corresponding demand for energy-efficient, high-performance, and compact electric motor solutions with proven magnetic properties in demanding automotive and industrial applications. Modern electric motor manufacturers rely on soft magnetic composites as essential core materials for stator and rotor assemblies, magnetic flux management, and electromagnetic component production, driving demand for materials that match or exceed traditional electrical steel's magnetic properties, including high saturation flux density, low core losses, and superior permeability characteristics. Even minor performance requirements, such as high-frequency operation, complex three-dimensional geometries, or miniaturization demands, can drive comprehensive adoption of soft magnetic composites to maintain optimal motor efficiency and support advanced electromagnetic designs.

The growing awareness of energy efficiency regulations and increasing recognition of magnetic materials' critical role in electric motor performance are driving demand for soft magnetic composites from certified suppliers with appropriate quality credentials and technical expertise. Regulatory authorities are increasingly establishing clear guidelines for energy efficiency standards, electromagnetic compatibility requirements, and material specifications to maintain product performance and ensure environmental compliance. Scientific research studies and engineering analyses are providing evidence supporting soft magnetic composites' performance advantages in specific applications, requiring specialized powder metallurgy methods and standardized processing protocols for optimal particle insulation, appropriate density control, and magnetic property optimization, including permeability enhancement and core loss minimization.

Segmental Analysis

Sales are segmented by product type (material), application (format), distribution channel, nature (coating/insulation), and country. By product type, demand is divided into electrical steel, soft ferrite, and iron powder. Based on the application, sales are categorized into motors, transformers, inductors, generators, sensors, electrical coils, and others. In terms of distribution channel, demand is segmented into direct to OEM, distributors, and online/indirect. By nature, sales are classified into insulated/phosphate-coated, advanced nano-coating, and uncoated. Regionally, demand is focused on Germany, France, Italy, Spain, the Netherlands, and the Rest of Europe.
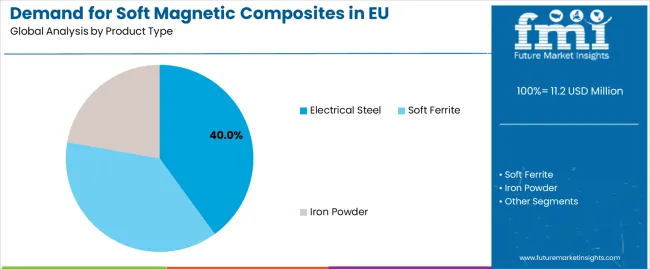
By Product Type, Electrical Steel Segment Accounts for 40% Market Share

Demand For Soft Magnetic Composites In Eu Analysis By Product Type

The electrical steel segment is projected to account for 40% of EU soft magnetic composites sales in 2025, establishing itself as the dominant material category across European markets. This commanding position is fundamentally supported by electrical steel's long-established presence in electromagnetic applications, comprehensive magnetic property profile featuring high saturation flux density, and superior performance in traditional motor and transformer designs. The electrical steel format delivers exceptional reliability, providing manufacturers with proven magnetic materials that facilitate core lamination stacking, transformer winding assemblies, and traditional motor construction properties essential for established electromagnetic device manufacturing.

This segment benefits from mature production infrastructure, well-established supply chains, and extensive availability from multiple certified European steel mills who maintain rigorous quality standards and grade specifications. Electrical steel offers versatility across various formats, including grain-oriented grades for transformer cores, non-oriented grades for motor applications, and thin-gauge materials for high-frequency applications, supported by proven manufacturing technologies that address traditional challenges in core loss reduction and magnetic property optimization.

The electrical steel segment is expected to decline slightly to 39.0% share by 2035, demonstrating gradual positioning adjustment as iron powder composites gain incremental market share in emerging electric vehicle motor applications, though electrical steel maintains dominant positioning throughout the forecast period.
  • Proven magnetic properties supporting established motor and transformer designs
  • Mature manufacturing infrastructure enabling consistent quality and competitive pricing
  • Wide availability from multiple European steel producers ensuring supply security

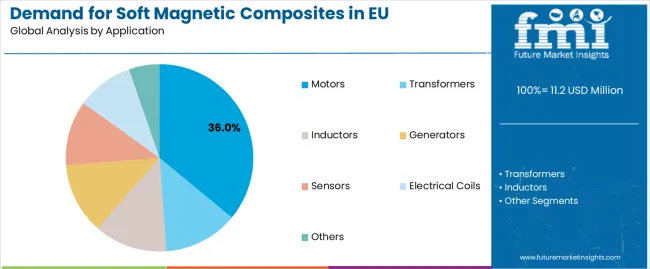
By Application, Motors Segment Accounts for 36% Market Share

Demand For Soft Magnetic Composites In Eu Analysis By Application

Motors format is positioned to represent 36% of total soft magnetic composites demand across European markets in 2025, increasing to 38.0% by 2035, reflecting the segment's dominance as the primary usage format within the industry ecosystem. This substantial share directly demonstrates that motors represent the largest single application, with electric motor manufacturers utilizing soft magnetic composites for stator cores, rotor assemblies, magnetic flux management, and electromagnetic component production across industrial motors, automotive electric motors, and consumer appliance motors.

Modern motor manufacturers increasingly adopt soft magnetic composites for next-generation electric vehicle traction motors requiring high efficiency, driving demand for materials optimized for high-frequency switching with appropriate saturation flux density, low core losses that maximize motor efficiency, and manufacturing flexibility that enables complex rotor and stator geometries. The segment benefits from continuous material innovation focused on improved magnetic flux density supporting higher torque density, core loss reduction enhancing energy efficiency, and mechanical property optimization enabling high-speed motor operation without structural failure.

The segment's expanding share reflects accelerating electric vehicle motor production and increasing industrial motor efficiency requirements, with motors maintaining dominant positioning as electrification trends intensify throughout the forecast period.
  • Electric vehicle traction motor applications driving substantial volume growth
  • Industrial automation motors requiring energy efficiency and precision control
  • High-speed motor designs benefiting from reduced eddy current losses

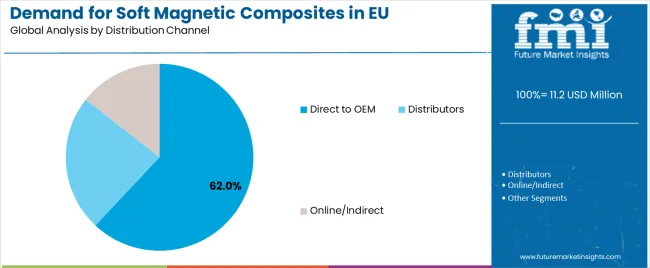
By Distribution Channel, Direct to OEM Segment Accounts for 62% Market Share

Demand For Soft Magnetic Composites In Eu Analysis By Distribution Channel

Direct to OEM channels are strategically estimated to control 62% of total European soft magnetic composites sales in 2025, increasing to 65.0% by 2035, reflecting the critical importance of direct relationships between magnetic material suppliers and motor manufacturers for driving technical collaboration, material qualification, and supply reliability. European electric motor manufacturers, automotive OEMs, and power electronics companies consistently demonstrate strong preference for direct supplier relationships, delivering consistent material specifications, technical support, and supply security supporting manufacturing operations and quality requirements.

The segment provides essential supply chain support through application engineering, material customization, and quality assurance programs that address specific electromagnetic design requirements and performance specifications. Major European motor manufacturers systematically establish direct supply agreements with soft magnetic composite producers, often conducting extensive material qualification testing, electromagnetic performance validation, and long-term contracts that ensure supply security and enable collaborative product development for emerging motor designs.

The segment's expanding share reflects increasing importance of technical collaboration and customized magnetic materials as motor designs become more sophisticated, with direct OEM channels strengthening dominant positioning as performance requirements drive closer supplier-manufacturer relationships throughout the forecast period.

  • Technical collaboration enabling electromagnetic design optimization and material selection
  • Material customization addressing specific magnetic property and manufacturing requirements
  • Supply reliability through long-term agreements supporting automotive qualification and production

What are the Drivers, Restraints, and Key Trends of the EU Soft Magnetic Composites Market?

EU soft magnetic composites sales are advancing steadily due to accelerating electric vehicle motor production, growing industrial motor efficiency requirements, and increasing power electronics applications requiring advanced magnetic materials. Th industry faces challenges, including cyclical automotive demand creating volume uncertainty, raw material price volatility affecting production costs, and alternative material technologies threatening market share in specific applications. Continued innovation in particle coating technologies, magnetic property optimization, and manufacturing process efficiency remains central to industry development.

Expansion of Electric Vehicle Traction Motor Applications

The rapidly accelerating growth of electric vehicle production is fundamentally transforming soft magnetic composites demand from traditional industrial motors toward high-performance traction motors requiring exceptional efficiency, compact designs, and high power density. Advanced soft magnetic composite formulations featuring optimized particle size distributions, superior coating technologies, and enhanced magnetic properties enable efficient traction motor designs supporting electric vehicle range, performance, and cost competitiveness. These automotive innovations prove particularly transformative for axial flux motor designs, including in-wheel motors requiring compact high-torque designs, integrated motor-gearbox assemblies demanding complex three-dimensional magnetic flux paths, and high-speed motors requiring reduced eddy current losses at elevated switching frequencies.

Integration of Advanced Nano-Coating Technologies

Modern soft magnetic composite producers systematically incorporate advanced nano-coating technologies, including atomic layer deposition, sol-gel processes, and chemical vapor deposition methods that deliver ultra-thin insulation coatings, maximized packing density, and superior magnetic properties supporting high-performance motor applications. Strategic integration of coating innovations optimized for minimal thickness enables manufacturers to position nano-coated soft magnetic composites as premium materials where efficiency directly determines motor competitiveness, vehicle range, and commercial success. These coating improvements prove essential for high-frequency motor operation, as switching frequencies above 10 kHz demand superior particle insulation, and for high-power-density designs where maximized magnetic flux density determines motor size and weight.

Growing Emphasis on Circular Economy and Material Recycling

European automotive and motor manufacturers increasingly prioritize circular economy principles featuring recyclable soft magnetic composites, efficient powder metallurgy processes, and end-of-life material recovery that align with European waste management regulations and corporate environmental commitments. This trend enables soft magnetic composite suppliers to differentiate products through recycled content, closed-loop manufacturing processes, and material recovery programs that resonate with eco-conscious automotive brands seeking responsible material portfolios. This positioning proves particularly important for electric vehicle applications where environmental credentials support green transportation narratives, and for industrial motor applications where lifecycle environmental impact influences procurement decisions.
Demand Analysis of Soft Magnetic Composites in EU by Key Countries

Demand For Soft Magnetic Composites In Eu Cagr Analysis By Country

Country CAGR %
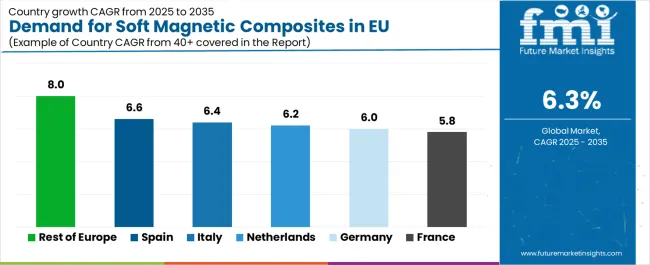
Rest of Europe 8.0%
Spain 6.6%
Italy 6.4%
Netherlands 6.2%
Germany 6.0%
France 5.8%

EU soft magnetic composites sales demonstrate robust growth across major European economies, with the Rest of Europe leading expansion at 8.0% CAGR through 2035, driven by emerging automotive electrification and increasing industrial motor production. Germany maintains leadership through established automotive and motor manufacturing excellence. France benefits from growing electric vehicle component production and aerospace applications. Italy leverages expanding automotive supply chain and industrial motor manufacturing. Spain shows strong growth supported by automotive component manufacturing expansion and increasing electrification. Netherlands emphasizes power electronics and high-tech manufacturing. Sales show strong regional development reflecting EU-wide automotive electrification and industrial motor efficiency trends.
Germany Leads European Sales with Established Automotive Excellence

Demand For Soft Magnetic Composites In Eu Country Value Analysis

Revenue from soft magnetic composites in Germany is projected to exhibit steady growth with a CAGR of 6.0% through 2035, driven by exceptionally well-developed automotive manufacturing ecosystem, comprehensive industrial motor production capabilities, and strong technical expertise in electromagnetic design throughout the country. Germany's sophisticated automotive industry and internationally recognized leadership in motor technology are creating substantial demand for diverse soft magnetic composite grades across all electromagnetic applications.

Major automotive suppliers, including Bosch, Continental, ZF, and specialized motor manufacturers, systematically incorporate soft magnetic composites into electric vehicle traction motors, hybrid powertrains, and industrial drive systems, often dedicating engineering resources to electromagnetic design optimization and material qualification. German demand benefits from extensive electric vehicle production including BMW, Mercedes-Benz, Volkswagen Group, and Porsche electrification programs naturally supporting soft magnetic composite adoption across traction motors, power electronics, and electromagnetic components.

  • Automotive manufacturing leadership driving substantial electric motor and component demand
  • Industrial motor excellence supporting advanced electromagnetic design and material optimization
  • Technical expertise enabling complex motor designs and soft magnetic composite application development

France Demonstrates Steady Growth with Automotive Electrification Focus

Revenue from soft magnetic composites in France is expanding at a CAGR of 5.8%, substantially supported by growing electric vehicle production emphasizing Renault and Stellantis electrification strategies, established industrial motor manufacturing, and increasing power electronics applications across French manufacturing. France's strong automotive and industrial equipment industries and engineering capabilities are systematically driving demand for soft magnetic composites across diverse electromagnetic applications.

Major automotive manufacturers and suppliers strategically incorporate soft magnetic composites into electric vehicle component production and industrial motor manufacturing requiring advanced magnetic materials. French sales particularly benefit from aerospace and defense electronics applications demanding high-reliability magnetic materials, driving premium product positioning within the soft magnetic composites category. Technical collaboration between motor manufacturers and material suppliers significantly enhances adoption rates across traditional and emerging applications.

  • Electric vehicle component production supporting traction motor and power electronics demand
  • Industrial motor manufacturing providing established applications requiring efficient magnetic materials
  • Aerospace electronics offering high-value applications requiring premium magnetic material performance

Italy Maintains Strong Growth with Automotive Supply Chain Expansion

Revenue from soft magnetic composites in Italy is growing at a robust CAGR of 6.4%, fundamentally driven by expanding automotive component manufacturing, growing electric vehicle supply chain participation, and increasing industrial motor production across Italian manufacturing. Italy's substantial automotive supply chain is systematically incorporating soft magnetic composites as manufacturers recognize performance advantages and efficiency opportunities while supporting electrification initiatives.

Major automotive component suppliers, including Marelli and specialized motor manufacturers, strategically invest in soft magnetic composite adoption and electromagnetic design optimization to enhance motor efficiency and manufacturing competitiveness. Italian sales particularly benefit from strong automotive tier-one supplier presence, creating natural demand for motor cores and electromagnetic components supporting increasing electric vehicle content, combined with expanding industrial automation driving motor and power electronics requirements.

  • Automotive component manufacturing driving motor core and electromagnetic component demand
  • Industrial motor production providing diverse applications across automation and machinery sectors
  • Electric vehicle supply chain participation supporting component localization and production growth

Spain Focuses on Automotive Component Manufacturing Growth

Demand for soft magnetic composites in Spain is projected to grow at a CAGR of 6.6%, substantially supported by automotive component manufacturing expansion, increasing electric vehicle production participation, and growing industrial motor applications. Spanish automotive industry's strong component production volumes and increasing electrification positioning soft magnetic composites as valuable materials supporting manufacturing growth and technology advancement.

Major automotive component manufacturers and motor suppliers systematically expand soft magnetic composite utilization, with growing recognition of material benefits in electric motor efficiency, manufacturing flexibility, and cost competitiveness. Spain's substantial automotive component production particularly drives soft magnetic composite demand through applications in electric vehicle motor components, power electronics assemblies, and industrial drive systems requiring efficient magnetic materials.

  • Automotive component manufacturing strength supporting motor core and electromagnetic component volume
  • Electric vehicle production participation increasing demand for traction motor materials
  • Industrial automation growth supporting motor and power electronics applications

Netherlands Emphasizes Power Electronics and High-Tech Manufacturing

Demand for soft magnetic composites in Netherlands is expanding at a CAGR of 6.2%, fundamentally driven by power electronics manufacturing activities, leadership in high-tech equipment production, and comprehensive technical capabilities supporting advanced electromagnetic applications. Dutch manufacturers demonstrate particularly strong technical sophistication in power electronics and specialized electromagnetic components requiring premium soft magnetic materials.

Netherlands sales significantly benefit from the power electronics industry presence, including renewable energy power conversion equipment and industrial power supplies, creating demand for soft ferrite cores and inductor materials supporting efficient energy conversion. The country's high-tech manufacturing leadership goes hand-in-hand with a strong focus on environmental performance, as manufacturers leverage technical expertise while prioritizing eco-friendly outcomes. The Netherlands also serves as an innovation hub for European power electronics, with successful Dutch technology innovations often expanding to broader European markets.
  • Power electronics manufacturing providing substantial demand for ferrite cores and inductor materials
  • High-tech equipment production enabling advanced electromagnetic applications and material innovation
  • Technical sophistication driving adoption of premium and specialized soft magnetic materials

Europe Market Split by Country

Demand For Soft Magnetic Composites In Eu Europe Country Market Share Analysis, 2025 & 2035

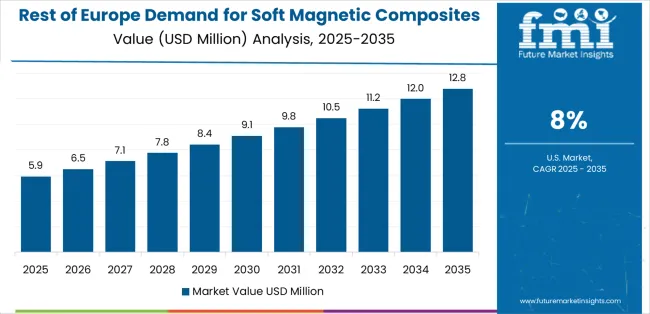
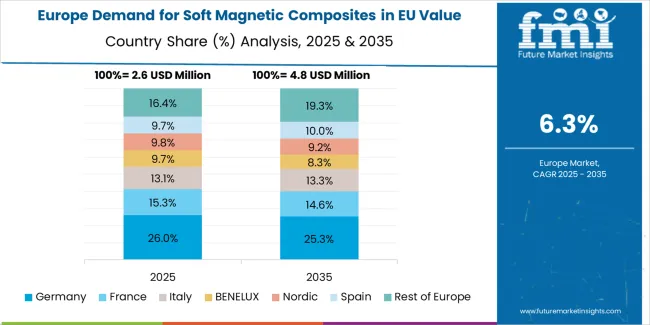
EU soft magnetic composites sales are projected to grow from USD 11.2 million in 2025 to USD 20.6 million by 2035, registering a CAGR of 6.3% over the forecast period. The Rest of Europe region is expected to demonstrate the strongest growth trajectory with an 8.0% CAGR, supported by emerging automotive production, increasing industrial automation, and growing power electronics manufacturing. Spain and Italy follow with 6.6% and 6.4% CAGR each, attributed to expanding electric vehicle component production and growing motor manufacturing sectors, respectively.

Germany, while maintaining the largest share at 38.3% in 2025, is expected to grow at a 6.0% CAGR, reflecting market maturity and established automotive and industrial motor manufacturing infrastructure. The Netherlands and France also demonstrate 6.2% and 5.8% CAGR, respectively, supported by evolving power electronics activities and expanding electric vehicle component manufacturing.
Competitive Landscape

Demand For Soft Magnetic Composites In Eu Analysis By Company

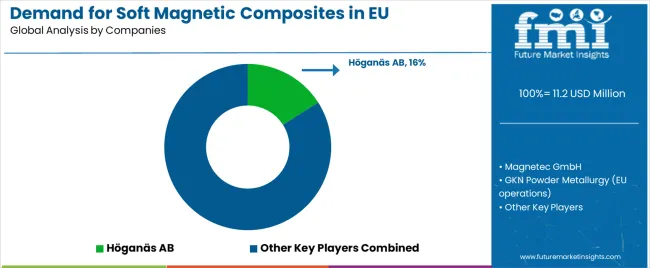
EU soft magnetic composites sales are defined by competition among major powder metallurgy companies, specialized magnetic materials suppliers, and steel producers with electrical steel capabilities. Companies are investing in particle coating technology optimization, magnetic property enhancement, application engineering support, and eco-friendly manufacturing to deliver high-performance, cost-competitive, and environmentally responsible soft magnetic composite solutions. Strategic partnerships with motor manufacturers, automotive qualification programs, and technical marketing emphasizing efficiency and performance are central to strengthening competitive position.

Major participants include Höganäs AB with an estimated 14.0% share, leveraging its extensive European powder metallurgy footprint, established automotive supply relationships, and comprehensive soft magnetic composite portfolio, supporting consistent supply to motor manufacturers across Europe. Höganäs benefits from integrated powder production, coating technology expertise, and the ability to provide complete soft magnetic solutions, including iron powder grades, particle coating technologies, and application engineering support, supporting customer electromagnetic design optimization.

Magnetec GmbH holds approximately 6.5% share, emphasizing strong European core manufacturing presence, automotive electronics focus, and specialized soft magnetic composite applications. Magnetec's success in developing high-performance motor cores with optimized magnetic properties creates strong competitive positioning in demanding automotive applications, supported by German manufacturing quality and technical expertise. GKN Powder Metallurgy (EU operations) accounts for roughly 5.8% share through its position as automotive component supplier, providing comprehensive powder metallurgy capabilities featuring soft magnetic composite production, motor core manufacturing, and electromagnetic component assembly. The company benefits from automotive industry relationships, powder metallurgy expertise, and integrated manufacturing supporting component supply.

Sumitomo Electric (EU sales) represents approximately 4.2% share, leveraging Japanese electromagnetic materials technology, electric vehicle industry relationships, and premium soft magnetic composite positioning. Sumitomo Electric benefits from material science leadership, advanced coating technologies, and automotive OEM partnerships supporting electric vehicle motor applications. Rio Tinto Metal Powders (EU) accounts for roughly 3.9% share through its position as iron powder supplier, providing raw material feedstock for soft magnetic composite production supporting European powder metallurgy industry. The company benefits from integrated iron ore mining, atomized powder production, and quality consistency supporting downstream magnetic material manufacturing.

Key Players

  • Höganäs AB
  • Magnetec GmbH
  • GKN Powder Metallurgy (EU operations)
  • Sumitomo Electric (EU sales)
  • Rio Tinto Metal Powders (EU)
  • Regional steel producers
  • Specialized magnetic materials companies

Scope of the Report

Item Value
Quantitative Units USD 20.6 million
Product Type (Material) Electrical Steel, Soft Ferrite, Iron Powder
Application (Format) Motors, Transformers, Inductors, Generators, Sensors, Electrical Coils, Others
Distribution Channel Direct to OEM, Distributors, Online/Indirect
Nature (Coating/Insulation) Insulated/Phosphate-Coated, Advanced Nano-Coating, Uncoated
Forecast Period 2025-2035
Base Year 2025
Historical Data 2020-2024
Countries Covered Germany, France, Italy, Spain, the Netherlands, and the Rest of Europe
Key Companies Profiled Höganäs AB, Magnetec GmbH, GKN Powder Metallurgy, Sumitomo Electric, Rio Tinto Metal Powders
Report Pages 180+ Pages
Data Tables 50+ Tables and Figures
Additional Attributes Dollar sales by product type (material), application (format), distribution channel, and nature (coating/insulation); regional demand trends across major European markets; competitive landscape analysis with established powder metallurgy companies and specialized magnetic materials suppliers; customer preferences for various magnetic material grades and coating technologies; integration with electric vehicle motor manufacturing and industrial automation technologies; innovations in particle coating and magnetic property optimization; adoption across automotive, industrial, and power electronics applications; regulatory framework analysis for energy efficiency standards and material specifications; supply chain strategies; and penetration analysis for motor manufacturers and automotive suppliers across European markets.

Key Segments

Product Type (Material):

  • Electrical Steel
  • Soft Ferrite
  • Iron Powder

Application (Format):

  • Motors
  • Transformers
  • Inductors
  • Generators
  • Sensors
  • Electrical Coils
  • Others

Distribution Channel:

  • Direct to OEM
  • Distributors
  • Online/Indirect

Nature (Coating/Insulation):

  • Insulated/Phosphate-Coated
  • Advanced Nano-Coating
  • Uncoated

Countries:

  • Germany
  • France
  • Italy
  • Spain
  • Netherlands
  • Rest of Europe

Frequently Asked Questions

How big is the demand for soft magnetic composites in eu in 2025?

The global demand for soft magnetic composites in eu is estimated to be valued at USD 11.2 million in 2025.

What will be the size of demand for soft magnetic composites in eu in 2035?

The market size for the demand for soft magnetic composites in eu is projected to reach USD 20.6 million by 2035.

How much will be the demand for soft magnetic composites in eu growth between 2025 and 2035?

The demand for soft magnetic composites in eu is expected to grow at a 6.3% CAGR between 2025 and 2035.

What are the key product types in the demand for soft magnetic composites in eu?

The key product types in demand for soft magnetic composites in eu are electrical steel , soft ferrite and iron powder.

Which application segment to contribute significant share in the demand for soft magnetic composites in eu in 2025?

In terms of application, motors segment to command 36.0% share in the demand for soft magnetic composites in eu in 2025.

Table of Content

  1. Executive Summary
    • Global Market Outlook
    • Demand to side Trends
    • Supply to side Trends
    • Technology Roadmap Analysis
    • Analysis and Recommendations
  2. Market Overview
    • Market Coverage / Taxonomy
    • Market Definition / Scope / Limitations
  3. Market Background
    • Market Dynamics
      • Drivers
      • Restraints
      • Opportunity
      • Trends
    • Scenario Forecast
      • Demand in Optimistic Scenario
      • Demand in Likely Scenario
      • Demand in Conservative Scenario
    • Opportunity Map Analysis
    • Product Life Cycle Analysis
    • Supply Chain Analysis
    • Investment Feasibility Matrix
    • Value Chain Analysis
    • PESTLE and Porter’s Analysis
    • Regulatory Landscape
    • Regional Parent Market Outlook
    • Production and Consumption Statistics
    • Import and Export Statistics
  4. Global Market Analysis 2020 to 2024 and Forecast, 2025 to 2035
    • Historical Market Size Value (USD Million) Analysis, 2020 to 2024
    • Current and Future Market Size Value (USD Million) Projections, 2025 to 2035
      • Y to o to Y Growth Trend Analysis
      • Absolute $ Opportunity Analysis
  5. Global Market Pricing Analysis 2020 to 2024 and Forecast 2025 to 2035
  6. Global Market Analysis 2020 to 2024 and Forecast 2025 to 2035, By Product Type
    • Introduction / Key Findings
    • Historical Market Size Value (USD Million) Analysis By Product Type , 2020 to 2024
    • Current and Future Market Size Value (USD Million) Analysis and Forecast By Product Type , 2025 to 2035
      • Electrical Steel
      • Soft Ferrite
      • Iron Powder
    • Y to o to Y Growth Trend Analysis By Product Type , 2020 to 2024
    • Absolute $ Opportunity Analysis By Product Type , 2025 to 2035
  7. Global Market Analysis 2020 to 2024 and Forecast 2025 to 2035, By Application
    • Introduction / Key Findings
    • Historical Market Size Value (USD Million) Analysis By Application, 2020 to 2024
    • Current and Future Market Size Value (USD Million) Analysis and Forecast By Application, 2025 to 2035
      • Motors
      • Transformers
      • Inductors
      • Generators
      • Sensors
      • Electrical Coils
      • Others
    • Y to o to Y Growth Trend Analysis By Application, 2020 to 2024
    • Absolute $ Opportunity Analysis By Application, 2025 to 2035
  8. Global Market Analysis 2020 to 2024 and Forecast 2025 to 2035, By Distribution Channel
    • Introduction / Key Findings
    • Historical Market Size Value (USD Million) Analysis By Distribution Channel, 2020 to 2024
    • Current and Future Market Size Value (USD Million) Analysis and Forecast By Distribution Channel, 2025 to 2035
      • Direct to OEM
      • Distributors
      • Online/Indirect
    • Y to o to Y Growth Trend Analysis By Distribution Channel, 2020 to 2024
    • Absolute $ Opportunity Analysis By Distribution Channel, 2025 to 2035
  9. Global Market Analysis 2020 to 2024 and Forecast 2025 to 2035, By Region
    • Introduction
    • Historical Market Size Value (USD Million) Analysis By Region, 2020 to 2024
    • Current Market Size Value (USD Million) Analysis and Forecast By Region, 2025 to 2035
      • North America
      • Latin America
      • Western Europe
      • Eastern Europe
      • East Asia
      • South Asia and Pacific
      • Middle East & Africa
    • Market Attractiveness Analysis By Region
  10. North America Market Analysis 2020 to 2024 and Forecast 2025 to 2035, By Country
    • Historical Market Size Value (USD Million) Trend Analysis By Market Taxonomy, 2020 to 2024
    • Market Size Value (USD Million) Forecast By Market Taxonomy, 2025 to 2035
      • By Country
        • USA
        • Canada
        • Mexico
      • By Product Type
      • By Application
      • By Distribution Channel
    • Market Attractiveness Analysis
      • By Country
      • By Product Type
      • By Application
      • By Distribution Channel
    • Key Takeaways
  11. Latin America Market Analysis 2020 to 2024 and Forecast 2025 to 2035, By Country
    • Historical Market Size Value (USD Million) Trend Analysis By Market Taxonomy, 2020 to 2024
    • Market Size Value (USD Million) Forecast By Market Taxonomy, 2025 to 2035
      • By Country
        • Brazil
        • Chile
        • Rest of Latin America
      • By Product Type
      • By Application
      • By Distribution Channel
    • Market Attractiveness Analysis
      • By Country
      • By Product Type
      • By Application
      • By Distribution Channel
    • Key Takeaways
  12. Western Europe Market Analysis 2020 to 2024 and Forecast 2025 to 2035, By Country
    • Historical Market Size Value (USD Million) Trend Analysis By Market Taxonomy, 2020 to 2024
    • Market Size Value (USD Million) Forecast By Market Taxonomy, 2025 to 2035
      • By Country
        • Germany
        • UK
        • Italy
        • Spain
        • France
        • Nordic
        • BENELUX
        • Rest of Western Europe
      • By Product Type
      • By Application
      • By Distribution Channel
    • Market Attractiveness Analysis
      • By Country
      • By Product Type
      • By Application
      • By Distribution Channel
    • Key Takeaways
  13. Eastern Europe Market Analysis 2020 to 2024 and Forecast 2025 to 2035, By Country
    • Historical Market Size Value (USD Million) Trend Analysis By Market Taxonomy, 2020 to 2024
    • Market Size Value (USD Million) Forecast By Market Taxonomy, 2025 to 2035
      • By Country
        • Russia
        • Poland
        • Hungary
        • Balkan & Baltic
        • Rest of Eastern Europe
      • By Product Type
      • By Application
      • By Distribution Channel
    • Market Attractiveness Analysis
      • By Country
      • By Product Type
      • By Application
      • By Distribution Channel
    • Key Takeaways
  14. East Asia Market Analysis 2020 to 2024 and Forecast 2025 to 2035, By Country
    • Historical Market Size Value (USD Million) Trend Analysis By Market Taxonomy, 2020 to 2024
    • Market Size Value (USD Million) Forecast By Market Taxonomy, 2025 to 2035
      • By Country
        • China
        • Japan
        • South Korea
      • By Product Type
      • By Application
      • By Distribution Channel
    • Market Attractiveness Analysis
      • By Country
      • By Product Type
      • By Application
      • By Distribution Channel
    • Key Takeaways
  15. South Asia and Pacific Market Analysis 2020 to 2024 and Forecast 2025 to 2035, By Country
    • Historical Market Size Value (USD Million) Trend Analysis By Market Taxonomy, 2020 to 2024
    • Market Size Value (USD Million) Forecast By Market Taxonomy, 2025 to 2035
      • By Country
        • India
        • ASEAN
        • Australia & New Zealand
        • Rest of South Asia and Pacific
      • By Product Type
      • By Application
      • By Distribution Channel
    • Market Attractiveness Analysis
      • By Country
      • By Product Type
      • By Application
      • By Distribution Channel
    • Key Takeaways
  16. Middle East & Africa Market Analysis 2020 to 2024 and Forecast 2025 to 2035, By Country
    • Historical Market Size Value (USD Million) Trend Analysis By Market Taxonomy, 2020 to 2024
    • Market Size Value (USD Million) Forecast By Market Taxonomy, 2025 to 2035
      • By Country
        • Kingdom of Saudi Arabia
        • Other GCC Countries
        • Turkiye
        • South Africa
        • Other African Union
        • Rest of Middle East & Africa
      • By Product Type
      • By Application
      • By Distribution Channel
    • Market Attractiveness Analysis
      • By Country
      • By Product Type
      • By Application
      • By Distribution Channel
    • Key Takeaways
  17. Key Countries Market Analysis
    • USA
      • Pricing Analysis
      • Market Share Analysis, 2024
        • By Product Type
        • By Application
        • By Distribution Channel
    • Canada
      • Pricing Analysis
      • Market Share Analysis, 2024
        • By Product Type
        • By Application
        • By Distribution Channel
    • Mexico
      • Pricing Analysis
      • Market Share Analysis, 2024
        • By Product Type
        • By Application
        • By Distribution Channel
    • Brazil
      • Pricing Analysis
      • Market Share Analysis, 2024
        • By Product Type
        • By Application
        • By Distribution Channel
    • Chile
      • Pricing Analysis
      • Market Share Analysis, 2024
        • By Product Type
        • By Application
        • By Distribution Channel
    • Germany
      • Pricing Analysis
      • Market Share Analysis, 2024
        • By Product Type
        • By Application
        • By Distribution Channel
    • UK
      • Pricing Analysis
      • Market Share Analysis, 2024
        • By Product Type
        • By Application
        • By Distribution Channel
    • Italy
      • Pricing Analysis
      • Market Share Analysis, 2024
        • By Product Type
        • By Application
        • By Distribution Channel
    • Spain
      • Pricing Analysis
      • Market Share Analysis, 2024
        • By Product Type
        • By Application
        • By Distribution Channel
    • France
      • Pricing Analysis
      • Market Share Analysis, 2024
        • By Product Type
        • By Application
        • By Distribution Channel
    • India
      • Pricing Analysis
      • Market Share Analysis, 2024
        • By Product Type
        • By Application
        • By Distribution Channel
    • ASEAN
      • Pricing Analysis
      • Market Share Analysis, 2024
        • By Product Type
        • By Application
        • By Distribution Channel
    • Australia & New Zealand
      • Pricing Analysis
      • Market Share Analysis, 2024
        • By Product Type
        • By Application
        • By Distribution Channel
    • China
      • Pricing Analysis
      • Market Share Analysis, 2024
        • By Product Type
        • By Application
        • By Distribution Channel
    • Japan
      • Pricing Analysis
      • Market Share Analysis, 2024
        • By Product Type
        • By Application
        • By Distribution Channel
    • South Korea
      • Pricing Analysis
      • Market Share Analysis, 2024
        • By Product Type
        • By Application
        • By Distribution Channel
    • Russia
      • Pricing Analysis
      • Market Share Analysis, 2024
        • By Product Type
        • By Application
        • By Distribution Channel
    • Poland
      • Pricing Analysis
      • Market Share Analysis, 2024
        • By Product Type
        • By Application
        • By Distribution Channel
    • Hungary
      • Pricing Analysis
      • Market Share Analysis, 2024
        • By Product Type
        • By Application
        • By Distribution Channel
    • Kingdom of Saudi Arabia
      • Pricing Analysis
      • Market Share Analysis, 2024
        • By Product Type
        • By Application
        • By Distribution Channel
    • Turkiye
      • Pricing Analysis
      • Market Share Analysis, 2024
        • By Product Type
        • By Application
        • By Distribution Channel
    • South Africa
      • Pricing Analysis
      • Market Share Analysis, 2024
        • By Product Type
        • By Application
        • By Distribution Channel
  18. Market Structure Analysis
    • Competition Dashboard
    • Competition Benchmarking
    • Market Share Analysis of Top Players
      • By Regional
      • By Product Type
      • By Application
      • By Distribution Channel
  19. Competition Analysis
    • Competition Deep Dive
      • Höganäs AB
        • Overview
        • Product Portfolio
        • Profitability by Market Segments (Product/Age /Sales Channel/Region)
        • Sales Footprint
        • Strategy Overview
          • Marketing Strategy
          • Product Strategy
          • Channel Strategy
      • Magnetec GmbH
      • GKN Powder Metallurgy (EU operations)
      • Sumitomo Electric (EU sales)
      • Rio Tinto Metal Powders (EU)
      • Regional steel producers
      • Specialized magnetic materials companies
  20. Assumptions & Acronyms Used
  21. Research Methodology

List of Tables

  • Table 1: Global Market Value (USD Million) Forecast by Region, 2020 to 2035
  • Table 2: Global Market Value (USD Million) Forecast by Product Type , 2020 to 2035
  • Table 3: Global Market Value (USD Million) Forecast by Application, 2020 to 2035
  • Table 4: Global Market Value (USD Million) Forecast by Distribution Channel, 2020 to 2035
  • Table 5: North America Market Value (USD Million) Forecast by Country, 2020 to 2035
  • Table 6: North America Market Value (USD Million) Forecast by Product Type , 2020 to 2035
  • Table 7: North America Market Value (USD Million) Forecast by Application, 2020 to 2035
  • Table 8: North America Market Value (USD Million) Forecast by Distribution Channel, 2020 to 2035
  • Table 9: Latin America Market Value (USD Million) Forecast by Country, 2020 to 2035
  • Table 10: Latin America Market Value (USD Million) Forecast by Product Type , 2020 to 2035
  • Table 11: Latin America Market Value (USD Million) Forecast by Application, 2020 to 2035
  • Table 12: Latin America Market Value (USD Million) Forecast by Distribution Channel, 2020 to 2035
  • Table 13: Western Europe Market Value (USD Million) Forecast by Country, 2020 to 2035
  • Table 14: Western Europe Market Value (USD Million) Forecast by Product Type , 2020 to 2035
  • Table 15: Western Europe Market Value (USD Million) Forecast by Application, 2020 to 2035
  • Table 16: Western Europe Market Value (USD Million) Forecast by Distribution Channel, 2020 to 2035
  • Table 17: Eastern Europe Market Value (USD Million) Forecast by Country, 2020 to 2035
  • Table 18: Eastern Europe Market Value (USD Million) Forecast by Product Type , 2020 to 2035
  • Table 19: Eastern Europe Market Value (USD Million) Forecast by Application, 2020 to 2035
  • Table 20: Eastern Europe Market Value (USD Million) Forecast by Distribution Channel, 2020 to 2035
  • Table 21: East Asia Market Value (USD Million) Forecast by Country, 2020 to 2035
  • Table 22: East Asia Market Value (USD Million) Forecast by Product Type , 2020 to 2035
  • Table 23: East Asia Market Value (USD Million) Forecast by Application, 2020 to 2035
  • Table 24: East Asia Market Value (USD Million) Forecast by Distribution Channel, 2020 to 2035
  • Table 25: South Asia and Pacific Market Value (USD Million) Forecast by Country, 2020 to 2035
  • Table 26: South Asia and Pacific Market Value (USD Million) Forecast by Product Type , 2020 to 2035
  • Table 27: South Asia and Pacific Market Value (USD Million) Forecast by Application, 2020 to 2035
  • Table 28: South Asia and Pacific Market Value (USD Million) Forecast by Distribution Channel, 2020 to 2035
  • Table 29: Middle East & Africa Market Value (USD Million) Forecast by Country, 2020 to 2035
  • Table 30: Middle East & Africa Market Value (USD Million) Forecast by Product Type , 2020 to 2035
  • Table 31: Middle East & Africa Market Value (USD Million) Forecast by Application, 2020 to 2035
  • Table 32: Middle East & Africa Market Value (USD Million) Forecast by Distribution Channel, 2020 to 2035

List of Figures

  • Figure 1: Global Market Pricing Analysis
  • Figure 2: Global Market Value (USD Million) Forecast 2020-2035
  • Figure 3: Global Market Value Share and BPS Analysis by Product Type , 2025 and 2035
  • Figure 4: Global Market Y to o to Y Growth Comparison by Product Type , 2025-2035
  • Figure 5: Global Market Attractiveness Analysis by Product Type
  • Figure 6: Global Market Value Share and BPS Analysis by Application, 2025 and 2035
  • Figure 7: Global Market Y to o to Y Growth Comparison by Application, 2025-2035
  • Figure 8: Global Market Attractiveness Analysis by Application
  • Figure 9: Global Market Value Share and BPS Analysis by Distribution Channel, 2025 and 2035
  • Figure 10: Global Market Y to o to Y Growth Comparison by Distribution Channel, 2025-2035
  • Figure 11: Global Market Attractiveness Analysis by Distribution Channel
  • Figure 12: Global Market Value (USD Million) Share and BPS Analysis by Region, 2025 and 2035
  • Figure 13: Global Market Y to o to Y Growth Comparison by Region, 2025-2035
  • Figure 14: Global Market Attractiveness Analysis by Region
  • Figure 15: North America Market Incremental Dollar Opportunity, 2025-2035
  • Figure 16: Latin America Market Incremental Dollar Opportunity, 2025-2035
  • Figure 17: Western Europe Market Incremental Dollar Opportunity, 2025-2035
  • Figure 18: Eastern Europe Market Incremental Dollar Opportunity, 2025-2035
  • Figure 19: East Asia Market Incremental Dollar Opportunity, 2025-2035
  • Figure 20: South Asia and Pacific Market Incremental Dollar Opportunity, 2025-2035
  • Figure 21: Middle East & Africa Market Incremental Dollar Opportunity, 2025-2035
  • Figure 22: North America Market Value Share and BPS Analysis by Country, 2025 and 2035
  • Figure 23: North America Market Value Share and BPS Analysis by Product Type , 2025 and 2035
  • Figure 24: North America Market Y to o to Y Growth Comparison by Product Type , 2025-2035
  • Figure 25: North America Market Attractiveness Analysis by Product Type
  • Figure 26: North America Market Value Share and BPS Analysis by Application, 2025 and 2035
  • Figure 27: North America Market Y to o to Y Growth Comparison by Application, 2025-2035
  • Figure 28: North America Market Attractiveness Analysis by Application
  • Figure 29: North America Market Value Share and BPS Analysis by Distribution Channel, 2025 and 2035
  • Figure 30: North America Market Y to o to Y Growth Comparison by Distribution Channel, 2025-2035
  • Figure 31: North America Market Attractiveness Analysis by Distribution Channel
  • Figure 32: Latin America Market Value Share and BPS Analysis by Country, 2025 and 2035
  • Figure 33: Latin America Market Value Share and BPS Analysis by Product Type , 2025 and 2035
  • Figure 34: Latin America Market Y to o to Y Growth Comparison by Product Type , 2025-2035
  • Figure 35: Latin America Market Attractiveness Analysis by Product Type
  • Figure 36: Latin America Market Value Share and BPS Analysis by Application, 2025 and 2035
  • Figure 37: Latin America Market Y to o to Y Growth Comparison by Application, 2025-2035
  • Figure 38: Latin America Market Attractiveness Analysis by Application
  • Figure 39: Latin America Market Value Share and BPS Analysis by Distribution Channel, 2025 and 2035
  • Figure 40: Latin America Market Y to o to Y Growth Comparison by Distribution Channel, 2025-2035
  • Figure 41: Latin America Market Attractiveness Analysis by Distribution Channel
  • Figure 42: Western Europe Market Value Share and BPS Analysis by Country, 2025 and 2035
  • Figure 43: Western Europe Market Value Share and BPS Analysis by Product Type , 2025 and 2035
  • Figure 44: Western Europe Market Y to o to Y Growth Comparison by Product Type , 2025-2035
  • Figure 45: Western Europe Market Attractiveness Analysis by Product Type
  • Figure 46: Western Europe Market Value Share and BPS Analysis by Application, 2025 and 2035
  • Figure 47: Western Europe Market Y to o to Y Growth Comparison by Application, 2025-2035
  • Figure 48: Western Europe Market Attractiveness Analysis by Application
  • Figure 49: Western Europe Market Value Share and BPS Analysis by Distribution Channel, 2025 and 2035
  • Figure 50: Western Europe Market Y to o to Y Growth Comparison by Distribution Channel, 2025-2035
  • Figure 51: Western Europe Market Attractiveness Analysis by Distribution Channel
  • Figure 52: Eastern Europe Market Value Share and BPS Analysis by Country, 2025 and 2035
  • Figure 53: Eastern Europe Market Value Share and BPS Analysis by Product Type , 2025 and 2035
  • Figure 54: Eastern Europe Market Y to o to Y Growth Comparison by Product Type , 2025-2035
  • Figure 55: Eastern Europe Market Attractiveness Analysis by Product Type
  • Figure 56: Eastern Europe Market Value Share and BPS Analysis by Application, 2025 and 2035
  • Figure 57: Eastern Europe Market Y to o to Y Growth Comparison by Application, 2025-2035
  • Figure 58: Eastern Europe Market Attractiveness Analysis by Application
  • Figure 59: Eastern Europe Market Value Share and BPS Analysis by Distribution Channel, 2025 and 2035
  • Figure 60: Eastern Europe Market Y to o to Y Growth Comparison by Distribution Channel, 2025-2035
  • Figure 61: Eastern Europe Market Attractiveness Analysis by Distribution Channel
  • Figure 62: East Asia Market Value Share and BPS Analysis by Country, 2025 and 2035
  • Figure 63: East Asia Market Value Share and BPS Analysis by Product Type , 2025 and 2035
  • Figure 64: East Asia Market Y to o to Y Growth Comparison by Product Type , 2025-2035
  • Figure 65: East Asia Market Attractiveness Analysis by Product Type
  • Figure 66: East Asia Market Value Share and BPS Analysis by Application, 2025 and 2035
  • Figure 67: East Asia Market Y to o to Y Growth Comparison by Application, 2025-2035
  • Figure 68: East Asia Market Attractiveness Analysis by Application
  • Figure 69: East Asia Market Value Share and BPS Analysis by Distribution Channel, 2025 and 2035
  • Figure 70: East Asia Market Y to o to Y Growth Comparison by Distribution Channel, 2025-2035
  • Figure 71: East Asia Market Attractiveness Analysis by Distribution Channel
  • Figure 72: South Asia and Pacific Market Value Share and BPS Analysis by Country, 2025 and 2035
  • Figure 73: South Asia and Pacific Market Value Share and BPS Analysis by Product Type , 2025 and 2035
  • Figure 74: South Asia and Pacific Market Y to o to Y Growth Comparison by Product Type , 2025-2035
  • Figure 75: South Asia and Pacific Market Attractiveness Analysis by Product Type
  • Figure 76: South Asia and Pacific Market Value Share and BPS Analysis by Application, 2025 and 2035
  • Figure 77: South Asia and Pacific Market Y to o to Y Growth Comparison by Application, 2025-2035
  • Figure 78: South Asia and Pacific Market Attractiveness Analysis by Application
  • Figure 79: South Asia and Pacific Market Value Share and BPS Analysis by Distribution Channel, 2025 and 2035
  • Figure 80: South Asia and Pacific Market Y to o to Y Growth Comparison by Distribution Channel, 2025-2035
  • Figure 81: South Asia and Pacific Market Attractiveness Analysis by Distribution Channel
  • Figure 82: Middle East & Africa Market Value Share and BPS Analysis by Country, 2025 and 2035
  • Figure 83: Middle East & Africa Market Value Share and BPS Analysis by Product Type , 2025 and 2035
  • Figure 84: Middle East & Africa Market Y to o to Y Growth Comparison by Product Type , 2025-2035
  • Figure 85: Middle East & Africa Market Attractiveness Analysis by Product Type
  • Figure 86: Middle East & Africa Market Value Share and BPS Analysis by Application, 2025 and 2035
  • Figure 87: Middle East & Africa Market Y to o to Y Growth Comparison by Application, 2025-2035
  • Figure 88: Middle East & Africa Market Attractiveness Analysis by Application
  • Figure 89: Middle East & Africa Market Value Share and BPS Analysis by Distribution Channel, 2025 and 2035
  • Figure 90: Middle East & Africa Market Y to o to Y Growth Comparison by Distribution Channel, 2025-2035
  • Figure 91: Middle East & Africa Market Attractiveness Analysis by Distribution Channel
  • Figure 92: Global Market - Tier Structure Analysis
  • Figure 93: Global Market - Company Share Analysis
Dashboard
Dashboard
Dashboard
Dashboard
Dashboard
Dashboard

Full Research Suite comprises of:

Market outlook & trends analysis

Market outlook & trends analysis

Interviews & case studies

Interviews & case studies

Strategic recommendations

Strategic recommendations

Vendor profiles & capabilities analysis

Vendor profiles & capabilities analysis

5-year forecasts

5-year forecasts

8 regions and 60+ country-level data splits

8 regions and 60+ country-level data splits

Market segment data splits

Market segment data splits

12 months of continuous data updates

12 months of continuous data updates

DELIVERED AS:

PDF EXCEL ONLINE

Full Research Suite


$5000

$7500

$10000

Buy Report Now
Similar Industry Reports

Similar Industry Reports

Demand Signal Repository Solutions Market

Demand Signal Repository Solutions Market Size and Share Forecast Outlook 2025 to 2035

Demand Side Management Market

Demand Side Management Market Size and Share Forecast Outlook 2025 to 2035

Demand Response Market

Demand Response Market Analysis - Size, Share, and Forecast Outlook 2025 to 2035

Demand Analysis of Shipping Supplies in North America

North America Shipping Supplies Market Trends – Innovations & Growth 2024-2034

Demand of Kozani Saffron in Greece

Demand of Kozani Saffron in Greece Analysis - Size, Share & Forecast 2025 to 2035

Demand of No-acid Whey Strained Dairy Processing Concepts

Demand of No-acid Whey Strained Dairy Processing Concepts in European Union Size and Share Forecast Outlook 2025 to 2035

Demand of Bronte Pistachio in Italy

Demand for Bronte Pistachio in Italy Analysis - Size, Share & Forecast 2025 to 2035

Demand and Trend Analysis of Gaming Monitor in Japan

Demand and Trend Analysis of Gaming Monitor in Japan Size and Share Forecast Outlook 2025 to 2035

Demand and Trend Analysis of Gaming Monitor in Korea

Demand and Trend Analysis of Gaming Monitor in Korea Size and Share Forecast Outlook 2025 to 2035

Demand and Trend Analysis of Gaming Monitor in Western Europe

Demand and Trend Analysis of Gaming Monitor in Western Europe Size and Share Forecast Outlook 2025 to 2035

Demand and Trend Analysis of Glycine Soja (Soybean) Seed Extract Market

Glycine Soja (Soybean) Seed Extract Market Size and Share Forecast Outlook 2025 to 2035

Demand and Trend Analysis of Yeast in Japan

Demand and Trend Analysis of Yeast in Japan - Size, Share, and Forecast Outlook 2025 to 2035

Demand and Trends Analysis of Stevia in Japan

Demand and Trends Analysis of Stevia in Japan Size and Share Forecast Outlook 2025 to 2035

Demand of Pistachio-based desserts & ingredients in France

Demand of Pistachio-based desserts & ingredients in France Analysis - Size, Share & Forecast 2025 to 2035

Demand and Trend Analysis of Women’s Intimate Care Product in Japan

Japan Women’s Intimate Care Market Trends – Growth & Forecast 2024-2034

Demand and Trend Analysis of Men’s Skincare Product in Western Europe

Western Europe Men’s Skincare Market Analysis – Forecast 2023-2033

Demand and Trend Analysis of Fabric Stain Remover in Korea

Demand and Trend Analysis of Fabric Stain Remover in Korea Size and Share Forecast Outlook 2025 to 2035

Demand and Sales Analysis of Paper Cup in Japan

Demand and Sales Analysis of Paper Cup in Japan Size and Share Forecast Outlook 2025 to 2035

Demand and Sales Analysis of Paper Cup in Korea

Demand and Sales Analysis of Paper Cup in Korea Size and Share Forecast Outlook 2025 to 2035

Demand of MFGM-enriched Powders & RTDs in European Union

Demand of MFGM-enriched Powders & RTDs in European Union Size and Share Forecast Outlook 2025 to 2035

Future Market Insights

Demand for Soft Magnetic Composites in EU

Chat With MaRIA

Chat With

MaRIA

Hi There, I am MaRIA, Your Market Research Intelligence Assistant. How may I help you?