Demand for Ursolic Acid in EU: Outlook and Forecast (2025–2035)

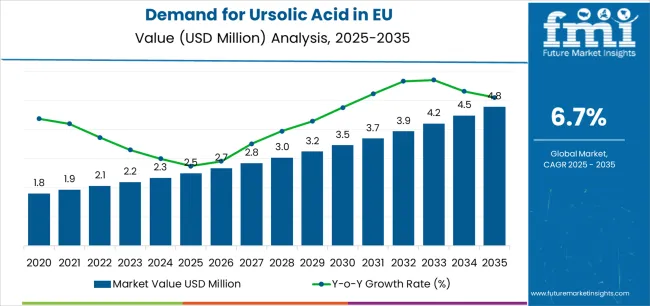
The EU ursolic acid market is projected to grow from USD 2.5 million in 2025 to USD 4.8 million by 2035, advancing at a 6.7% CAGR (modeled from EU anchors). Growth is led by pharmaceuticals (fastest-growing application) and sustained demand in cosmetics and nutraceuticals. Clean-label preferences, plant-based actives, and EFSA-aligned formulations support the adoption of products across skincare, supplements, and therapeutic R&D.

FMI’s chemical sector intelligence, encompassing circular chemistry, sustainability, and material transformation, projects that EU sales are expected to expand from USD 2.5 million (2025) to USD 4.8 million (2035), representing an absolute growth of USD 2.3 million over the decade. This reflects 92% overall growth, underpinned by: (1) rising use in oncology/cardiometabolic pipelines and adjunct therapies, (2) premium/anti-aging skincare leveraging anti-inflammatory and antioxidant properties, (3) preventive-health trends in nutraceuticals, and (4) greener extraction and clean-label sourcing aligned with REACH/EFSA expectations.
Quick Stats for Ursolic Acid Market in EU

  • Value of Ursolic Acid Market in 2025: USD 2.5 million
  • Value of Ursolic Acid Market in 2035: USD 4.8 million
  • CAGR (2025–2035) of Ursolic Acid Market: 6.7%
  • Leading Grade (2025) of Ursolic Acid Market: Cosmetic grade (40%) (global ratio applied to EU)
  • Top Application (2025) of Ursolic Acid Market: Pharmaceutical (36%) (modeled EU share; fastest-growing)
  • Key Growth Countries of Ursolic Acid Market: Germany, France, Italy, Spain, Netherlands
  • Leading Companies in Ursolic Acid Market (EU presence/signals): Sabinsa, Shaanxi Huike Botanical Development, Changsha Staherb

Demand For Ursolic Acid In Eu Market Value Analysis

Demand for Ursolic Acid Market in EU - Key Takeaways

Metric Value
Estimated Value in (2025E) USD 2.5 million
Forecast Value in (2035F) USD 4.8 million
Forecast CAGR (2025 to 2035) 6.7%

The ursolic acid market in the EU is projected to rise from USD 2.5 million in 2025 to approximately USD 3.5 million by 2030, adding nearly USD 1 million in value and contributing about 42% of total decade-long growth. Expansion during this phase is shaped by increasing use in oncology and cardiovascular trials, as well as adjunct pharmaceutical formulations. In cosmetics, cost-effective anti-aging actives and antioxidant benefits enhance demand for dermocosmetic products. Nutraceutical adoption broadens due to wellness and preventive health trends. At the same time, investment in improved bioavailability and cleaner extraction methods strengthens product competitiveness across applications.

Between 2030 and 2035, the Ursolic Acid Market in the EU is forecast to expand from about USD 3.5 million to USD 4.8 million, adding USD 1.3 million and accounting for 58% of decade growth. This later phase reflects stronger consumer preferences for clean-label, vegan, and halal-certified actives, alongside expanding premium skincare and anti-aging products. Functional nutraceuticals targeting metabolic health, recovery, and sarcopenia drive demand. Supply chains are increasingly shaped by sustainability mandates, with traceability of plant-based sourcing gaining importance. Innovation in multi-functional formulations and higher-grade pharmaceutical standardization ensures broader adoption across both therapeutic pipelines and consumer-facing wellness solutions.

From 2020 to 2025, the Ursolic Acid Market in the EU grew steadily from USD 1.8 million to USD 2.5 million, recording a modeled CAGR of 6.8%. Growth was supported by stable nutraceutical uptake, confectionery-inspired skincare premiumization, and regulatory alignment with EFSA and REACH standards. Manufacturers focused on advancing extraction efficiency, optimizing solvent and clean-label processes, and introducing standardized purity tiers of 95% and above. This period also marked the foundation for pharmaceutical exploration, with initial integration into cosmetic-grade and pharma-grade portfolios. These developments provided the structural and regulatory groundwork for stronger adoption and accelerated growth in the 2025–2035 decade.

Why is Demand for Ursolic Acid in EU Growing?

Industry expansion is supported by the growing use of ursolic acid in pharmaceuticals, cosmetics, and nutraceuticals across Europe, driven by its anti-inflammatory, antioxidant, and anti-cancer properties. In the pharmaceutical sector, ursolic acid is being explored for oncology and cardiovascular applications, reflecting strong demand for natural actives in therapeutic formulations. Cosmetic manufacturers are integrating ursolic acid into anti-aging, skin-whitening, and dermocosmetic products to meet European consumer preferences for premium, natural skincare. Nutraceuticals also play a vital role, with supplements featuring ursolic acid promoted for weight management, immune support, and chronic disease prevention, reinforcing its importance in preventive healthcare.

The shift toward clean-label, plant-based, vegan, and organic wellness products is also propelling new demand for ursolic acid in the EU. Consumers increasingly seek safe, natural actives derived from botanicals, while manufacturers focus on eco-friendly sourcing and traceable supply chains. Compliance with EFSA guidelines and EU labeling regulations is shaping product development, ensuring that ursolic acid meets consumer expectations for transparency, purity, and sustainability. As environmental standards tighten, European suppliers are advancing extraction processes that reduce chemical use and highlight sustainability, aligning with the region’s broader push for ethical, green bioactives.

Scientific and industrial research is further validating ursolic acid’s role in anti-inflammatory therapies, cardiovascular protection, and oncology R&D, supporting its acceptance as a functional bioactive in both healthcare and personal care. Enhanced extraction technologies, including supercritical fluid and solvent-free methods, are improving yields and bioavailability, strengthening its adoption in pharmaceutical pipelines. At the same time, advances in multi-functional cosmetic and nutraceutical formulations are expanding market reach. Together, these trends are ensuring that ursolic acid secures a long-term role as a high-value, natural active across European pharmaceutical, cosmetic, and functional food industries.

Segment Analysis

Sales are segmented by application (end use), extraction method, purity, and region. By application, demand is categorized into pharmaceutical, cosmetics, and functional foods. Based on extraction, sales are divided into solvent extraction, supercritical fluid extraction, and solid phase extraction. In terms of purity, demand is segmented into below 95%, 95%–99%, and 99% and above. Regionally, demand is focused on Germany, France, Italy, Spain, the Netherlands, and the Rest of Europe.

By Application, Pharmaceutical Segment Accounts for 36% Share

Demand For Ursolic Acid In Eu Analysis By Application (end Use)

The pharmaceutical segment of the Ursolic Acid Market in the EU is projected to account for 36% of sales in 2025 (USD 0.9 million), increasing to 38% by 2035 (USD 1.8 million), making it the fastest-growing application area. This segment’s strength is underpinned by accelerating research into ursolic acid’s therapeutic potential across oncology, cardiovascular health, diabetes, and metabolic disorders. Its well-documented anti-inflammatory, antioxidant, and anti-cancer properties align closely with the EU’s growing emphasis on natural, plant-based actives for chronic disease management and preventive healthcare. Pharmaceutical manufacturers are increasingly incorporating ursolic acid into adjunct therapies, aiming to complement conventional treatments while offering safer, cleaner alternatives.

Regulatory support is another key driver. The European Food Safety Authority (EFSA) provides a clear framework for safety evaluations and labeling, giving manufacturers confidence in compliance and facilitating integration into therapeutic product pipelines. Investments are being directed toward improving bioavailability technologies, ensuring ursolic acid can achieve higher clinical efficacy, which is critical for drug development. With consumer demand for natural health solutions growing and clinical research validating its role, the pharmaceutical segment is set to emerge as the most strategically important driver of ursolic acid adoption in the EU.

Key advantages:
  • Strong role in cancer and cardiovascular research pipelines
  • Growing demand for natural actives in pharma formulations
  • Alignment with preventive healthcare and wellness strategies

By Extraction, Solvent Extraction Dominates with 60% Share

Demand For Ursolic Acid In Eu Analysis By Extraction Method

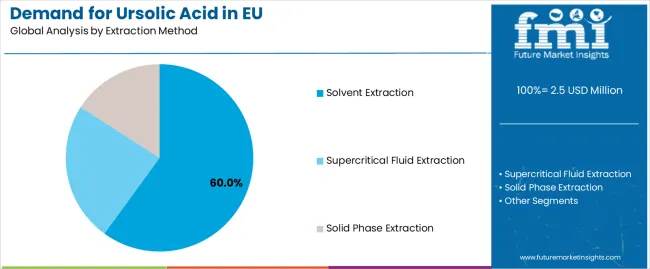
Solvent extraction continues to dominate the Ursolic Acid Market in the EU, accounting for 60% of total sales in 2025 (USD 1.5 million). Despite expectations that its share will decline to 50% by 2035 (USD 2.4 million), this method remains the most widely used approach due to its cost-effectiveness and ability to achieve consistent, large-scale output. Solvent extraction is especially valued in pharmaceutical and cosmetic-grade supply chains, where reliable yields and process familiarity are essential. Many EU manufacturers continue to adopt this method for its technical efficiency and scalability, particularly when producing intermediate grades of ursolic acid used in supplements and skincare formulations. Regulatory developments and consumer trends are reshaping the segment’s outlook. The EU’s sustainability mandates, coupled with EFSA’s increasing scrutiny of solvent residues, are creating pressure on producers to improve their environmental footprint. Consumers, meanwhile, are pushing for greener-label, eco-certified processes that minimize chemical use. While solvent extraction is expected to remain structurally important, especially in price-sensitive applications, its dominance will be increasingly challenged by supercritical fluid and other clean-extraction technologies. Producers investing in process innovation, hybrid methods, and improved waste management will be best positioned to maintain competitiveness while adapting to evolving EU sustainability requirements.

Key advantages:

  • Cost-efficient for bulk production
  • High yield suitable for pharma/cosmetic supply chains
  • Increasing regulatory scrutiny over solvent residues

What are the Drivers, Restraints, and Key Trends?

The demand for ursolic acid in the EU is advancing due to increasing consumer preference for natural skincare products, growing interest in the health benefits of plant-based ingredients, and the expanding use of ursolic acid in pharmaceutical and nutraceutical applications. The market faces challenges, including the limited availability of raw materials for production, high extraction costs, and regulatory barriers surrounding its use in food and pharmaceutical products. Ongoing innovation in green extraction technologies and the rise of multifunctional formulations continue to shape the industry development throughout the forecast period.

Growing Demand for Natural and Functional Skincare Products

The growing consumer shift towards natural and clean beauty is significantly driving the demand for ursolic acid in the EU. With its anti-aging, antioxidant, and anti-inflammatory properties, ursolic acid is gaining popularity in high-end skincare products. As more consumers prioritize natural ingredients in their daily skincare routines, demand for ursolic acid-based products is set to rise, particularly in the anti-aging and skin rejuvenation segments. This trend also extends to cosmetics focused on reducing environmental impact, aligning with broader consumer preferences for sustainable and organic formulations. Manufacturers are increasingly incorporating ursolic acid in premium skincare lines, making it a sought-after ingredient in Europe’s beauty industry.

Increasing Focus on Health and Wellness Benefits

The rising consumer interest in health and wellness continues to drive the ursolic acid market, particularly in the nutraceutical sector. Known for its potential anti-cancer, anti-inflammatory, and anti-obesity effects, ursolic acid is being researched for its therapeutic properties. The growing demand for plant-based ingredients in dietary supplements and functional foods further boosts its application. As consumers become more health-conscious, the need for effective, natural alternatives in both prevention and treatment options for various chronic diseases is fostering ursolic acid’s adoption in new product lines, including functional beverages and supplements.

Challenges in Raw Material Availability and Extraction Costs

The supply of ursolic acid is limited by the availability of raw materials such as apple peel, rosemary, and other plants. With demand increasing, there may be concerns over the sustainability and cost of sourcing these materials. The extraction process, which is often labor-intensive and costly, further contributes to high production costs. These factors may pose barriers to widespread use, particularly in mass-market products. Companies seeking to scale production of ursolic acid may encounter financial and logistical challenges related to maintaining a steady supply of raw materials at a reasonable cost.

Sustainability and Green Extraction Innovations

To address the growing demand for ursolic acid while minimizing environmental impact, significant advancements are being made in sustainable extraction technologies. Bio-based and green chemistry methods for extracting ursolic acid are transforming the production process, helping to reduce carbon footprints and reliance on petrochemical-based processes. As more companies focus on eco-friendly and efficient production techniques, the EU market is expected to see an increased supply of sustainable ursolic acid, meeting both environmental and consumer demand for natural products. These innovations are critical for positioning ursolic acid as a viable, long-term ingredient in the growing market for sustainable cosmetics and health products.

Rising Collaboration with Research Institutions

Collaborations between manufacturers and research institutions are expanding the scope of ursolic acid applications. In the pharmaceutical industry, research into its potential as an anti-cancer agent and other therapeutic applications is intensifying. Academic institutions and industry partners are increasingly working together to unlock the full potential of ursolic acid, exploring new extraction methods, enhancing its bioavailability, and creating innovative products. These research-driven collaborations are essential for further diversifying the uses of ursolic acid in both existing and new markets, such as advanced materials science and drug development.
Europe Split by Country

Demand For Ursolic Acid In Eu Europe Country Market Share Analysis, 2025 & 2035

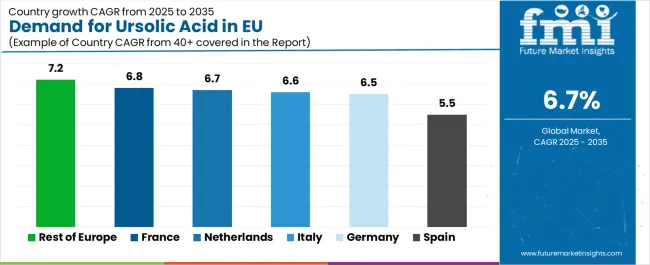
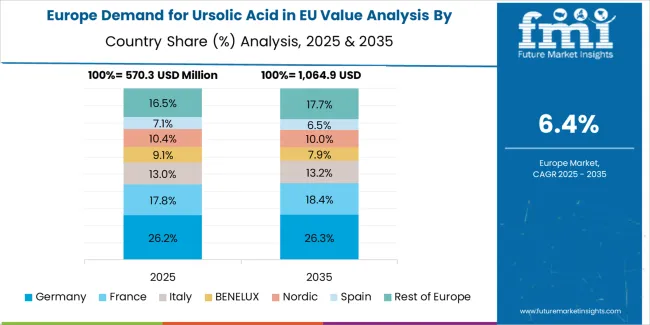
EU ursolic acid sales are projected to grow from USD 2.5 million in 2025 to USD 4.8 million by 2035, registering an overall CAGR of 6.7%. Germany maintains the largest share at 34% in 2025, reflecting its strong pharmaceutical and nutraceutical industries, followed by France (20%), Italy (15%), and Spain (12%). The Netherlands and Rest of Europe account for smaller but steadily rising shares, supported by growing cosmetics adoption, herbal product development, and research-driven pharmaceutical pipelines.

Country CAGR % (2025–2035)
Germany 6.5
France 6.8
Italy 6.6
Spain 5.5
Netherlands 6.7
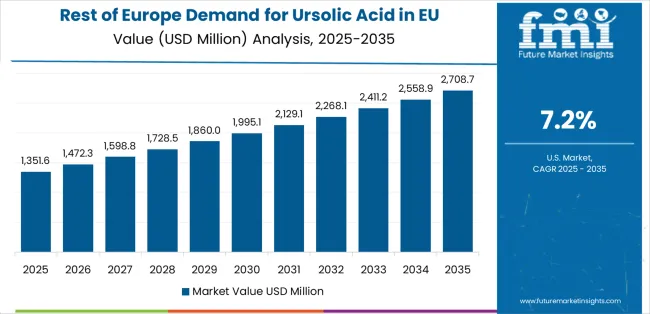
Rest of Europe 7.2

Demand For Ursolic Acid In Eu Cagr Analysis By Country

Germany Leads European Ursolic Acid Sales with Pharma Strength

Germany will remain the largest market for ursolic acid in the EU, expanding from USD 0.9 million in 2025 to USD 1.7 million by 2035, at a 6.5% CAGR. Its dominance stems from a strong pharmaceutical base, where ursolic acid is researched for oncology, cardiovascular, and metabolic disorders. The country also shows strong nutraceutical demand, with supplements highlighting antioxidant and anti-inflammatory benefits. Cosmetics adoption is steady, driven by premium anti-aging products and EFSA-aligned formulations. Germany’s position is reinforced by technical precision, clinical research infrastructure, and consumer preference for natural actives. Despite slower growth compared to smaller EU markets, Germany’s scale and pharmaceutical leadership ensure it remains the anchor for EU sales throughout the forecast period.

Key Highlights:

  • Largest EU market, anchored by pharma research.
  • Strong nutraceutical and cosmetic demand.
  • Compliance and EFSA frameworks support adoption.

France Demonstrates Strongest Growth with Premium Skincare and Wellness

France is forecast to expand from USD 0.5 million in 2025 to USD 1 million by 2035, advancing at a 6.8% CAGR, one of the highest among EU markets. Growth is driven by the country’s world-leading cosmetics sector, where ursolic acid is valued in premium skincare for anti-aging, whitening, and anti-inflammatory properties. Nutraceuticals add further momentum, supported by strong consumer interest in natural supplements targeting immunity and metabolic health. France’s emphasis on organic, vegan, and clean-label actives aligns with broader EU consumer shifts. Specialty cosmetic companies and dermocosmetic brands are integrating ursolic acid to differentiate portfolios, particularly in premium exports. This dual demand from beauty and wellness positions France as a fast-growing hub within Europe’s ursolic acid landscape.

Key Highlights:

  • Fastest growth driven by dermocosmetics.
  • Expanding nutraceutical adoption for preventive health.
  • Premium organic/vegan actives shape demand.

Italy Sustains Growth through Nutraceuticals and Cosmetics Integration

Italy’s ursolic acid market is expected to grow from USD 0.4 million in 2025 to USD 0.8 million by 2035, reflecting a 6.6% CAGR. Its strength lies in nutraceuticals and traditional herbal remedies, with strong adoption in supplements supporting cardiovascular and immune health. Cosmetics represent another key driver, with demand in premium skincare and anti-aging products tailored to Italy’s high-end beauty culture. Urban centers such as Milan and Rome are hotbeds of demand for natural cosmetics and wellness supplements. Italy’s artisanal food and beauty traditions are blending with innovation, creating opportunities for ursolic acid in functional foods and dermocosmetics. The combination of cultural heritage and modern wellness trends makes Italy a stable yet steadily expanding EU market.

Key Highlights:

  • Herbal nutraceuticals support consistent demand.
  • Premium skincare boosts cosmetic adoption.
  • Urban clean-label demand drives growth.

Spain Expands with Nutraceutical Demand and Research Adoption

Spain’s ursolic acid market will expand from USD 0.3 million in 2025 to USD 0.6 million by 2035, advancing at a 5.5% CAGR. Demand is shaped by Spain’s growing nutraceutical sector, which is increasingly focused on metabolic health, weight management, and antioxidant supplementation. Pharmaceutical research pipelines exploring natural bioactives further reinforce demand. While Spain’s chocolate and confectionery history is weaker than France or Germany, its agricultural resources and expanding functional food industry support opportunities for ursolic acid integration. Rising consumer awareness of preventive healthcare is increasing uptake of natural supplements. Although smaller in absolute size, Spain’s steady growth and adoption of EU labeling frameworks ensure its long-term role in the EU landscape.

Key Highlights:

  • Nutraceuticals drive bulk of consumption.
  • Pharma R&D enhances growth potential.
  • Cost-sensitive market supports steady expansion.

Netherlands Builds Position with Logistics and Specialty Supply

The Netherlands is projected to grow from USD 0.2 million in 2025 to USD 0.4 million by 2035, advancing at a 6.7% CAGR. Despite its small domestic base, its importance lies in logistics and re-export of nutraceutical and cosmetic ingredients. Dutch processors emphasize innovation and sustainability, with supercritical extraction gaining traction due to its green credentials. The Netherlands acts as a gateway for EU-wide distribution, leveraging its advanced trade infrastructure. Rising demand for vegan, organic, and certified ingredients enhances the role of Dutch suppliers. Though modest in volume, the Netherlands’ efficiency, innovation, and re-export strength ensure it has an outsized role in the European market.

Key Highlights:
  • Logistics hub for EU-wide distribution.
  • Sustainability drives extraction innovation.
  • Small but influential EU supplier base.

Rest of Europe Shows Fastest Relative Growth with Emerging Players

Demand For Ursolic Acid In Eu Country Value Analysis

The Rest of Europe segment is forecast to expand from USD 0.6 million in 2025 to USD 1.1 million by 2035, achieving the fastest CAGR at 7.2%. This includes dynamic markets such as Poland, Austria, and the Nordic countries, where nutraceutical and cosmetic demand is rising. These economies benefit from modernization of manufacturing facilities and growing integration into EU supply chains. Cost-sensitive supplement makers in Eastern Europe are adopting ursolic acid for affordability and functional benefits. Exports of affordable herbal supplements and cosmetic actives from these regions are increasing. While smaller in absolute terms, Rest of Europe represents the most dynamic growth opportunity in the EU.

Key Highlights:
  • Fastest growth among EU subregions.
  • Supplements drive early-stage adoption.
  • Modernization and exports reinforce momentum.

Competitive Landscape - Ursolic Acid Market in the EU

Demand For Ursolic Acid In Eu Analysis By Company

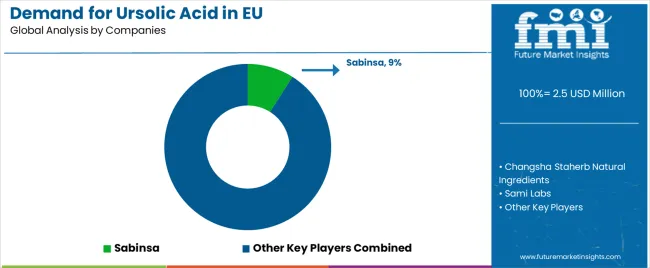
EU ursolic acid sales are characterized by competition among global botanical extract leaders, regional nutraceutical suppliers, and specialty ingredient companies. Manufacturers are focusing on improving extraction efficiency, securing sustainable plant-based raw material supply chains, and developing high-purity standardized grades for pharmaceuticals, cosmetics, and nutraceuticals. Investments are directed toward bioavailability-enhancing technologies, clean-label and solvent-free extraction, and certifications such as organic, vegan, and halal to align with EU consumer preferences. Strategic collaborations with pharmaceutical R&D labs, cosmetics brands, and supplement formulators are central to strengthening positioning in a fragmented market.

Key participants in the EU ursolic acid market include Sabinsa, holding an estimated 9% share, leveraging its global distribution network, standardized botanical portfolio, and strong European nutraceutical partnerships. Shaanxi Huike Botanical Development follows with approximately 6.5% share, supported by its extensive EU ingredient supply channels and investment in high-purity extracts for cosmetic and pharma clients. Changsha Staherb Natural Ingredients commands around 5% share, with strength in cosmetics-grade supply and growing links to EU personal care companies. The remaining ~79.5% of the market is highly fragmented, occupied by smaller regional botanical suppliers, niche phytochemical companies, and distributors catering to localized supplement, dermocosmetic, and R&D demand across Europe.

Key Players

  • Sabinsa
  • Changsha Staherb Natural Ingredients
  • Sami Labs
  • Changsha Luyuan Bio-Tech
  • Shaanxi Hopeland Chem-Tech
  • Run Shaanxi Days of Bio-tech
  • Xuancheng Baicao Pharmaceutical
  • Shaanxi Huike Botanical Development
  • Changsha E.K HERB
  • Acetar Bio-Tech

Scope of the Report - Ursolic Acid Market in the EU

Item Value
Quantitative Units USD 4.8 million (2035)
Product Type (Grade) Cosmetic-grade, Pharmaceutical-grade, Nutraceutical-grade
Application (End Use) Pharmaceuticals, Cosmetics, Functional Foods
Extraction Method Solvent Extraction, Supercritical Fluid Extraction, Solid Phase Extraction
Purity Level Below 95%, 95%–99%, 99% and above
Countries Covered Germany, France, Italy, Spain, Netherlands, Rest of Europe
Key Companies Profiled Sabinsa, Shaanxi Huike Botanical Development, Changsha Staherb Natural Ingredients, Sami Labs, Changsha Luyuan Bio-Tech, Acetar Bio-Tech
Additional Attributes Dollar sales by grade, application, extraction, and purity; EU demand trends across major economies; competitive landscape analysis with botanical extract suppliers and nutraceutical distributors; buyer preferences for clean-label, vegan, and organic bioactives; integration with sustainable plant sourcing and green extraction methods; innovations in multi-functional formulations; adoption across pharmaceuticals, premium cosmetics, and functional foods; regulatory framework analysis under EFSA and REACH guidelines; risk factors linked to raw material sourcing, solvent usage regulations, and fragmented supplier base.

Key Segments - Ursolic Acid Market in the EU

Product Type (Grade)

  • Cosmetic-grade
  • Pharmaceutical-grade
  • Nutraceutical-grade

Application (End Use)

  • Pharmaceuticals
  • Cosmetics
  • Functional Foods

Extraction Method

  • Solvent Extraction
  • Supercritical Fluid Extraction
  • Solid Phase Extraction

Purity Level

  • Below 95%
  • 95%–99%
  • 99% and above

Countries

  • Germany
  • France
  • Italy
  • Spain
  • Netherlands
  • Rest of Europe

Frequently Asked Questions

How big is the demand for ursolic acid in EU in 2025?

The global demand for ursolic acid in EU is estimated to be valued at USD 2.5 million in 2025.

What will be the size of demand for ursolic acid in EU in 2035?

The market size for the demand for ursolic acid in EU is projected to reach USD 4.8 million by 2035.

How much will be the demand for ursolic acid in EU growth between 2025 and 2035?

The demand for ursolic acid in EU is expected to grow at a 6.7% CAGR between 2025 and 2035.

What are the key product types in the demand for ursolic acid in eu?

The key product types in demand for ursolic acid in EU are pharmaceuticals, cosmetics and functional foods.

Which extraction method segment to contribute significant share in the demand for ursolic acid in EU in 2025?

In terms of extraction method, solvent extraction segment to command 60.0% share in the demand for ursolic acid in EU in 2025.

Table of Content

  1. Executive Summary
    • Global Market Outlook
    • Demand to side Trends
    • Supply to side Trends
    • Technology Roadmap Analysis
    • Analysis and Recommendations
  2. Market Overview
    • Market Coverage / Taxonomy
    • Market Definition / Scope / Limitations
  3. Market Background
    • Market Dynamics
      • Drivers
      • Restraints
      • Opportunity
      • Trends
    • Scenario Forecast
      • Demand in Optimistic Scenario
      • Demand in Likely Scenario
      • Demand in Conservative Scenario
    • Opportunity Map Analysis
    • Product Life Cycle Analysis
    • Supply Chain Analysis
    • Investment Feasibility Matrix
    • Value Chain Analysis
    • PESTLE and Porter’s Analysis
    • Regulatory Landscape
    • Regional Parent Market Outlook
    • Production and Consumption Statistics
    • Import and Export Statistics
  4. Global Market Analysis 2020 to 2024 and Forecast, 2025 to 2035
    • Historical Market Size Value (USD Million) Analysis, 2020 to 2024
    • Current and Future Market Size Value (USD Million) Projections, 2025 to 2035
      • Y to o to Y Growth Trend Analysis
      • Absolute $ Opportunity Analysis
  5. Global Market Pricing Analysis 2020 to 2024 and Forecast 2025 to 2035
  6. Global Market Analysis 2020 to 2024 and Forecast 2025 to 2035, By Application (End Use)
    • Introduction / Key Findings
    • Historical Market Size Value (USD Million) Analysis By Application (End Use) , 2020 to 2024
    • Current and Future Market Size Value (USD Million) Analysis and Forecast By Application (End Use) , 2025 to 2035
      • Pharmaceuticals
      • Cosmetics
      • Functional Foods
    • Y to o to Y Growth Trend Analysis By Application (End Use) , 2020 to 2024
    • Absolute $ Opportunity Analysis By Application (End Use) , 2025 to 2035
  7. Global Market Analysis 2020 to 2024 and Forecast 2025 to 2035, By Extraction Method
    • Introduction / Key Findings
    • Historical Market Size Value (USD Million) Analysis By Extraction Method, 2020 to 2024
    • Current and Future Market Size Value (USD Million) Analysis and Forecast By Extraction Method, 2025 to 2035
      • Solvent Extraction
      • Supercritical Fluid Extraction
      • Solid Phase Extraction
    • Y to o to Y Growth Trend Analysis By Extraction Method, 2020 to 2024
    • Absolute $ Opportunity Analysis By Extraction Method, 2025 to 2035
  8. Global Market Analysis 2020 to 2024 and Forecast 2025 to 2035, By Region
    • Introduction
    • Historical Market Size Value (USD Million) Analysis By Region, 2020 to 2024
    • Current Market Size Value (USD Million) Analysis and Forecast By Region, 2025 to 2035
      • North America
      • Latin America
      • Western Europe
      • Eastern Europe
      • East Asia
      • South Asia and Pacific
      • Middle East & Africa
    • Market Attractiveness Analysis By Region
  9. North America Market Analysis 2020 to 2024 and Forecast 2025 to 2035, By Country
    • Historical Market Size Value (USD Million) Trend Analysis By Market Taxonomy, 2020 to 2024
    • Market Size Value (USD Million) Forecast By Market Taxonomy, 2025 to 2035
      • By Country
        • USA
        • Canada
        • Mexico
      • By Application (End Use)
      • By Extraction Method
    • Market Attractiveness Analysis
      • By Country
      • By Application (End Use)
      • By Extraction Method
    • Key Takeaways
  10. Latin America Market Analysis 2020 to 2024 and Forecast 2025 to 2035, By Country
    • Historical Market Size Value (USD Million) Trend Analysis By Market Taxonomy, 2020 to 2024
    • Market Size Value (USD Million) Forecast By Market Taxonomy, 2025 to 2035
      • By Country
        • Brazil
        • Chile
        • Rest of Latin America
      • By Application (End Use)
      • By Extraction Method
    • Market Attractiveness Analysis
      • By Country
      • By Application (End Use)
      • By Extraction Method
    • Key Takeaways
  11. Western Europe Market Analysis 2020 to 2024 and Forecast 2025 to 2035, By Country
    • Historical Market Size Value (USD Million) Trend Analysis By Market Taxonomy, 2020 to 2024
    • Market Size Value (USD Million) Forecast By Market Taxonomy, 2025 to 2035
      • By Country
        • Germany
        • UK
        • Italy
        • Spain
        • France
        • Nordic
        • BENELUX
        • Rest of Western Europe
      • By Application (End Use)
      • By Extraction Method
    • Market Attractiveness Analysis
      • By Country
      • By Application (End Use)
      • By Extraction Method
    • Key Takeaways
  12. Eastern Europe Market Analysis 2020 to 2024 and Forecast 2025 to 2035, By Country
    • Historical Market Size Value (USD Million) Trend Analysis By Market Taxonomy, 2020 to 2024
    • Market Size Value (USD Million) Forecast By Market Taxonomy, 2025 to 2035
      • By Country
        • Russia
        • Poland
        • Hungary
        • Balkan & Baltic
        • Rest of Eastern Europe
      • By Application (End Use)
      • By Extraction Method
    • Market Attractiveness Analysis
      • By Country
      • By Application (End Use)
      • By Extraction Method
    • Key Takeaways
  13. East Asia Market Analysis 2020 to 2024 and Forecast 2025 to 2035, By Country
    • Historical Market Size Value (USD Million) Trend Analysis By Market Taxonomy, 2020 to 2024
    • Market Size Value (USD Million) Forecast By Market Taxonomy, 2025 to 2035
      • By Country
        • China
        • Japan
        • South Korea
      • By Application (End Use)
      • By Extraction Method
    • Market Attractiveness Analysis
      • By Country
      • By Application (End Use)
      • By Extraction Method
    • Key Takeaways
  14. South Asia and Pacific Market Analysis 2020 to 2024 and Forecast 2025 to 2035, By Country
    • Historical Market Size Value (USD Million) Trend Analysis By Market Taxonomy, 2020 to 2024
    • Market Size Value (USD Million) Forecast By Market Taxonomy, 2025 to 2035
      • By Country
        • India
        • ASEAN
        • Australia & New Zealand
        • Rest of South Asia and Pacific
      • By Application (End Use)
      • By Extraction Method
    • Market Attractiveness Analysis
      • By Country
      • By Application (End Use)
      • By Extraction Method
    • Key Takeaways
  15. Middle East & Africa Market Analysis 2020 to 2024 and Forecast 2025 to 2035, By Country
    • Historical Market Size Value (USD Million) Trend Analysis By Market Taxonomy, 2020 to 2024
    • Market Size Value (USD Million) Forecast By Market Taxonomy, 2025 to 2035
      • By Country
        • Kingdom of Saudi Arabia
        • Other GCC Countries
        • Turkiye
        • South Africa
        • Other African Union
        • Rest of Middle East & Africa
      • By Application (End Use)
      • By Extraction Method
    • Market Attractiveness Analysis
      • By Country
      • By Application (End Use)
      • By Extraction Method
    • Key Takeaways
  16. Key Countries Market Analysis
    • USA
      • Pricing Analysis
      • Market Share Analysis, 2024
        • By Application (End Use)
        • By Extraction Method
    • Canada
      • Pricing Analysis
      • Market Share Analysis, 2024
        • By Application (End Use)
        • By Extraction Method
    • Mexico
      • Pricing Analysis
      • Market Share Analysis, 2024
        • By Application (End Use)
        • By Extraction Method
    • Brazil
      • Pricing Analysis
      • Market Share Analysis, 2024
        • By Application (End Use)
        • By Extraction Method
    • Chile
      • Pricing Analysis
      • Market Share Analysis, 2024
        • By Application (End Use)
        • By Extraction Method
    • Germany
      • Pricing Analysis
      • Market Share Analysis, 2024
        • By Application (End Use)
        • By Extraction Method
    • UK
      • Pricing Analysis
      • Market Share Analysis, 2024
        • By Application (End Use)
        • By Extraction Method
    • Italy
      • Pricing Analysis
      • Market Share Analysis, 2024
        • By Application (End Use)
        • By Extraction Method
    • Spain
      • Pricing Analysis
      • Market Share Analysis, 2024
        • By Application (End Use)
        • By Extraction Method
    • France
      • Pricing Analysis
      • Market Share Analysis, 2024
        • By Application (End Use)
        • By Extraction Method
    • India
      • Pricing Analysis
      • Market Share Analysis, 2024
        • By Application (End Use)
        • By Extraction Method
    • ASEAN
      • Pricing Analysis
      • Market Share Analysis, 2024
        • By Application (End Use)
        • By Extraction Method
    • Australia & New Zealand
      • Pricing Analysis
      • Market Share Analysis, 2024
        • By Application (End Use)
        • By Extraction Method
    • China
      • Pricing Analysis
      • Market Share Analysis, 2024
        • By Application (End Use)
        • By Extraction Method
    • Japan
      • Pricing Analysis
      • Market Share Analysis, 2024
        • By Application (End Use)
        • By Extraction Method
    • South Korea
      • Pricing Analysis
      • Market Share Analysis, 2024
        • By Application (End Use)
        • By Extraction Method
    • Russia
      • Pricing Analysis
      • Market Share Analysis, 2024
        • By Application (End Use)
        • By Extraction Method
    • Poland
      • Pricing Analysis
      • Market Share Analysis, 2024
        • By Application (End Use)
        • By Extraction Method
    • Hungary
      • Pricing Analysis
      • Market Share Analysis, 2024
        • By Application (End Use)
        • By Extraction Method
    • Kingdom of Saudi Arabia
      • Pricing Analysis
      • Market Share Analysis, 2024
        • By Application (End Use)
        • By Extraction Method
    • Turkiye
      • Pricing Analysis
      • Market Share Analysis, 2024
        • By Application (End Use)
        • By Extraction Method
    • South Africa
      • Pricing Analysis
      • Market Share Analysis, 2024
        • By Application (End Use)
        • By Extraction Method
  17. Market Structure Analysis
    • Competition Dashboard
    • Competition Benchmarking
    • Market Share Analysis of Top Players
      • By Regional
      • By Application (End Use)
      • By Extraction Method
  18. Competition Analysis
    • Competition Deep Dive
      • Sabinsa
        • Overview
        • Product Portfolio
        • Profitability by Market Segments (Product/Age /Sales Channel/Region)
        • Sales Footprint
        • Strategy Overview
          • Marketing Strategy
          • Product Strategy
          • Channel Strategy
      • Changsha Staherb Natural Ingredients
      • Sami Labs
      • Changsha Luyuan Bio-Tech
      • Shaanxi Hopeland Chem-Tech
      • Run Shaanxi Days of Bio-tech
      • Xuancheng Baicao Pharmaceutical
      • Shaanxi Huike Botanical Development
      • Changsha E.K HERB
      • Acetar Bio-Tech
  19. Assumptions & Acronyms Used
  20. Research Methodology

List of Tables

  • Table 1: Global Market Value (USD Million) Forecast by Region, 2020 to 2035
  • Table 2: Global Market Value (USD Million) Forecast by Application (End Use) , 2020 to 2035
  • Table 3: Global Market Value (USD Million) Forecast by Extraction Method, 2020 to 2035
  • Table 4: North America Market Value (USD Million) Forecast by Country, 2020 to 2035
  • Table 5: North America Market Value (USD Million) Forecast by Application (End Use) , 2020 to 2035
  • Table 6: North America Market Value (USD Million) Forecast by Extraction Method, 2020 to 2035
  • Table 7: Latin America Market Value (USD Million) Forecast by Country, 2020 to 2035
  • Table 8: Latin America Market Value (USD Million) Forecast by Application (End Use) , 2020 to 2035
  • Table 9: Latin America Market Value (USD Million) Forecast by Extraction Method, 2020 to 2035
  • Table 10: Western Europe Market Value (USD Million) Forecast by Country, 2020 to 2035
  • Table 11: Western Europe Market Value (USD Million) Forecast by Application (End Use) , 2020 to 2035
  • Table 12: Western Europe Market Value (USD Million) Forecast by Extraction Method, 2020 to 2035
  • Table 13: Eastern Europe Market Value (USD Million) Forecast by Country, 2020 to 2035
  • Table 14: Eastern Europe Market Value (USD Million) Forecast by Application (End Use) , 2020 to 2035
  • Table 15: Eastern Europe Market Value (USD Million) Forecast by Extraction Method, 2020 to 2035
  • Table 16: East Asia Market Value (USD Million) Forecast by Country, 2020 to 2035
  • Table 17: East Asia Market Value (USD Million) Forecast by Application (End Use) , 2020 to 2035
  • Table 18: East Asia Market Value (USD Million) Forecast by Extraction Method, 2020 to 2035
  • Table 19: South Asia and Pacific Market Value (USD Million) Forecast by Country, 2020 to 2035
  • Table 20: South Asia and Pacific Market Value (USD Million) Forecast by Application (End Use) , 2020 to 2035
  • Table 21: South Asia and Pacific Market Value (USD Million) Forecast by Extraction Method, 2020 to 2035
  • Table 22: Middle East & Africa Market Value (USD Million) Forecast by Country, 2020 to 2035
  • Table 23: Middle East & Africa Market Value (USD Million) Forecast by Application (End Use) , 2020 to 2035
  • Table 24: Middle East & Africa Market Value (USD Million) Forecast by Extraction Method, 2020 to 2035

List of Figures

  • Figure 1: Global Market Pricing Analysis
  • Figure 2: Global Market Value (USD Million) Forecast 2020-2035
  • Figure 3: Global Market Value Share and BPS Analysis by Application (End Use) , 2025 and 2035
  • Figure 4: Global Market Y to o to Y Growth Comparison by Application (End Use) , 2025-2035
  • Figure 5: Global Market Attractiveness Analysis by Application (End Use)
  • Figure 6: Global Market Value Share and BPS Analysis by Extraction Method, 2025 and 2035
  • Figure 7: Global Market Y to o to Y Growth Comparison by Extraction Method, 2025-2035
  • Figure 8: Global Market Attractiveness Analysis by Extraction Method
  • Figure 9: Global Market Value (USD Million) Share and BPS Analysis by Region, 2025 and 2035
  • Figure 10: Global Market Y to o to Y Growth Comparison by Region, 2025-2035
  • Figure 11: Global Market Attractiveness Analysis by Region
  • Figure 12: North America Market Incremental Dollar Opportunity, 2025-2035
  • Figure 13: Latin America Market Incremental Dollar Opportunity, 2025-2035
  • Figure 14: Western Europe Market Incremental Dollar Opportunity, 2025-2035
  • Figure 15: Eastern Europe Market Incremental Dollar Opportunity, 2025-2035
  • Figure 16: East Asia Market Incremental Dollar Opportunity, 2025-2035
  • Figure 17: South Asia and Pacific Market Incremental Dollar Opportunity, 2025-2035
  • Figure 18: Middle East & Africa Market Incremental Dollar Opportunity, 2025-2035
  • Figure 19: North America Market Value Share and BPS Analysis by Country, 2025 and 2035
  • Figure 20: North America Market Value Share and BPS Analysis by Application (End Use) , 2025 and 2035
  • Figure 21: North America Market Y to o to Y Growth Comparison by Application (End Use) , 2025-2035
  • Figure 22: North America Market Attractiveness Analysis by Application (End Use)
  • Figure 23: North America Market Value Share and BPS Analysis by Extraction Method, 2025 and 2035
  • Figure 24: North America Market Y to o to Y Growth Comparison by Extraction Method, 2025-2035
  • Figure 25: North America Market Attractiveness Analysis by Extraction Method
  • Figure 26: Latin America Market Value Share and BPS Analysis by Country, 2025 and 2035
  • Figure 27: Latin America Market Value Share and BPS Analysis by Application (End Use) , 2025 and 2035
  • Figure 28: Latin America Market Y to o to Y Growth Comparison by Application (End Use) , 2025-2035
  • Figure 29: Latin America Market Attractiveness Analysis by Application (End Use)
  • Figure 30: Latin America Market Value Share and BPS Analysis by Extraction Method, 2025 and 2035
  • Figure 31: Latin America Market Y to o to Y Growth Comparison by Extraction Method, 2025-2035
  • Figure 32: Latin America Market Attractiveness Analysis by Extraction Method
  • Figure 33: Western Europe Market Value Share and BPS Analysis by Country, 2025 and 2035
  • Figure 34: Western Europe Market Value Share and BPS Analysis by Application (End Use) , 2025 and 2035
  • Figure 35: Western Europe Market Y to o to Y Growth Comparison by Application (End Use) , 2025-2035
  • Figure 36: Western Europe Market Attractiveness Analysis by Application (End Use)
  • Figure 37: Western Europe Market Value Share and BPS Analysis by Extraction Method, 2025 and 2035
  • Figure 38: Western Europe Market Y to o to Y Growth Comparison by Extraction Method, 2025-2035
  • Figure 39: Western Europe Market Attractiveness Analysis by Extraction Method
  • Figure 40: Eastern Europe Market Value Share and BPS Analysis by Country, 2025 and 2035
  • Figure 41: Eastern Europe Market Value Share and BPS Analysis by Application (End Use) , 2025 and 2035
  • Figure 42: Eastern Europe Market Y to o to Y Growth Comparison by Application (End Use) , 2025-2035
  • Figure 43: Eastern Europe Market Attractiveness Analysis by Application (End Use)
  • Figure 44: Eastern Europe Market Value Share and BPS Analysis by Extraction Method, 2025 and 2035
  • Figure 45: Eastern Europe Market Y to o to Y Growth Comparison by Extraction Method, 2025-2035
  • Figure 46: Eastern Europe Market Attractiveness Analysis by Extraction Method
  • Figure 47: East Asia Market Value Share and BPS Analysis by Country, 2025 and 2035
  • Figure 48: East Asia Market Value Share and BPS Analysis by Application (End Use) , 2025 and 2035
  • Figure 49: East Asia Market Y to o to Y Growth Comparison by Application (End Use) , 2025-2035
  • Figure 50: East Asia Market Attractiveness Analysis by Application (End Use)
  • Figure 51: East Asia Market Value Share and BPS Analysis by Extraction Method, 2025 and 2035
  • Figure 52: East Asia Market Y to o to Y Growth Comparison by Extraction Method, 2025-2035
  • Figure 53: East Asia Market Attractiveness Analysis by Extraction Method
  • Figure 54: South Asia and Pacific Market Value Share and BPS Analysis by Country, 2025 and 2035
  • Figure 55: South Asia and Pacific Market Value Share and BPS Analysis by Application (End Use) , 2025 and 2035
  • Figure 56: South Asia and Pacific Market Y to o to Y Growth Comparison by Application (End Use) , 2025-2035
  • Figure 57: South Asia and Pacific Market Attractiveness Analysis by Application (End Use)
  • Figure 58: South Asia and Pacific Market Value Share and BPS Analysis by Extraction Method, 2025 and 2035
  • Figure 59: South Asia and Pacific Market Y to o to Y Growth Comparison by Extraction Method, 2025-2035
  • Figure 60: South Asia and Pacific Market Attractiveness Analysis by Extraction Method
  • Figure 61: Middle East & Africa Market Value Share and BPS Analysis by Country, 2025 and 2035
  • Figure 62: Middle East & Africa Market Value Share and BPS Analysis by Application (End Use) , 2025 and 2035
  • Figure 63: Middle East & Africa Market Y to o to Y Growth Comparison by Application (End Use) , 2025-2035
  • Figure 64: Middle East & Africa Market Attractiveness Analysis by Application (End Use)
  • Figure 65: Middle East & Africa Market Value Share and BPS Analysis by Extraction Method, 2025 and 2035
  • Figure 66: Middle East & Africa Market Y to o to Y Growth Comparison by Extraction Method, 2025-2035
  • Figure 67: Middle East & Africa Market Attractiveness Analysis by Extraction Method
  • Figure 68: Global Market - Tier Structure Analysis
  • Figure 69: Global Market - Company Share Analysis
Dashboard
Dashboard
Dashboard
Dashboard
Dashboard
Dashboard

Full Research Suite comprises of:

Market outlook & trends analysis

Market outlook & trends analysis

Interviews & case studies

Interviews & case studies

Strategic recommendations

Strategic recommendations

Vendor profiles & capabilities analysis

Vendor profiles & capabilities analysis

5-year forecasts

5-year forecasts

8 regions and 60+ country-level data splits

8 regions and 60+ country-level data splits

Market segment data splits

Market segment data splits

12 months of continuous data updates

12 months of continuous data updates

DELIVERED AS:

PDF EXCEL ONLINE

Full Research Suite


$5000

$7500

$10000

Buy Report Now
Similar Industry Reports

Similar Industry Reports

Demand Signal Repository Solutions Market

Demand Signal Repository Solutions Market Size and Share Forecast Outlook 2025 to 2035

Demand Side Management Market

Demand Side Management Market Size and Share Forecast Outlook 2025 to 2035

Demand Response Market

Demand Response Market Analysis - Size, Share, and Forecast Outlook 2025 to 2035

Demand Analysis of Shipping Supplies in North America

North America Shipping Supplies Market Trends – Innovations & Growth 2024-2034

Demand of Kozani Saffron in Greece

Demand of Kozani Saffron in Greece Analysis - Size, Share & Forecast 2025 to 2035

Demand of Bronte Pistachio in Italy

Demand for Bronte Pistachio in Italy Analysis - Size, Share & Forecast 2025 to 2035

Demand and Trend Analysis of Gaming Monitor in Japan

Demand and Trend Analysis of Gaming Monitor in Japan Size and Share Forecast Outlook 2025 to 2035

Demand and Trend Analysis of Gaming Monitor in Korea

Demand and Trend Analysis of Gaming Monitor in Korea Size and Share Forecast Outlook 2025 to 2035

Demand and Trend Analysis of Gaming Monitor in Western Europe

Demand and Trend Analysis of Gaming Monitor in Western Europe Size and Share Forecast Outlook 2025 to 2035

Demand and Trend Analysis of Glycine Soja (Soybean) Seed Extract Market

Glycine Soja (Soybean) Seed Extract Market Size and Share Forecast Outlook 2025 to 2035

Demand and Trend Analysis of Yeast in Japan

Demand and Trend Analysis of Yeast in Japan - Size, Share, and Forecast Outlook 2025 to 2035

Demand and Trends Analysis of Stevia in Japan

Demand and Trends Analysis of Stevia in Japan Size and Share Forecast Outlook 2025 to 2035

Demand of Pistachio-based desserts & ingredients in France

Demand of Pistachio-based desserts & ingredients in France Analysis - Size, Share & Forecast 2025 to 2035

Demand and Trend Analysis of Women’s Intimate Care Product in Japan

Japan Women’s Intimate Care Market Trends – Growth & Forecast 2024-2034

Demand and Trend Analysis of Men’s Skincare Product in Western Europe

Western Europe Men’s Skincare Market Analysis – Forecast 2023-2033

Demand and Trend Analysis of Fabric Stain Remover in Korea

Demand and Trend Analysis of Fabric Stain Remover in Korea Size and Share Forecast Outlook 2025 to 2035

Demand and Sales Analysis of Paper Cup in Japan

Demand and Sales Analysis of Paper Cup in Japan Size and Share Forecast Outlook 2025 to 2035

Demand and Sales Analysis of Paper Cup in Korea

Demand and Sales Analysis of Paper Cup in Korea Size and Share Forecast Outlook 2025 to 2035

Demand of MFGM-enriched Powders & RTDs in European Union

Demand of MFGM-enriched Powders & RTDs in European Union Size and Share Forecast Outlook 2025 to 2035

Demand and Sales Analysis of Paper Cup in Western Europe

Demand and Sales Analysis of Paper Cup in Western Europe Size and Share Forecast Outlook 2025 to 2035

Future Market Insights

Demand for Ursolic Acid in EU

Chat With MaRIA

Chat With

MaRIA

Hi There, I am MaRIA, Your Market Research Intelligence Assistant. How may I help you?