The EU water flavouring drops sector valued at USD 13.9 billion in 2025 and projected to reach USD 15.5 billion by 2035 at a CAGR of 1.1% is underpinned by complex supply and production dynamics that shape its long-term outlook. Raw material sourcing is dominated by high intensity sweeteners such as stevia glycosides, sucralose, and aspartame, supported by acidulants like citric and malic acid, natural extracts, artificial flavors, and stabilizers. Glycerin, propylene glycol, and preservatives are widely used as carriers, with primary packaging based on PET, rPET, or glass bottles. Flavor houses in Germany, the Netherlands, and Switzerland act as strategic suppliers, while imports of citrus derivatives and vanilla extracts from Latin America and Asia expose producers to foreign exchange volatility. Cost structures remain sensitive to fluctuations in agricultural inputs, oil-derived intermediates, and packaging resins, prompting many firms to employ dual sourcing and hedging strategies.
Production capacity in the EU is distributed across medium-scale plants in Poland, Germany, Italy, and France, where co-packers handle both branded and private label lines. Utilization rates are moderate due to SKU diversity, seasonality, and promotional surges, but line expansions are occurring through added filling and cartoning capacity rather than new greenfield plants. Investment is often channeled into automation that allows shift optimization during high-demand periods such as summer hydration campaigns. Contract manufacturing networks are expected to tighten, as retailers increase their reliance on dedicated suppliers to ensure security of supply for private label drops.
Manufacturing processes emphasize blending, emulsification, and microencapsulation to ensure clarity, stability, and flavor release in water. Advanced mixing and aseptic filling technologies coupled with clean-in-place systems reduce contamination risk and extend shelf life. Digital recipe management, automated dosing, and viscosity monitoring cut batch variability, while sensory evaluation combined with GC-MS verification ensures product consistency. These investments lower wastage and reduce the energy footprint per liter produced, improving process efficiency.
Integration patterns differ among players. Backward integration into raw material intermediates is rare, aside from large incumbents that own flavor production units. Most firms adopt asset-light models, sourcing flavor compounds from specialized suppliers. Forward integration is visible in direct-to-consumer models where companies operate their own e-commerce storefronts and leverage subscription services for functional hydration drops. Horizontal integration is gaining pace as firms acquire or launch adjacent categories such as syrups, powders, and functional sachets to diversify portfolios.
Supply chain resilience depends on diversifying flavor compound suppliers, building safety stocks of sweeteners, and applying vendor managed inventory for high-volume SKUs. Ambient shipping and palletized distribution through 3PLs reduce logistics complexity, while e-commerce channels require specialized last-mile fulfillment models. Country-specific EFSA regulations on labeling add lead time to packaging runs, necessitating agile artwork management to avoid disruptions.
Circular economy relevance is expanding as brands move toward mono-material closures, lightweight bottles, and higher PCR content. Refill pouches and returnable formats are being piloted, while off-spec batches are reduced by first-time-right controls and redirected when possible into animal feed or low-grade industrial use. Retailers encourage design-for-recycling to improve recovery, while consumer demand for clean-label, sugar-reduced, and convenient hydration solutions reinforces the sector’s reliance on innovation, compliance, and packaging redesign as critical growth levers.
| Metric | Value |
|---|---|
| Estimated Value in (2025E) | USD 13.9 billion |
| Forecast Value in (2035F) | USD 15.5 billion |
| Forecast CAGR (2025 to 2035) | 1.1% |
Industry expansion is being supported by the rising health consciousness among European consumers and the demand for convenient, sugar-free hydration solutions that deliver both flavour variety and functional benefits. Water flavouring drops enable personalized hydration experiences, allowing consumers to control flavour intensity and sweetness levels while avoiding the calories and sugar content of traditional beverages. The category benefits from dual drivers: necessity-driven adoption by health-conscious consumers seeking alternatives to sugary drinks, and choice-driven demand for convenient, portable hydration enhancers that fit modern, on-the-go lifestyles. This convergence of health benefits, convenience, and flavour customization is creating sustained opportunities across retail, e-commerce, and direct-to-consumer channels.
The growing body of scientific evidence linking proper hydration with cognitive function, physical performance, and overall wellness is driving the uptake of water-flavoring drops across multiple consumer segments. European regulations encouraging reduced sugar consumption and clean-label formulations further reinforce demand, as water flavouring drops provide flavour without compromising health goals. Producers with advanced formulation capabilities, particularly in natural sweetening systems like stevia, gain competitive advantages by offering products that deliver authentic taste experiences without artificial aftertaste. At the same time, organic-certified drops provide reassurance of quality and naturalness, aligning with evolving consumer preferences for transparency and sustainability across the EU.
Expanding functional positioning and vitamin-mineral fortification further elevate the role of water flavouring drops in EU industry. Clinical and consumer studies highlight benefits of enhanced hydration combined with targeted nutrition delivery, creating pathways for innovative formulations that address specific wellness needs. Regulatory emphasis on natural ingredients and nutritional transparency supports broader category legitimacy, giving dedicated suppliers an edge in premium product positioning. Beyond basic flavor enhancement, water flavoring drops are increasingly seen as functional hydration solutions that deliver taste, nutrition, and convenience simultaneously. This growing normalization across diverse consumer demographics ensures water flavouring drops will remain a central growth driver in EU's beverage alternatives economy.
Sales of water flavouring drops are segmented by product type, nature, application, distribution channel, and region. By product type, demand spans stevia-sweetened, artificially sweetened, naturally sweetened (non-stevia), sugar-sweetened, and unsweetened variants, with stevia-sweetened leading growth due to their health profile and taste optimization.
By nature, the industry is split between conventional and organic, with organic gaining significant traction on clean-label demand. Applications include fruit-based, functional (vitamins/minerals/herbs), and tea/coffee enhancers; fruit-based leads, but functional applications are expanding faster.
Distribution channels comprise superindustries/hyperindustries, online retail, convenience stores, and specialty/drug stores, with online showing the strongest growth trajectory. Regionally, sales cover Germany, France, Italy, Spain, Netherlands, and Rest of Europe, with Netherlands demonstrating the highest growth potential.
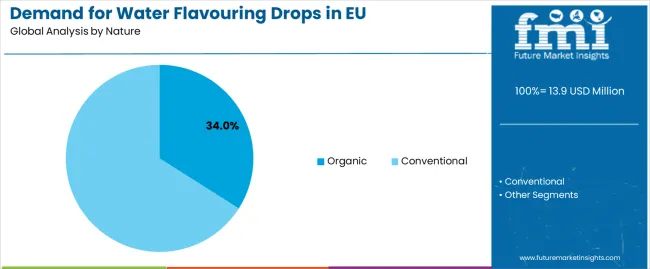
The organic segment is projected to account for 24.0% of EU water flavouring drops sales in 2025, increasing substantially to 34.0% by 2035, firmly establishing itself as the faster-growing category and reflecting Europe's strong preference for clean-label, certified natural products. Growth is fundamentally supported by consumer perception linking organic water flavouring drops with higher purity, absence of synthetic additives, and environmental sustainability, combined with increasing retail availability and consumer willingness to pay premiums for products aligned with health and ecological values. Organic drops deliver comprehensive value propositions by meeting both functional hydration needs and eco-conscious priorities, including pesticide-free sourcing, non-GMO assurance, and sustainable production practices.
This segment benefits from premium positioning, enhanced retail visibility, and growing consumer trust, creating loyalty particularly among health-focused households and younger demographics prioritizing wellness and sustainability. Organic certification enhances product differentiation, supports margin expansion, and aligns directly with EU sustainability frameworks and Green Deal objectives, making it attractive to both established brands and innovative startups. As a result, organic water flavouring drops are increasingly incorporated into premium product lines, subscription services, and direct-to-consumer offerings.
The segment's share increase through 2035 reflects accelerating consumer prioritization of ingredient transparency and environmental responsibility, with organic water flavouring drops increasingly viewed as the optimal choice for families, fitness enthusiasts, and environmentally conscious consumers.
Key advantages:
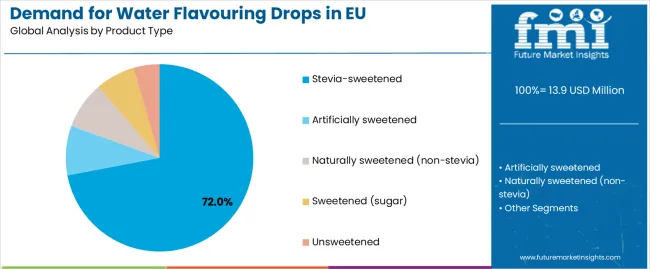
Stevia-sweetened water flavouring drops are positioned to represent 70% of total EU industry demand in 2025, increasing to 72.0% by 2035, reflecting their strong health positioning and consumer acceptance of natural zero-calorie sweetening. This dominant share demonstrates the successful evolution of stevia formulations that have overcome early taste challenges through advanced processing and flavour masking technologies.
European manufacturers are innovating with stevia-based formulations that combine multiple steviol glycosides to optimize sweetness profiles, reduce aftertaste, and deliver authentic fruit flavours that rival sugar-sweetened alternatives. The segment benefits from regulatory support for natural sweeteners, consumer awareness of stevia's plant-based origins, and successful industrying narratives around guilt-free hydration and diabetes-friendly options.
The segment's continued dominance through 2035 reflects its role as the cornerstone of healthy hydration, enabling mainstream adoption of water flavouring drops while satisfying consumer demands for natural, zero-calorie sweetening solutions that don't compromise on taste.
Key drivers:
EU water flavouring drops sales are advancing due to increasing demand for sugar reduction solutions, rising adoption of personalized hydration products, and the shift toward convenient, portable beverage alternatives that align with active lifestyles. However, the industry faces challenges, including taste perception barriers for some natural sweeteners, premium pricing compared to bulk beverages, and competition from ready-to-drink alternatives. Continued innovation in flavour technology and sweetening systems remains central to delivering superior taste experiences and unlocking new consumer segments across demographics.
The rapid expansion of e-commerce and direct-to-consumer channels is fundamentally transforming water flavouring drops distribution, with online sales projected to grow from 25.0% share in 2025 to 35.0% by 2035. Unlike traditional retail, digital platforms enable subscription models, personalized recommendations, and direct brand-consumer relationships that drive loyalty and lifetime value. This shift proves especially transformative for innovative brands like Waterdrop, which has built a strong EU presence through digital-first strategies, influencer partnerships, and sustainable packaging narratives.
Major European retailers are investing heavily in omnichannel capabilities, click-and-collect services, and rapid delivery infrastructure that blur lines between online and offline shopping. Subscription services offering monthly flavour variety packs, personalized hydration goals, and auto-replenishment are gaining traction among busy professionals and health-conscious households. As a result, digital channels are increasingly positioned as the primary growth engine for water flavouring drops, enabling brands to bypass traditional retail constraints and build direct consumer relationships.
Modern water flavouring drops producers systematically incorporate functional ingredients, transforming basic flavour enhancers into targeted wellness solutions. The functional segment, encompassing vitamins, minerals, herbs, and bioactives, is projected to grow from 28.0% share in 2025 to 35.0% by 2035, reflecting consumer demand for hydration products that deliver additional health benefits. This integration of functional positioning allows companies to command premium pricing while addressing specific consumer needs such as immunity support, energy enhancement, cognitive focus, and recovery optimization.
Leading suppliers implement clinical validation, transparent labeling, and education campaigns to substantiate functional claims and build consumer trust. Products featuring vitamin C for immunity, B-vitamins for energy, electrolytes for hydration, and adaptogens for stress management are gaining mainstream acceptance. By aligning water flavouring drops with broader European trends in preventive health, functional nutrition, and holistic wellness, manufacturers position their products as essential daily wellness tools rather than simple beverage alternatives.
European consumers increasingly prioritize sustainably packaged water flavouring drops, with packaging innovation becoming a key differentiator in purchase decisions. Brands are transitioning from traditional plastic bottles to glass containers, recyclable materials, and concentrated formulas that reduce packaging waste per serving. Companies adopting refillable systems, biodegradable packaging, and carbon-neutral shipping are capturing share among environmentally conscious consumers who view sustainable packaging as non-negotiable.
The emphasis on sustainability extends beyond packaging to ingredient sourcing, with organic certification, fair-trade partnerships, and transparent supply chains building brand credibility. Water flavouring drops inherently support sustainability by reducing single-use plastic bottle consumption, a message that resonates strongly with European consumers concerned about plastic pollution. Brands successfully communicating their environmental impact reduction, water conservation benefits, and circular economy principles are well-positioned to capture growing demand from sustainability-focused consumer segments.
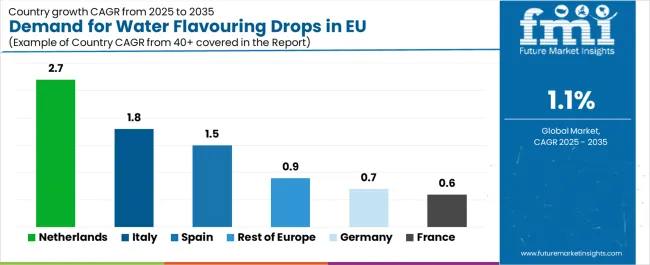
| Country | CAGR % (2025 to 2035) |
|---|---|
| Netherlands | 2.7% |
| Italy | 1.8% |
| Spain | 1.5% |
| Rest of Europe | 0.9% |
| Germany | 0.7% |
| France | 0.6% |
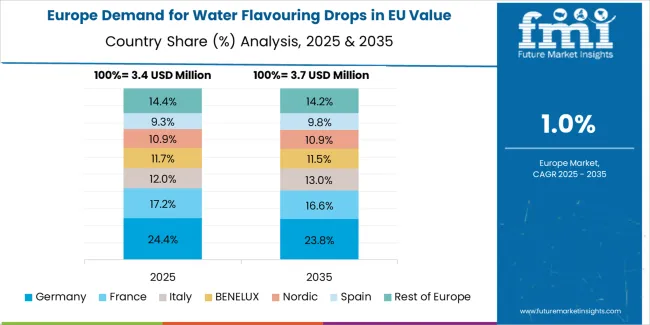
Germany is projected to remain the largest EU water flavouring drops industry, expanding from USD 3,619.0 million in 2025 to USD 3,880.3 million by 2035, at a modest 0.7% CAGR. Growth is anchored by Germany's mature retail infrastructure, established consumer base, and strong presence of both international and domestic brands. Major retailers including Edeka, Rewe, and dm Drogerie have expanded water flavouring drops assortments, while German consumers show steady adoption of stevia-sweetened and organic variants. German demand benefits from high health awareness, environmental consciousness, and preference for quality products. While growth is moderate compared to emerging industries, Germany's scale ensures steady expansion through premiumization, functional innovation, and sustainable packaging rather than rapid volume growth.
Growth drivers:
France is forecast to grow from USD 2,783.8 million in 2025 to USD 2,948.0 million in 2035, recording a 0.6% CAGR. Growth is supported by France's sophisticated consumer palate, preference for natural ingredients, and rising integration of water flavouring drops in wellness routines. French consumers value authentic flavours, natural sweetening, and organic certification, pushing producers to deliver premium formulations that meet gastronomic standards. Retailers including Carrefour, Leclerc, and Monoprix showcase premium and organic ranges, while pharmacies increasingly stock functional variants. The French industry reflects emphasis on quality over quantity, with consumers willing to pay premiums for superior taste profiles and clean-label formulations.
Success factors:
Italy's water flavouring drops sales are projected to expand from USD 2,087.8 million in 2025 to USD 2,483.4 million in 2035, reflecting a robust 1.8% CAGR, the second-highest among major industries. Growth is shaped by Italy's evolving beverage culture, with younger consumers embracing healthier hydration alternatives to traditional sugary drinks. Rising fitness awareness, particularly in urban centers like Milan and Rome, drives adoption of functional water enhancers. Retailers including Esselunga, Coop, and Conad are expanding offerings, while Italian consumers show growing interest in fruit-based and naturally sweetened variants. Italy's growth trajectory reflects successful industry education, product localization with Mediterranean flavours, and alignment with wellness trends.
Development factors:
Spain's water flavouring drops demand is set to grow from USD 1,670.3 million in 2025 to USD 1,940.1 million by 2035, at a 1.5% CAGR. Expansion is supported by Spain's outdoor lifestyle culture, growing gym membership rates, and increasing awareness of sugar reduction benefits. Spanish retailers, including Mercadona, El Corte Inglés, and Carrefour Spain, are expanding water flavouring drops presence, particularly in urban areas. Spain benefits from its warm climate driving hydration needs, while tourism contributes additional seasonal demand. Mediterranean fruit flavours perform particularly well, reflecting local taste preferences. This steady growth positions Spain as a key growth industry within Southern Europe.
Growth enablers:
The Netherlands is forecast to expand from USD 835.1 million in 2025 to USD 1,086.5 million by 2035, advancing at a industry-leading 2.7% CAGR. Growth is driven by the Netherlands' progressive consumer attitudes, high e-commerce penetration, and early adoption of innovative health products. Dutch consumers show strong receptivity to subscription models, with brands like Waterdrop gaining significant traction through direct-to-consumer channels. The Netherlands benefits from high disposable incomes, health-conscious population, and environmental awareness driving preference for reusable bottle systems with flavour drops. Retailers including Albert Heijn, Jumbo, and Kruidvat actively promote water enhancers, while the country's cycling culture and active lifestyle reinforce hydration product adoption.
Innovation drivers:
The Rest of Europe segment, encompassing Nordic countries, Eastern Europe, and smaller Western European industries, is projected to grow from USD 2,922.9 million in 2025 to USD 3,182.8 million by 2035, at a 0.9% CAGR. Growth reflects heterogeneous industry dynamics: Nordic countries (Sweden, Denmark, Norway, Finland) demonstrate strong adoption driven by health consciousness, high disposable incomes, and preference for natural products. Eastern European industries (Poland, Czech Republic, Hungary) show emerging demand as rising incomes enable premium product adoption. Belgium, Austria, and Switzerland contribute stable growth through established retail channels and health-focused consumers. This diverse segment provides growth resilience through varied industry maturity stages and consumer preferences.
Potential drivers:
EU water flavouring drops sales are projected to grow from USD 13.9 billion in 2025 to USD 15.5 billion by 2035, registering a steady CAGR of 1.1% over the forecast period. The Netherlands demonstrates the strongest growth trajectory with a 2.7% CAGR, supported by progressive consumer attitudes, strong e-commerce penetration, and early adoption of innovative hydration products. Italy follows with a 1.8% CAGR, driven by evolving beverage preferences and growing health consciousness among younger demographics.
Spain records a 1.5% CAGR, supported by rising fitness culture and increasing adoption of sugar-free alternatives. Rest of Europe shows a 0.9% CAGR, reflecting diverse industry dynamics across Nordic, Eastern European, and smaller Western European industries. Germany remains the largest individual industry, accounting for 26.0% of EU water flavouring drops sales in 2025, though growing at a modest 0.7% CAGR reflecting industry maturity. France contributes a 20.0% share with a 0.6% CAGR, showing stable but slow growth patterns typical of established industries.
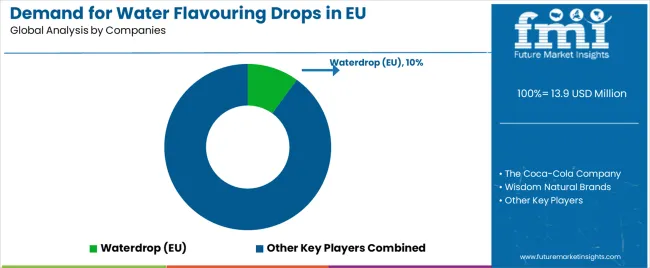
The EU water flavouring drops industry is characterized by competition between global beverage giants, specialized flavour companies, and innovative direct-to-consumer brands addressing demand for convenient, healthy hydration solutions. Companies are increasingly investing in natural sweetening technologies, flavour innovation, and sustainable packaging to secure competitive advantage. Strategic partnerships with retailers, e-commerce platforms, and fitness influencers remain central to industry expansion, while emphasis on functional benefits, organic certification, and taste optimization underpins brand differentiation across Europe.
Waterdrop leads the EU industry with an estimated 10% share, leveraging its direct-to-consumer model, sustainable packaging innovation, and strong brand presence across European industries. The company's microdrink cubes, subscription services, and influencer industrying have disrupted traditional distribution models, particularly appealing to millennials and Gen Z consumers prioritizing sustainability and convenience.
The Coca-Cola Company follows with around 9.0% share, utilizing its vast distribution network, brand portfolio, and industrying capabilities to promote water enhancer brands across European industries. The company benefits from retail relationships, consumer trust, and ability to rapidly scale successful innovations across multiple channels and countries.
Wisdom Natural Brands, with approximately 7.0% share, excels in stevia-based formulations through its SweetLeaf brand, capitalizing on growing demand for natural, zero-calorie sweetening solutions. Its expertise in stevia processing and flavour optimization provides competitive advantages in the dominant stevia-sweetened segment.
Capella Flavours holds about 5.0% share, specializing in B2B flavour solutions for private label and co-manufacturing partners. Its extensive flavour library and customization capabilities enable rapid product development for retailers and emerging brands.
The remainder of the industry is fragmented, with regional processors, private labels, and emerging startups collectively holding over 60% share. These players differentiate through local flavour preferences, niche positioning, innovative packaging, and targeted functional benefits, reflecting a dynamic competitive environment with opportunities for disruption and consolidation.
| Item | Value |
|---|---|
| Industry Value | USD 13.9 billion |
| Quantitative Units | USD billion |
| Nature | Organic, Conventional |
| Product Type | Stevia-sweetened, Artificially sweetened, Naturally sweetened (non-stevia), Sugar-sweetened, Unsweetened |
| Application | Fruit-based, Functional (vitamins/minerals/herbs), Tea/Coffee |
| Distribution Channel | Superindustries/Hyperindustries, Online, Convenience Stores, Specialty/Drug Stores |
| Countries Covered | Germany, France, Italy, Spain, Netherlands, Rest of Europe |
| Key Companies Profiled | Waterdrop, Coca-Cola, Wisdom Natural Brands, Capella Flavours, plus regional and emerging players |
Nature
The global demand for water flavouring drops in eu is estimated to be valued at USD 13.9 billion in 2025.
The market size for the demand for water flavouring drops in eu is projected to reach USD 15.5 billion by 2035.
The demand for water flavouring drops in eu is expected to grow at a 1.1% CAGR between 2025 and 2035.
The key product types in demand for water flavouring drops in eu are organic and conventional.
In terms of product type, stevia-sweetened segment to command 72.0% share in the demand for water flavouring drops in eu in 2025.


Our Research Products

The "Full Research Suite" delivers actionable market intel, deep dives on markets or technologies, so clients act faster, cut risk, and unlock growth.

The Leaderboard benchmarks and ranks top vendors, classifying them as Established Leaders, Leading Challengers, or Disruptors & Challengers.

Locates where complements amplify value and substitutes erode it, forecasting net impact by horizon

We deliver granular, decision-grade intel: market sizing, 5-year forecasts, pricing, adoption, usage, revenue, and operational KPIs—plus competitor tracking, regulation, and value chains—across 60 countries broadly.

Spot the shifts before they hit your P&L. We track inflection points, adoption curves, pricing moves, and ecosystem plays to show where demand is heading, why it is changing, and what to do next across high-growth markets and disruptive tech

Real-time reads of user behavior. We track shifting priorities, perceptions of today’s and next-gen services, and provider experience, then pace how fast tech moves from trial to adoption, blending buyer, consumer, and channel inputs with social signals (#WhySwitch, #UX).

Partner with our analyst team to build a custom report designed around your business priorities. From analysing market trends to assessing competitors or crafting bespoke datasets, we tailor insights to your needs.
Supplier Intelligence
Discovery & Profiling
Capacity & Footprint
Performance & Risk
Compliance & Governance
Commercial Readiness
Who Supplies Whom
Scorecards & Shortlists
Playbooks & Docs
Category Intelligence
Definition & Scope
Demand & Use Cases
Cost Drivers
Market Structure
Supply Chain Map
Trade & Policy
Operating Norms
Deliverables
Buyer Intelligence
Account Basics
Spend & Scope
Procurement Model
Vendor Requirements
Terms & Policies
Entry Strategy
Pain Points & Triggers
Outputs
Pricing Analysis
Benchmarks
Trends
Should-Cost
Indexation
Landed Cost
Commercial Terms
Deliverables
Brand Analysis
Positioning & Value Prop
Share & Presence
Customer Evidence
Go-to-Market
Digital & Reputation
Compliance & Trust
KPIs & Gaps
Outputs
Full Research Suite comprises of:
Market outlook & trends analysis
Interviews & case studies
Strategic recommendations
Vendor profiles & capabilities analysis
5-year forecasts
8 regions and 60+ country-level data splits
Market segment data splits
12 months of continuous data updates
DELIVERED AS:
PDF EXCEL ONLINE
Water Flavouring Drops Market Size, Share, and Forecast 2025 to 2035
Europe Water Pumps Market – Trends & Forecast 2025 to 2035
Reusable Water Bottle Market Forecast and Outlook 2025 to 2035
Waterproof Makeup Market Size and Share Forecast Outlook 2025 to 2035
Demand for Cold Water Soluble Starch in EU Size and Share Forecast Outlook 2025 to 2035
Water Vapor Permeability Analyzers Market Size and Share Forecast Outlook 2025 to 2035
Europe Radiotherapy Patient Positioning Market Size and Share Forecast Outlook 2025 to 2035
Water and Waste Water Treatment Chemical Market Size and Share Forecast Outlook 2025 to 2035
Water-cooled Walk-in Temperature & Humidity Chamber Market Size and Share Forecast Outlook 2025 to 2035
Waterless Bathing Solution Market Size and Share Forecast Outlook 2025 to 2035
Water Treatment System Market Size and Share Forecast Outlook 2025 to 2035
Waterborne UV Curable Resin Market Size and Share Forecast Outlook 2025 to 2035
Water Treatment Chemical Market Size and Share Forecast Outlook 2025 to 2035
Europe Polyvinyl Alcohol Industry Analysis Size and Share Forecast Outlook 2025 to 2035
Water Adventure Tourism Market Forecast and Outlook 2025 to 2035
Water Packaging Market Forecast and Outlook 2025 to 2035
Water Soluble Bag Market Size and Share Forecast Outlook 2025 to 2035
Europe Cruise Market Forecast and Outlook 2025 to 2035
Europium Market Forecast and Outlook 2025 to 2035
Water Leak Sensors Market Size and Share Forecast Outlook 2025 to 2035

Thank you!
You will receive an email from our Business Development Manager. Please be sure to check your SPAM/JUNK folder too.
Chat With
MaRIA