Digital Identity Services Market Size and Share Forecast Outlook 2025 to 2035

The Digital Identity Services Market is expected to record a valuation of USD 28,504.4 million in 2025 and USD 86,541.2 million in 2035, with an increase of USD 58,036.8 million, which equals a growth of 203% over the decade. The overall expansion represents a CAGR of 11.7% and a 3X increase in market size.
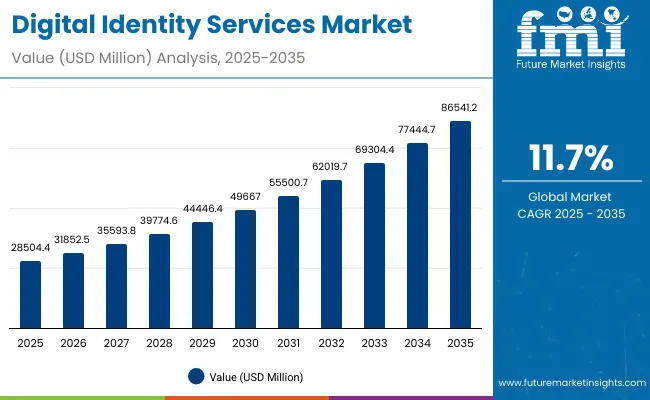
Quick Stats for Digital Identity Services Market

  • Digital Identity Services Market Value (2025): USD 28,504.4 million
  • Digital Identity Services Market Forecast Value (2035): USD 86,541.2 million
  • Digital Identity Services Market Forecast CAGR: 11.7%
  • Leading Segment in Digital Identity Services Market in 2025: Identity verification & KYC/AML (35.7%)
  • Key Growth Regions in the Digital Identity Services Market: USA, China, India, Germany, Japan
  • Top Key Players in Digital Identity Services Market: LexisNexis Risk Solutions, Experian, Trulioo, Jumio, Onfido, Mitek Systems, IDEMIA, Thales, iProov, GBG

Digital Identity Services Market

Digital Identity Services Market Key Takeaways

Metric Value
Market Estimated Value in (2025E) USD 28,504.4 million
Market Forecast Value in (2035F) USD 86,541.2 million
Forecast CAGR (2025 to 2035) 11.7%

During the first five-year period from 2025 to 2030, the market increases from USD 28,504.4 million to USD 49,667.0 million, adding USD 21,162.6 million, which accounts for 36% of the total decade growth. This phase records steady adoption in BFSI onboarding, e-commerce fraud prevention, and government citizen ID programs, driven by the need for regulatory compliance and fraud reduction. Identity verification & KYC/AML dominates this period as it caters to over 35% of critical applications requiring high-accuracy compliance checks.

The second half from 2030 to 2035 contributes USD 36,874.2 million, equal to 64% of total growth, as the market jumps from USD 49,667.0 million to USD 86,541.2 million. This acceleration is powered by widespread deployment of biometric authentication, AI-based fraud scoring, and digital identity wallets in healthcare and travel ecosystems. Cloud and hybrid deployments together capture a larger share above 70% by the end of the decade. API-first SaaS and orchestration platforms add recurring revenue, increasing the service-based share beyond 65% in total value.

From 2020 to 2024, the Global Digital Identity Services Market grew from under USD 20,000 million to over USD 26,000 million, driven by compliance-driven adoption in BFSI and government services. During this period, the competitive landscape was dominated by verification providers controlling nearly 70% of revenue, with leaders such as LexisNexis, Experian, and Trulioo focusing on KYC/AML solutions for financial institutions. Competitive differentiation relied on accuracy, fraud database coverage, and regulatory alignment, while orchestration and wallet services were still in early adoption. Service-based recurring models contributed less than 20% of the total market value.

Demand for digital identity services will expand to USD 28,504.4 million in 2025, and the revenue mix will shift as SaaS and orchestration services grow to over 65% share. Traditional verification leaders face rising competition from API-native players offering biometric onboarding, risk scoring, and cross-border digital wallet solutions. Major incumbents are pivoting to hybrid models, integrating AI-driven fraud detection and multi-factor workflows to retain relevance. Emerging entrants specializing in FIDO/WebAuthn, behavioral biometrics, and cloud-first orchestration platforms are gaining share. The competitive advantage is moving away from KYC point solutions alone to ecosystem strength, scalability, and recurring subscription revenue.

Why the Digital Identity Services Market is growing?

Advances in biometric authentication have improved accuracy and speed, allowing for more secure identity verification across diverse applications. API-first SaaS platforms have gained popularity due to their scalability and real-time compliance integrations. The rise of cloud deployment has contributed to flexibility and cost efficiency, enabling enterprises to embed identity services seamlessly into customer journeys. Industries such as BFSI, e-commerce, and telecom are driving demand for fraud prevention and access management solutions that can integrate across digital channels.

Expansion of automated fraud detection and cross-border compliance requirements has fueled market growth. Innovations in biometric modalities, behavioral analytics, and wallet issuance are expected to open new application areas. Segment growth is expected to be led by identity verification & KYC/AML services, API-first SaaS delivery models, and cloud deployments due to their precision, adaptability, and scalability.

Segmental Analysis

The market is segmented by service type, authentication method, delivery model, deployment, customer industry, and region. Service types include identity verification & KYC/AML, authentication & access, fraud detection & risk scoring, identity orchestration & workflow, and credential issuance & wallet. Authentication methods include biometrics (face/fingerprint/voice), OTP & push approval, FIDO/WebAuthn, and device binding & behavioral signals.

Delivery models include API-first SaaS and managed services. Deployment models include cloud, hybrid, and on-prem managed. Customer industries include BFSI, e-commerce & marketplaces, government & public services, telecom, healthcare, travel & mobility, and others. Regionally, the scope spans North America, Europe, Asia-Pacific, Latin America, and the Middle East & Africa, with country-level coverage including the USA, Canada, Germany, France, United Kingdom, China, Japan, and India.
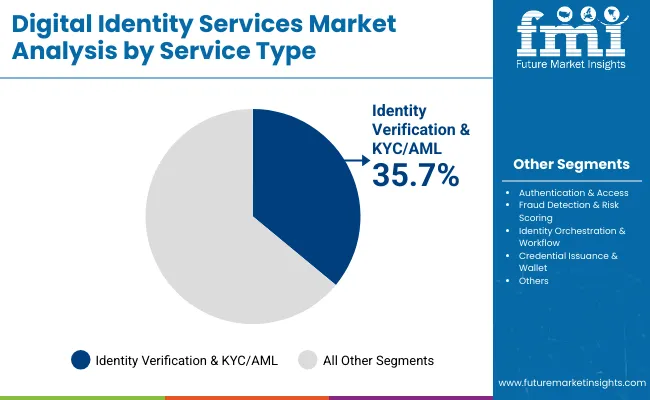
Insights into the Service Type Segment with Identity Verification & KYC/AML Leading in Market Share

Digital Identity Services Market By Service

Service Type Segment Market Value Share, 2025
Identity Verification & KYC/AML 35.7%
Others 64.3%

The identity verification & KYC/AML segment is projected to contribute 35.7% of the Global Digital Identity Services Market revenue in 2025, maintaining its lead as the dominant service category. This is driven by increasing regulatory mandates across BFSI, government services, and e-commerce sectors, where compliance with AML and fraud prevention remains critical. Organizations continue to prioritize KYC processes to mitigate risk, meet evolving compliance requirements, and secure digital onboarding.

The segment’s growth is also supported by widespread integration of biometric verification and document authentication technologies that improve accuracy and reduce fraud. As digital ecosystems expand globally, providers are enhancing verification platforms with AI-driven fraud detection and workflow orchestration. The identity verification & KYC/AML segment is expected to retain its position as the backbone of digital identity services through 2035.
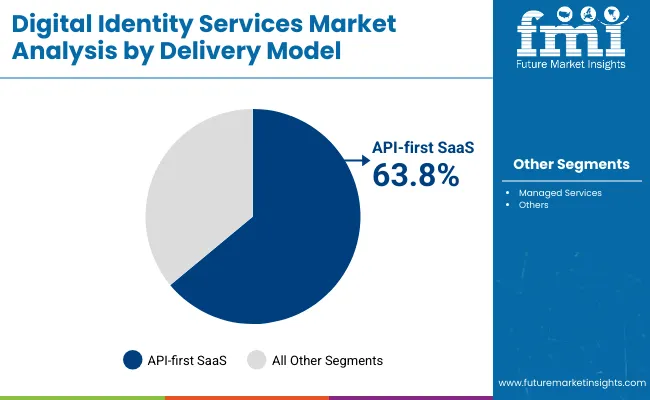
Insights into the Delivery Model Segment with API-first SaaS Leading in Market Share

Digital Identity Services Market By Delivery

Delivery Model Segment Market Value Share, 2025
API-first SaaS 63.8%
Others 36.2%

The API-first SaaS segment is projected to contribute 63.8% of the Global Digital Identity Services Market revenue in 2025, making it the clear leader in delivery models. This dominance is fueled by enterprises seeking scalable, flexible, and real-time identity solutions that can be embedded into customer-facing applications. API-first platforms allow for seamless integration into existing workflows, supporting industries such as BFSI, telecom, and e-commerce with rapid deployment and reduced operational overheads. The segment’s growth is also reinforced by the rise of subscription-based revenue models, where recurring services provide cost efficiency and predictable scalability for users. As demand for orchestration and fraud detection intensifies, SaaS providers are enhancing interoperability with third-party systems and cross-border compliance networks. The API-first SaaS segment is expected to remain the engine of recurring revenues across the digital identity services landscape.
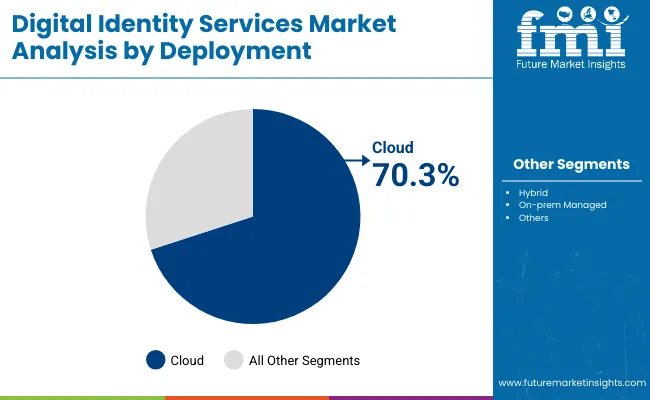
Insights into the Deployment Segment with Cloud Leading in Market Share

Digital Identity Services Market By Deployment

Deployment Segment Market Value Share, 2025
Cloud 70.3%
Segment 29.7%

The cloud deployment segment is projected to contribute 70.3% of the Global Digital Identity Services Market revenue in 2025, positioning it as the dominant deployment model. Organizations are increasingly migrating identity services to the cloud to achieve cost efficiency, agility, and faster time-to-market for compliance solutions. Cloud-native infrastructure enables real-time identity verification, multi-factor authentication, and fraud detection at scale, which is critical for industries with high transaction volumes. The segment’s growth is also being propelled by digital transformation strategies across enterprises, governments, and healthcare systems that prioritize secure cloud identity management. Providers are embedding advanced features such as AI analytics, orchestration, and continuous monitoring into their cloud platforms to enhance security and reduce risk. The cloud segment is expected to remain the backbone of digital identity deployments, accounting for the majority of growth through 2035.

What are the Drivers, Restraints, and Key Trends of the Global Digital Identity Services Market?

Drivers

Regulatory Compliance and KYC/AML Mandates

One of the most powerful drivers shaping the Global Digital Identity Services Market is the rise in regulatory compliance requirements across industries. Financial services, e-commerce platforms, government agencies, and telecom providers are under mounting pressure to meet stringent Know Your Customer (KYC) and Anti-Money Laundering (AML) rules. In 2025, the identity verification & KYC/AML segment alone represents 35.7% of total market value, illustrating how compliance-focused demand is central to growth. Governments are enforcing stricter onboarding processes to combat fraud, money laundering, and identity theft, which are escalating in both developed and emerging markets. The USA and Europe have well-established frameworks such as the Bank Secrecy Act (BSA), GDPR, and eIDAS, while Asia-Pacific markets including India and China are scaling national digital ID programs like Aadhaar and e-CNY integration.

The increasing globalization of financial services also compels multinational enterprises to adopt standardized digital identity solutions that can function across jurisdictions. This is driving cross-border verification and interoperability needs, accelerating innovation in API-first KYC systems. Furthermore, enterprises are seeking to automate compliance processes, replacing manual checks with biometric verification, AI-driven fraud scoring, and continuous identity monitoring. As regulatory scrutiny continues to intensify, businesses are prioritizing identity services not just as a compliance requirement but as a strategic asset that builds customer trust, reduces operational costs, and secures long-term growth. This compliance-driven momentum ensures identity verification & KYC/AML will remain the cornerstone of digital identity services throughout the decade.

Cloud and API-first Adoption Across Industries

The adoption of cloud-based and API-first delivery models has emerged as a key driver of scalability and cost efficiency in the Global Digital Identity Services Market. In 2025, API-first SaaS accounts for 63.8% of revenues, while cloud deployment captures 70.3%, underscoring how enterprises are gravitating toward flexible, subscription-driven identity solutions. Unlike traditional on-premise systems, cloud and SaaS-based identity platforms offer real-time updates, elastic scaling, and seamless integration with third-party ecosystems. This is particularly critical in industries like BFSI, healthcare, and e-commerce, where high transaction volumes require instant authentication and fraud detection without compromising user experience.

The growing shift toward digital-first customer journeys amplifies the need for API-driven identity services that can be embedded directly into mobile apps, websites, and government portals. Enterprises prefer plug-and-play models that reduce time-to-market while maintaining security and compliance. API-first SaaS platforms also provide advanced orchestration, enabling organizations to dynamically combine verification, authentication, and fraud scoring into unified workflows. This not only simplifies compliance management but also improves customer onboarding speed.

Restraints

Data Privacy Concerns and Compliance Risks

While regulatory pressure drives adoption, it simultaneously acts as a restraint by raising compliance complexity and operational risks. Digital identity service providers manage highly sensitive personal information, including biometric data, government IDs, and behavioral patterns. Any breach of this data can lead to severe financial penalties and reputational damage. The enforcement of GDPR in Europe, CCPA in California, and new data protection laws in countries such as India and Brazil introduce challenges for providers operating globally. Enterprises must adapt solutions to meet local data sovereignty laws, often requiring in-country data storage and customized compliance frameworks.

This complexity hinders the scalability of standardized identity platforms, increasing costs and operational overhead. Cross-border services, in particular, face difficulties when trying to reconcile conflicting regulatory requirements across jurisdictions. For example, a global e-commerce player may need to deploy different compliance protocols in the USA, EU, and Asia, complicating deployment and driving up costs.

High Implementation and Integration Costs

Another significant restraint for the Global Digital Identity Services Market is the cost associated with deploying advanced identity verification systems. While API-first SaaS models reduce upfront capital expenditure, enterprises adopting cutting-edge authentication solutions such as biometrics, behavioral analytics, and AI-driven fraud scoring still face high integration expenses. Small and mid-sized enterprises, particularly in emerging markets, struggle with the affordability of enterprise-grade identity solutions.

Implementation requires not only licensing fees but also investments in system integration, staff training, and ongoing maintenance. For industries with legacy IT systems, migrating to cloud or hybrid identity frameworks is often complex, requiring customized APIs and data security protocols. This increases both time-to-market and total cost of ownership. Additionally, integrating identity services into diverse industry-specific workflows such as healthcare patient records or telecom SIM registration systems demands industry-specific customization, adding further costs.

While large enterprises in BFSI and government sectors are able to absorb these expenses, smaller organizations may delay adoption or limit deployment to basic KYC checks. This uneven affordability across industries and geographies slows down mass adoption and creates barriers for service providers to penetrate certain market segments. Cost-related hurdles thus remain a restraining force on the pace of adoption, despite the clear long-term benefits of digital identity solutions.

Key Trends

Biometric-led Authentication Becoming Mainstream

Biometric authentication is rapidly transitioning from a niche capability to a mainstream feature across digital identity ecosystems. Leveraging modalities such as facial recognition, fingerprint scanning, and voice recognition, biometrics deliver superior accuracy and stronger protection against fraud compared to traditional passwords or OTP-based verification. As of 2025, biometrics are among the leading authentication methods, integrated across BFSI, healthcare, and government identity programs.

Consumers increasingly prefer passwordless authentication for convenience, while enterprises adopt it to minimize fraud and enhance user experience. The shift is driven by advancements in machine learning and AI, which significantly improve biometric accuracy even under challenging conditions such as low lighting or partial face visibility. Furthermore, the rise of mobile-first ecosystems has made biometric authentication a natural extension of smartphones, enabling instant verification without additional hardware costs. Regulatory endorsement is also encouraging adoption, with governments integrating biometrics into e-passports, digital healthcare IDs, and border security systems.

Rise of Digital Wallets and Decentralized Identity

Another key trend transforming the Global Digital Identity Services Market is the emergence of credential issuance and digital identity wallets. These solutions give individuals greater control over their personal data, enabling them to store and present verified credentials securely across platforms. With decentralized identity models gaining traction, individuals can manage their digital identities without relying solely on centralized databases, reducing single points of failure and enhancing privacy. By 2025, digital wallets are already being explored in government, mobility, and healthcare sectors. For instance, digital driver’s licenses, vaccination certificates, and cross-border travel credentials are increasingly issued through wallet-based frameworks. In the financial sector, wallets enable seamless cross-platform KYC reusability, lowering onboarding friction and improving customer experience. The trend is also closely tied to Web3 and blockchain adoption, as decentralized identity frameworks align with the principles of self-sovereign identity.

Enterprises are actively integrating wallets with mobile devices, biometric verification, and blockchain-based credential registries to ensure interoperability and trust. The ability to enable cross-border compliance while giving individuals ownership of their data is gaining significant momentum. Over the forecast period, digital wallets and decentralized identity models will likely shift the balance of power toward consumer-centric ecosystems, redefining the competitive landscape of identity services.
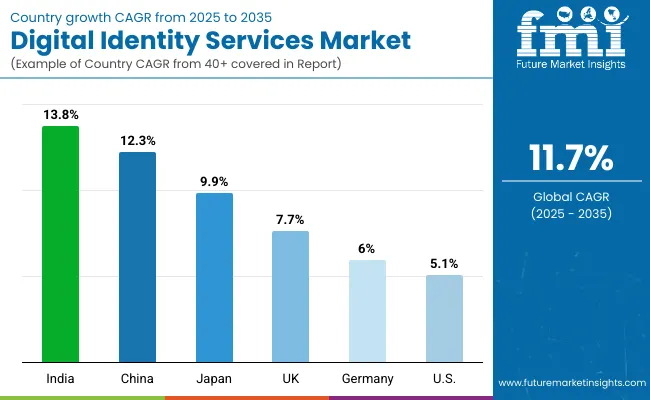
Analysis of Global Digital Identity Services Market By Key Countries

Digital Identity Services Market By Country

Countries Estimated CAGR (2025 to 2035)
China 12.3%
USA 5.1%
India 13.8%
UK 7.7%
Germany 6.0%
Japan 9.9%

The Global Digital Identity Services Market shows pronounced regional disparities in adoption speed, strongly influenced by regulatory compliance mandates, financial inclusion initiatives, and the digital transformation of public services. Asia-Pacific emerges as the fastest-growing region, anchored by India at 13.8% CAGR and China at 12.3% CAGR. This acceleration is driven by national identity programs, digital payment ecosystems, and aggressive government investment in fraud prevention and citizen ID systems. India’s Aadhaar-linked identity framework and growing fintech sector are propelling large-scale KYC adoption.

China’s digital yuan ecosystem, e-commerce expansion, and state-backed smart city programs further accelerate cloud-based identity verification deployments. Europe maintains a strong growth profile, led by Germany at 6.0% CAGR, France near 6.5%, and the UK at 7.7% CAGR, supported by stringent GDPR compliance, eIDAS regulations, and digital onboarding mandates for banks. High levels of e-commerce and robust fintech innovation keep Europe ahead of North America in biometric adoption and digital wallet pilots. North America shows moderate expansion, with the USA at 5.1% CAGR, reflecting market maturity and slower regulatory change compared to Asia and Europe. Growth in the USA is more service-driven, with enterprises prioritizing fraud scoring, orchestration, and SaaS adoption over traditional verification alone. Latin America, represented by Brazil with an estimated CAGR of ~7%, is showing rising adoption of mobile-based KYC in banking and government welfare systems.
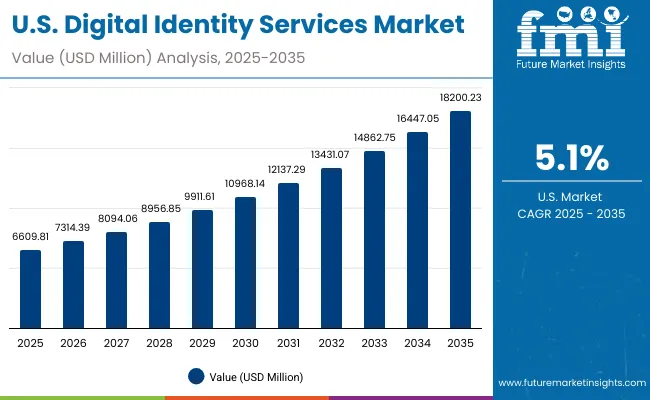
Sales Outlook for Digital Identity Services in the United States

Digital Identity Services Market Usa

Year USA Digital Identity Services Market
2025 6609.8
2026 7314.4
2027 8094.1
2028 8956.9
2029 9911.6
2030 10968.1
2031 12137.3
2032 13431.1
2033 14862.8
2034 16447.1
2035 18200.2

The Global Digital Identity Services Market in the United States is projected to grow at a CAGR of 5.1%, reflecting steady but moderate expansion compared to faster-growing regions such as Asia-Pacific. Growth is being fueled by increased investments in compliance automation across BFSI, healthcare, and government services, where identity verification and fraud detection are mission-critical. Financial institutions remain at the forefront, with fraud detection and risk scoring applications recording strong year-on-year adoption. This is particularly evident in credit issuance, cross-border payments, and high-value transaction monitoring, where regulators are tightening oversight.

The e-commerce and digital payments sectors are also driving demand for stronger identity verification frameworks. Marketplaces are integrating advanced KYC checks to secure cross-border sellers, protect against chargeback fraud, and maintain compliance with AML directives. At the same time, USA healthcare providers are embedding biometric authentication into patient portals and electronic health records, ensuring secure digital access and reducing risks of identity theft in medical insurance systems. The telecom sector is adopting identity orchestration platforms to meet SIM registration requirements and prevent fraud in mobile transactions.

Although the USA market is mature, providers are increasingly focusing on SaaS and orchestration services rather than just verification tools. Growth is more service-driven than hardware-led, with a strong emphasis on risk analytics, workflow orchestration, and AI-driven fraud scoring.

  • Fraud scoring and risk analytics in BFSI remain the primary growth driver.
  • Healthcare providers are embedding biometric authentication into digital patient access.
  • E-commerce platforms are expanding KYC integration for cross-border sellers.

Growth and Expansion Outlook for Global Digital Identity Services Market in the United Kingdom

The Global Digital Identity Services Market in the United Kingdom is expected to grow at a CAGR of 7.7%, supported by widespread adoption across banking, government citizen services, and telecom identity verification. The UK government’s Digital Identity and Attributes Trust Framework is a central driver, establishing standardized rules for digital identity providers and accelerating nationwide adoption. Banks and fintech players are scaling biometric onboarding processes to comply with Financial Conduct Authority (FCA) mandates on anti-money laundering, fraud prevention, and consumer protection. Healthcare is another critical growth sector, with NHS systems investing in secure digital access for patients and providers. Identity solutions are being used to ensure compliance with data privacy standards and protect sensitive medical records from breaches. In addition, telecom companies in the UK are integrating real-time verification platforms to mitigate risks associated with SIM card fraud and mobile payment authentication.

The UK market is characterized by strong public-private collaboration. Innovation grants and digital adoption programs are fueling ecosystem growth, while startups and fintechs are testing decentralized identity and wallet solutions for retail, travel, and online services. This combination of regulatory support, government-backed frameworks, and private innovation is ensuring the UK maintains a leadership role in Europe’s digital identity adoption.

  • Banks and fintechs are leading adoption of biometric onboarding and KYC checks.
  • Government programs are driving public-sector identity verification frameworks.
  • Healthcare systems are integrating secure identity services for electronic records access.

Growth and Expansion Outlook for Global Digital Identity Services Market in India

India is witnessing the fastest growth globally in the Digital Identity Services Market, with a forecast CAGR of 13.8% through 2035. This rapid expansion is anchored by the country’s Aadhaar-based identity infrastructure, which provides biometric and demographic verification for over a billion citizens. Aadhaar-enabled eKYC is widely used across banking, insurance, and telecom services, enabling instant verification and driving large-scale adoption of identity solutions.

Fintech firms and neo-banks are among the most aggressive adopters, leveraging API-first KYC systems to scale digital onboarding for millions of new users each year. India’s thriving e-commerce and digital payments ecosystem further accelerates adoption, with platforms integrating fraud detection and behavioral risk scoring to secure transactions. Mobility and ride-hailing platforms are also embedding identity verification for driver and passenger safety.

Beyond the private sector, the Indian government’s Digital India initiative and state-level e-governance programs are pushing adoption into healthcare, education, and welfare distribution. Identity solutions are being deployed in tier-2 and tier-3 cities, extending beyond metro areas, as cost-effective SaaS models make adoption feasible for MSMEs and local institutions.
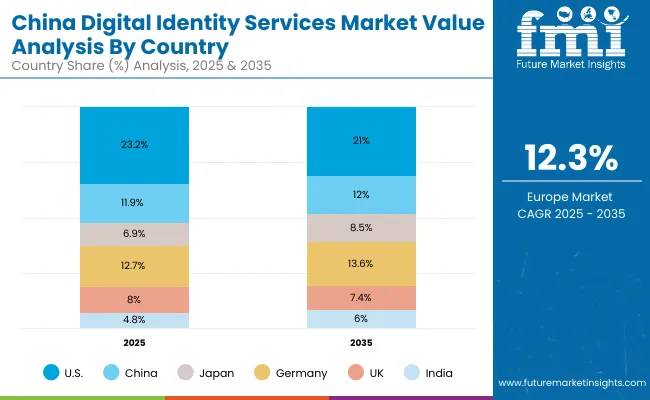
  • Aadhaar-based eKYC is central to nationwide identity verification.
  • Fintechs and neo-banks are fueling demand for API-first KYC systems.
  • Public programs in healthcare and welfare distribution are expanding citizen ID usage.

Sales Outlook for Digital Identity Services in China

Digital Identity Services Market China

The Global Digital Identity Services Market in China is expected to grow at a CAGR of 12.3%, among the highest globally. Growth is powered by the country’s rapid transition to digital finance, underpinned by the e-CNY (digital yuan) ecosystem and large-scale government-backed initiatives. Financial services and e-commerce platforms are aggressively deploying KYC systems to manage fraud risk, while cloud adoption dominates the landscape with 72.8% share in 2025, reflecting state-driven investments in digital infrastructure. China’s smart city rollouts are another critical driver, with municipal governments deploying large-scale digital ID and biometric authentication frameworks for citizen services, mobility, and infrastructure planning. Healthcare digitization is also fueling adoption, with hospitals and insurance providers integrating AI-driven verification to improve patient data security and service efficiency.

Local technology providers are innovating rapidly, offering cost-effective, biometric-led identity solutions that compete strongly against international vendors. Domestic firms are combining AI-driven face recognition, behavioral analytics, and mobile-first platforms to deliver solutions at scale across banking, mobility, and retail. This competitive momentum, coupled with regulatory backing, is positioning China as a global leader in identity services innovation.
  • State-backed smart city initiatives are scaling cloud-based identity verification.
  • Digital yuan adoption is fueling compliance-driven KYC integration.
  • Domestic vendors are enabling cost-effective biometric and fraud scoring solutions.

Opportunity Analysis of USA Digital Identity Services Market

Digital Identity Services Market Usa 2

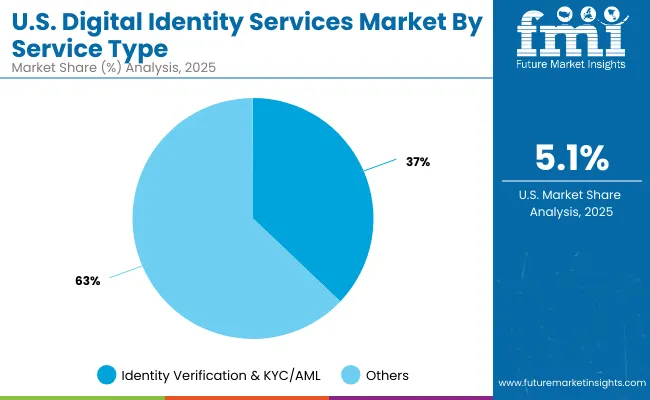
Service Type Segment Market Value Share, 2025
Identity verification & KYC/AML 37.1%
Others 62.9%

The Digital Identity Services Market in the United States is valued at USD 6,609.8 million in 2025, with identity verification & KYC/AML leading at 37.1% (USD 2,452.2 million). This dominance is directly tied to the USA regulatory and compliance environment, where financial institutions and fintech platforms are mandated to adopt robust AML and fraud prevention frameworks. BFSI and e-commerce platforms are the largest adopters, embedding verification services into customer onboarding, payments, and cross-border transactions. Fraud detection and risk scoring are also experiencing rapid growth in the USA, particularly with rising cybercrime incidents and stricter regulatory scrutiny from agencies such as the SEC and CFPB. Healthcare providers are integrating biometric-driven authentication into digital patient portals, reflecting demand for identity protection in electronic health records. Telecom operators are adopting orchestration workflows to secure SIM registration processes and combat mobile fraud.

The reliance on API-first SaaS solutions allows USA enterprises to integrate identity verification seamlessly into existing platforms, while cloud adoption ensures scalability for high transaction volumes. Over time, the USA market will see a gradual shift from pure verification to multi-layered orchestration, positioning fraud analytics and biometric authentication as growth accelerators.
  • Market size for USA in 2025 is USD 6,609.8 million
  • Global market share is approximately 23.2% in 2025
  • Identity verification & KYC/AML leads at 37.1%, driven by compliance-focused demand

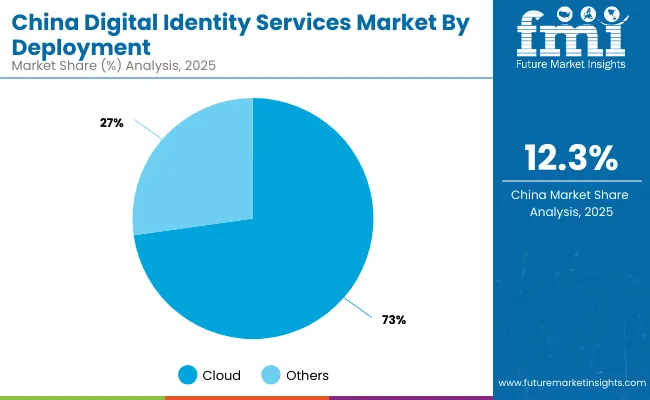
Opportunity Analysis of China Digital Identity Services Market

Digital Identity Services Market China 2

Deployment Segment Market Value Share, 2025
Cloud 72.8%
Segment 27.2%

The Digital Identity Services Market in China is valued at approximately USD 3,378.4 million in 2025, with cloud deployment leading at 72.8% (USD 2,459.4 million). The overwhelming dominance of cloud solutions reflects government-backed investment in digital infrastructure, national data frameworks, and rapid scaling of fintech and e-commerce ecosystems. China’s digital yuan (e-CNY) ecosystem has accelerated demand for robust, scalable, cloud-hosted KYC and AML systems, ensuring compliance in digital finance. Smart city initiatives and healthcare digitization are also significant drivers, as local governments and hospitals integrate biometric authentication for secure citizen services and patient records. E-commerce platforms are embedding risk scoring and fraud prevention at checkout to secure one of the world’s largest online retail markets. Cloud adoption offers Chinese enterprises flexibility, speed, and cost efficiency to support these massive transaction volumes.

Domestic technology providers are playing a critical role by offering cost-effective, AI-driven biometric and fraud scoring tools that compete effectively against international players. This is boosting adoption across both enterprise and consumer-facing applications, from banking to mobility. Over the forecast period, the synergy between state-backed frameworks and private sector innovation will solidify China as one of the most dynamic growth hubs for digital identity services.

  • Market size for China in 2025 is USD 3,378.4 million
  • Global market share is approximately 11.9% in 2025
  • Cloud deployment leads at 72.8%, driven by government-backed infrastructure and digital finance adoption

Key Developments in Global Digital Identity Services Market

  • On December 10, 2024, LexisNexis Risk Solutions announced the acquisition of IDVerse, an AI-powered document authentication and deepfake detection firm. The deal strengthens its global onboarding and fraud prevention portfolio.
  • On January 31, 2025, LexisNexis Risk Solutions was ranked #1 in Juniper Research’s Digital Identity Verification Competitor Leaderboard, recognized as an “Established Leader” for its advanced AI and behavioral biometrics capabilities.

Scope of the Report

Item Value
Quantitative Units USD 28,504.4 million
Service Type Identity verification & KYC/AML, Authentication & access, Fraud detection & risk scoring, Identity orchestration & workflow, Credential issuance & wallet
Authentication Method Biometrics (face/fingerprint/voice), OTP & push approval, FIDO/ WebAuthn, Device binding & behavioral signals
Delivery Model API-first SaaS, Managed services
Deployment Cloud, Hybrid, On- prem managed
Customer Industry BFSI, E-commerce & marketplaces, Government & public services, Telecom, Healthcare, Travel & mobility
Regions Covered North America, Europe, Asia-Pacific, Latin America, Middle East & Africa
Country Covered United States, Canada, Germany, France, United Kingdom, China, Japan, India, Brazil, South Africa
Key Companies Profiled LexisNexis Risk Solutions, Experian, Trulioo, Jumio, Onfido, Mitek Systems, IDEMIA, Thales, iProov, GBG
Additional Attributes Dollar sales by service type and customer industry, adoption trends in cloud and API-first SaaS delivery, rising demand for biometric authentication and digital wallets, sector-specific growth in BFSI, e-commerce, and government services, revenue segmentation by deployment model, integration with AI/ML, AR/VR, and digital twin technologies, regional trends shaped by compliance mandates and digital transformation initiatives, and innovations in behavioral biometrics, orchestration, and decentralized identity frameworks.

Key Segments

By Service Type:

  • Identity verification & KYC/AML
  • Authentication & access
  • Fraud detection & risk scoring
  • Identity orchestration & workflow
  • Credential issuance & wallet

By Authentication Method:

  • Biometrics (face/fingerprint/voice)
  • OTP & push approval
  • FIDO/WebAuthn
  • Device binding & behavioral signals

By Delivery Mode:

  • API-first SaaS
  • Managed services

By Deployment:

  • Cloud
  • Hybrid
  • On-prem managed

By Customer Industry:

  • BFSI
  • E-commerce & marketplaces
  • Government & public services
  • Telecom
  • Healthcare
  • Travel & mobility

By Region:

  • North America
  • Latin America
  • Europe
  • East Asia
  • South Asia & Pacific
  • Middle East and Africa

Table of Content

  1. Executive Summary
    • Global Market Outlook
    • Demand-side Trends
    • Supply-side Trends
    • Technology Roadmap Analysis
    • Analysis and Recommendations
  2. Market Overview
    • Market Coverage / Taxonomy
    • Market Definition / Scope / Limitations
  3. Market Background
    • Market Dynamics
      • Drivers
      • Restraints
      • Opportunity
      • Trends
    • Scenario Forecast
      • Demand in Optimistic Scenario
      • Demand in Likely Scenario
      • Demand in Conservative Scenario
    • Opportunity Map Analysis
    • Product Life Cycle Analysis
    • Supply Chain Analysis
      • Supply Side Participants and their Roles
        • Producers
        • Mid-Level Participants (Traders/ Agents/ Brokers)
        • Wholesalers and Distributors
      • Value Added and Value Created at Node in the Supply Chain
      • List of Raw Material Suppliers
      • List of Existing and Potential Buyer’s
    • Investment Feasibility Matrix
    • Value Chain Analysis
      • Profit Margin Analysis
      • Wholesalers and Distributors
      • Retailers
    • PESTLE and Porter’s Analysis
    • Regulatory Landscape
      • By Key Regions
      • By Key Countries
    • Regional Parent Market Outlook
    • Production and Consumption Statistics
    • Import and Export Statistics
  4. Global Market Analysis 2020 to 2024 and Forecast, 2025 to 2035
    • Historical Market Size Value (USD Million) & Volume (Units) Analysis, 2020 to 2024
    • Current and Future Market Size Value (USD Million) & Volume (Units) Projections, 2025 to 2035
      • Y-o-Y Growth Trend Analysis
      • Absolute $ Opportunity Analysis
  5. Global Market Analysis 2020 to 2024 and Forecast 2025 to 2035, By Service Type
    • Introduction / Key Findings
    • Historical Market Size Value (USD Million) & Volume (Units) Analysis By Service Type, 2020 to 2024
    • Current and Future Market Size Value (USD Million) & Volume (Units) Analysis and Forecast By Service Type, 2025 to 2035
      • Identity verification & KYC/AML
      • Authentication & access
      • Fraud detection & risk scoring
      • Identity orchestration & workflow
      • Credential issuance & wallet
    • Y-o-Y Growth Trend Analysis By Service Type, 2020 to 2024
    • Absolute $ Opportunity Analysis By Service Type, 2025 to 2035
  6. Global Market Analysis 2020 to 2024 and Forecast 2025 to 2035, By Authentication Method
    • Introduction / Key Findings
    • Historical Market Size Value (USD Million) & Volume (Units) Analysis By Authentication Method, 2020 to 2024
    • Current and Future Market Size Value (USD Million) & Volume (Units) Analysis and Forecast By Authentication Method, 2025 to 2035
      • Biometrics (face/fingerprint/voice)
      • OTP & push approval
      • FIDO/WebAuthn
      • Device binding & behavioral signals
    • Y-o-Y Growth Trend Analysis By Authentication Method, 2020 to 2024
    • Absolute $ Opportunity Analysis By Authentication Method, 2025 to 2035
  7. Global Market Analysis 2020 to 2024 and Forecast 2025 to 2035, By Delivery Mode
    • Introduction / Key Findings
    • Historical Market Size Value (USD Million) & Volume (Units) Analysis By Delivery Mode, 2020 to 2024
    • Current and Future Market Size Value (USD Million) & Volume (Units) Analysis and Forecast By Delivery Mode, 2025 to 2035
      • API-first SaaS
      • Managed services
    • Y-o-Y Growth Trend Analysis By Delivery Mode, 2020 to 2024
    • Absolute $ Opportunity Analysis By Delivery Mode, 2025 to 2035
  8. Global Market Analysis 2020 to 2024 and Forecast 2025 to 2035, By Deployment
    • Introduction / Key Findings
    • Historical Market Size Value (USD Million) & Volume (Units) Analysis By Deployment, 2020 to 2024
    • Current and Future Market Size Value (USD Million) & Volume (Units) Analysis and Forecast By Deployment, 2025 to 2035
      • Cloud
      • Hybrid
      • On-prem managed
    • Y-o-Y Growth Trend Analysis By Deployment, 2020 to 2024
    • Absolute $ Opportunity Analysis By Deployment, 2025 to 2035
  9. Global Market Analysis 2020 to 2024 and Forecast 2025 to 2035, By Customer Industry
    • Introduction / Key Findings
    • Historical Market Size Value (USD Million) & Volume (Units) Analysis By Customer Industry, 2020 to 2024
    • Current and Future Market Size Value (USD Million) & Volume (Units) Analysis and Forecast By Customer Industry, 2025 to 2035
      • BFSI
      • E-commerce & marketplaces
      • Government & public services
      • Telecom
      • Healthcare
      • Travel & mobility
    • Y-o-Y Growth Trend Analysis By Customer Industry, 2020 to 2024
    • Absolute $ Opportunity Analysis By Customer Industry, 2025 to 2035
  10. Global Market Analysis 2020 to 2024 and Forecast 2025 to 2035, By Region
    • Introduction
    • Historical Market Size Value (USD Million) & Volume (Units) Analysis By Region, 2020 to 2024
    • Current Market Size Value (USD Million) & Volume (Units) Analysis and Forecast By Region, 2025 to 2035
      • North America
      • Latin America
      • Europe
      • East Asia
      • South Asia & Pacific
      • Middle East and Africa
    • Market Attractiveness Analysis By Region
  11. North America Market Analysis 2020 to 2024 and Forecast 2025 to 2035, By Country
    • Historical Market Size Value (USD Million) & Volume (Units) Trend Analysis By Market Taxonomy, 2020 to 2024
    • Market Size Value (USD Million) & Volume (Units) Forecast By Market Taxonomy, 2025 to 2035
      • By Country
        • USA
        • Canada
      • By Service Type
      • By Authentication Method
      • By Delivery Mode
      • By Deployment
      • By Customer Industry
    • Market Attractiveness Analysis
      • By Country
      • By Service Type
      • By Authentication Method
      • By Delivery Mode
      • By Deployment
      • By Customer Industry
    • Key Takeaways
  12. Latin America Market Analysis 2020 to 2024 and Forecast 2025 to 2035, By Country
    • Historical Market Size Value (USD Million) & Volume (Units) Trend Analysis By Market Taxonomy, 2020 to 2024
    • Market Size Value (USD Million) & Volume (Units) Forecast By Market Taxonomy, 2025 to 2035
      • By Country
        • Brazil
        • Mexico
        • Colombia
        • Rest of Latin America
      • By Service Type
      • By Authentication Method
      • By Delivery Mode
      • By Deployment
      • By Customer Industry
    • Market Attractiveness Analysis
      • By Country
      • By Service Type
      • By Authentication Method
      • By Delivery Mode
      • By Deployment
      • By Customer Industry
    • Key Takeaways
  13. Europe Market Analysis 2020 to 2024 and Forecast 2025 to 2035, By Country
    • Historical Market Size Value (USD Million) & Volume (Units) Trend Analysis By Market Taxonomy, 2020 to 2024
    • Market Size Value (USD Million) & Volume (Units) Forecast By Market Taxonomy, 2025 to 2035
      • By Country
        • Germany
        • UK
        • France
        • Italy
        • Spain
        • Belgium
        • Netherlands
        • Nordic
        • Switzerland
        • Russia
        • Poland
        • Rest of Europe
      • By Service Type
      • By Authentication Method
      • By Delivery Mode
      • By Deployment
      • By Customer Industry
    • Market Attractiveness Analysis
      • By Country
      • By Service Type
      • By Authentication Method
      • By Delivery Mode
      • By Deployment
      • By Customer Industry
    • Key Takeaways
  14. East Asia Market Analysis 2020 to 2024 and Forecast 2025 to 2035, By Country
    • Historical Market Size Value (USD Million) & Volume (Units) Trend Analysis By Market Taxonomy, 2020 to 2024
    • Market Size Value (USD Million) & Volume (Units) Forecast By Market Taxonomy, 2025 to 2035
      • By Country
        • China
        • Japan
        • South Korea
      • By Service Type
      • By Authentication Method
      • By Delivery Mode
      • By Deployment
      • By Customer Industry
    • Market Attractiveness Analysis
      • By Country
      • By Service Type
      • By Authentication Method
      • By Delivery Mode
      • By Deployment
      • By Customer Industry
    • Key Takeaways
  15. South Asia & Pacific Market Analysis 2020 to 2024 and Forecast 2025 to 2035, By Country
    • Historical Market Size Value (USD Million) & Volume (Units) Trend Analysis By Market Taxonomy, 2020 to 2024
    • Market Size Value (USD Million) & Volume (Units) Forecast By Market Taxonomy, 2025 to 2035
      • By Country
        • India
        • Thailand
        • Malaysia
        • Indonesia
        • Singapore
        • Vietnam
        • Australia
        • New Zealand
        • Rest of South Asia
      • By Service Type
      • By Authentication Method
      • By Delivery Mode
      • By Deployment
      • By Customer Industry
    • Market Attractiveness Analysis
      • By Country
      • By Service Type
      • By Authentication Method
      • By Delivery Mode
      • By Deployment
      • By Customer Industry
    • Key Takeaways
  16. Middle East and Africa Market Analysis 2020 to 2024 and Forecast 2025 to 2035, By Country
    • Historical Market Size Value (USD Million) & Volume (Units) Trend Analysis By Market Taxonomy, 2020 to 2024
    • Market Size Value (USD Million) & Volume (Units) Forecast By Market Taxonomy, 2025 to 2035
      • By Country
        • Turkey
        • UAE
        • Saudi Arabia
        • Israel
        • Other GCC Countries
        • North Africa
        • South Africa
      • By Service Type
      • By Authentication Method
      • By Delivery Mode
      • By Deployment
      • By Customer Industry
    • Market Attractiveness Analysis
      • By Country
      • By Service Type
      • By Authentication Method
      • By Delivery Mode
      • By Deployment
      • By Customer Industry
    • Key Takeaways
  17. Key Countries Market Analysis
    • USA
      • Pricing Analysis
      • Market Share Analysis, 2024
        • By Service Type
        • By Authentication Method
        • By Delivery Mode
        • By Deployment
        • By Customer Industry
    • Canada
      • Pricing Analysis
      • Market Share Analysis, 2024
        • By Service Type
        • By Authentication Method
        • By Delivery Mode
        • By Deployment
        • By Customer Industry
    • Brazil
      • Pricing Analysis
      • Market Share Analysis, 2024
        • By Service Type
        • By Authentication Method
        • By Delivery Mode
        • By Deployment
        • By Customer Industry
    • Mexico
      • Pricing Analysis
      • Market Share Analysis, 2024
        • By Service Type
        • By Authentication Method
        • By Delivery Mode
        • By Deployment
        • By Customer Industry
    • Colombia
      • Pricing Analysis
      • Market Share Analysis, 2024
        • By Service Type
        • By Authentication Method
        • By Delivery Mode
        • By Deployment
        • By Customer Industry
    • Germany
      • Pricing Analysis
      • Market Share Analysis, 2024
        • By Service Type
        • By Authentication Method
        • By Delivery Mode
        • By Deployment
        • By Customer Industry
    • UK
      • Pricing Analysis
      • Market Share Analysis, 2024
        • By Service Type
        • By Authentication Method
        • By Delivery Mode
        • By Deployment
        • By Customer Industry
    • France
      • Pricing Analysis
      • Market Share Analysis, 2024
        • By Service Type
        • By Authentication Method
        • By Delivery Mode
        • By Deployment
        • By Customer Industry
    • Italy
      • Pricing Analysis
      • Market Share Analysis, 2024
        • By Service Type
        • By Authentication Method
        • By Delivery Mode
        • By Deployment
        • By Customer Industry
    • Spain
      • Pricing Analysis
      • Market Share Analysis, 2024
        • By Service Type
        • By Authentication Method
        • By Delivery Mode
        • By Deployment
        • By Customer Industry
    • Belgium
      • Pricing Analysis
      • Market Share Analysis, 2024
        • By Service Type
        • By Authentication Method
        • By Delivery Mode
        • By Deployment
        • By Customer Industry
    • Netherlands
      • Pricing Analysis
      • Market Share Analysis, 2024
        • By Service Type
        • By Authentication Method
        • By Delivery Mode
        • By Deployment
        • By Customer Industry
    • Nordic
      • Pricing Analysis
      • Market Share Analysis, 2024
        • By Service Type
        • By Authentication Method
        • By Delivery Mode
        • By Deployment
        • By Customer Industry
    • Switzerland
      • Pricing Analysis
      • Market Share Analysis, 2024
        • By Service Type
        • By Authentication Method
        • By Delivery Mode
        • By Deployment
        • By Customer Industry
    • Russia
      • Pricing Analysis
      • Market Share Analysis, 2024
        • By Service Type
        • By Authentication Method
        • By Delivery Mode
        • By Deployment
        • By Customer Industry
    • Poland
      • Pricing Analysis
      • Market Share Analysis, 2024
        • By Service Type
        • By Authentication Method
        • By Delivery Mode
        • By Deployment
        • By Customer Industry
    • China
      • Pricing Analysis
      • Market Share Analysis, 2024
        • By Service Type
        • By Authentication Method
        • By Delivery Mode
        • By Deployment
        • By Customer Industry
    • Japan
      • Pricing Analysis
      • Market Share Analysis, 2024
        • By Service Type
        • By Authentication Method
        • By Delivery Mode
        • By Deployment
        • By Customer Industry
    • South Korea
      • Pricing Analysis
      • Market Share Analysis, 2024
        • By Service Type
        • By Authentication Method
        • By Delivery Mode
        • By Deployment
        • By Customer Industry
    • India
      • Pricing Analysis
      • Market Share Analysis, 2024
        • By Service Type
        • By Authentication Method
        • By Delivery Mode
        • By Deployment
        • By Customer Industry
    • Thailand
      • Pricing Analysis
      • Market Share Analysis, 2024
        • By Service Type
        • By Authentication Method
        • By Delivery Mode
        • By Deployment
        • By Customer Industry
    • Indonesia
      • Pricing Analysis
      • Market Share Analysis, 2024
        • By Service Type
        • By Authentication Method
        • By Delivery Mode
        • By Deployment
        • By Customer Industry
    • Australia
      • Pricing Analysis
      • Market Share Analysis, 2024
        • By Service Type
        • By Authentication Method
        • By Delivery Mode
        • By Deployment
        • By Customer Industry
    • New Zealand
      • Pricing Analysis
      • Market Share Analysis, 2024
        • By Service Type
        • By Authentication Method
        • By Delivery Mode
        • By Deployment
        • By Customer Industry
    • Turkey
      • Pricing Analysis
      • Market Share Analysis, 2024
        • By Service Type
        • By Authentication Method
        • By Delivery Mode
        • By Deployment
        • By Customer Industry
    • UAE
      • Pricing Analysis
      • Market Share Analysis, 2024
        • By Service Type
        • By Authentication Method
        • By Delivery Mode
        • By Deployment
        • By Customer Industry
    • Saudi Arabia
      • Pricing Analysis
      • Market Share Analysis, 2024
        • By Service Type
        • By Authentication Method
        • By Delivery Mode
        • By Deployment
        • By Customer Industry
    • Israel
      • Pricing Analysis
      • Market Share Analysis, 2024
        • By Service Type
        • By Authentication Method
        • By Delivery Mode
        • By Deployment
        • By Customer Industry
    • North Africa
      • Pricing Analysis
      • Market Share Analysis, 2024
        • By Service Type
        • By Authentication Method
        • By Delivery Mode
        • By Deployment
        • By Customer Industry
    • South Africa
      • Pricing Analysis
      • Market Share Analysis, 2024
        • By Service Type
        • By Authentication Method
        • By Delivery Mode
        • By Deployment
        • By Customer Industry
  18. Market Structure Analysis
    • Competition Dashboard
    • Competition Benchmarking
    • Market Share Analysis of Top Players
      • By Regional
      • By Service Type
      • By Authentication Method
      • By Delivery Mode
      • By Deployment
      • By Customer Industry
  19. Competition Analysis
    • Competition Deep Dive
      • LexisNexis Risk Solutions
        • Overview
        • Product Portfolio
        • Profitability by Market Segments (Product/Age /Sales Channel/Region)
        • Sales Footprint
        • Strategy Overview
          • Marketing Strategy
          • Product Strategy
          • Channel Strategy
      • Experian
        • Overview
        • Product Portfolio
        • Profitability by Market Segments (Product/Age /Sales Channel/Region)
        • Sales Footprint
        • Strategy Overview
          • Marketing Strategy
          • Product Strategy
          • Channel Strategy
      • Trulioo
        • Overview
        • Product Portfolio
        • Profitability by Market Segments (Product/Age /Sales Channel/Region)
        • Sales Footprint
        • Strategy Overview
          • Marketing Strategy
          • Product Strategy
          • Channel Strategy
      • Jumio
        • Overview
        • Product Portfolio
        • Profitability by Market Segments (Product/Age /Sales Channel/Region)
        • Sales Footprint
        • Strategy Overview
          • Marketing Strategy
          • Product Strategy
          • Channel Strategy
      • Onfido
        • Overview
        • Product Portfolio
        • Profitability by Market Segments (Product/Age /Sales Channel/Region)
        • Sales Footprint
        • Strategy Overview
          • Marketing Strategy
          • Product Strategy
          • Channel Strategy
      • Mitek Systems
        • Overview
        • Product Portfolio
        • Profitability by Market Segments (Product/Age /Sales Channel/Region)
        • Sales Footprint
        • Strategy Overview
          • Marketing Strategy
          • Product Strategy
          • Channel Strategy
      • IDEMIA
        • Overview
        • Product Portfolio
        • Profitability by Market Segments (Product/Age /Sales Channel/Region)
        • Sales Footprint
        • Strategy Overview
          • Marketing Strategy
          • Product Strategy
          • Channel Strategy
      • Thales
        • Overview
        • Product Portfolio
        • Profitability by Market Segments (Product/Age /Sales Channel/Region)
        • Sales Footprint
        • Strategy Overview
          • Marketing Strategy
          • Product Strategy
          • Channel Strategy
      • iProov
        • Overview
        • Product Portfolio
        • Profitability by Market Segments (Product/Age /Sales Channel/Region)
        • Sales Footprint
        • Strategy Overview
          • Marketing Strategy
          • Product Strategy
          • Channel Strategy
      • GBG
        • Overview
        • Product Portfolio
        • Profitability by Market Segments (Product/Age /Sales Channel/Region)
        • Sales Footprint
        • Strategy Overview
          • Marketing Strategy
          • Product Strategy
          • Channel Strategy
  20. Assumptions & Acronyms Used
  21. Research Methodology

List of Tables

  • Table 1: Global Market Value (USD Million) Forecast by Region, 2020-2035
  • Table 2: Global Market Volume (Units) Forecast by Region, 2020-2035
  • Table 3: Global Market Value (USD Million) Forecast by Service Type, 2020-2035
  • Table 4: Global Market Volume (Units) Forecast by Service Type, 2020-2035
  • Table 5: Global Market Value (USD Million) Forecast by Authentication Method, 2020-2035
  • Table 6: Global Market Volume (Units) Forecast by Authentication Method, 2020-2035
  • Table 7: Global Market Value (USD Million) Forecast by Delivery Mode, 2020-2035
  • Table 8: Global Market Volume (Units) Forecast by Delivery Mode, 2020-2035
  • Table 9: Global Market Value (USD Million) Forecast by Deployment, 2020-2035
  • Table 10: Global Market Volume (Units) Forecast by Deployment, 2020-2035
  • Table 11: Global Market Value (USD Million) Forecast by Customer Industry, 2020-2035
  • Table 12: Global Market Volume (Units) Forecast by Customer Industry, 2020-2035
  • Table 13: North America Market Value (USD Million) Forecast by Country, 2020-2035
  • Table 14: North America Market Volume (Units) Forecast by Country, 2020-2035
  • Table 15: North America Market Value (USD Million) Forecast by Service Type, 2020-2035
  • Table 16: North America Market Volume (Units) Forecast by Service Type, 2020-2035
  • Table 17: North America Market Value (USD Million) Forecast by Authentication Method, 2020-2035
  • Table 18: North America Market Volume (Units) Forecast by Authentication Method, 2020-2035
  • Table 19: North America Market Value (USD Million) Forecast by Delivery Mode, 2020-2035
  • Table 20: North America Market Volume (Units) Forecast by Delivery Mode, 2020-2035
  • Table 21: North America Market Value (USD Million) Forecast by Deployment, 2020-2035
  • Table 22: North America Market Volume (Units) Forecast by Deployment, 2020-2035
  • Table 23: North America Market Value (USD Million) Forecast by Customer Industry, 2020-2035
  • Table 24: North America Market Volume (Units) Forecast by Customer Industry, 2020-2035
  • Table 25: Latin America Market Value (USD Million) Forecast by Country, 2020-2035
  • Table 26: Latin America Market Volume (Units) Forecast by Country, 2020-2035
  • Table 27: Latin America Market Value (USD Million) Forecast by Service Type, 2020-2035
  • Table 28: Latin America Market Volume (Units) Forecast by Service Type, 2020-2035
  • Table 29: Latin America Market Value (USD Million) Forecast by Authentication Method, 2020-2035
  • Table 30: Latin America Market Volume (Units) Forecast by Authentication Method, 2020-2035
  • Table 31: Latin America Market Value (USD Million) Forecast by Delivery Mode, 2020-2035
  • Table 32: Latin America Market Volume (Units) Forecast by Delivery Mode, 2020-2035
  • Table 33: Latin America Market Value (USD Million) Forecast by Deployment, 2020-2035
  • Table 34: Latin America Market Volume (Units) Forecast by Deployment, 2020-2035
  • Table 35: Latin America Market Value (USD Million) Forecast by Customer Industry, 2020-2035
  • Table 36: Latin America Market Volume (Units) Forecast by Customer Industry, 2020-2035
  • Table 37: Europe Market Value (USD Million) Forecast by Country, 2020-2035
  • Table 38: Europe Market Volume (Units) Forecast by Country, 2020-2035
  • Table 39: Europe Market Value (USD Million) Forecast by Service Type, 2020-2035
  • Table 40: Europe Market Volume (Units) Forecast by Service Type, 2020-2035
  • Table 41: Europe Market Value (USD Million) Forecast by Authentication Method, 2020-2035
  • Table 42: Europe Market Volume (Units) Forecast by Authentication Method, 2020-2035
  • Table 43: Europe Market Value (USD Million) Forecast by Delivery Mode, 2020-2035
  • Table 44: Europe Market Volume (Units) Forecast by Delivery Mode, 2020-2035
  • Table 45: Europe Market Value (USD Million) Forecast by Deployment, 2020-2035
  • Table 46: Europe Market Volume (Units) Forecast by Deployment, 2020-2035
  • Table 47: Europe Market Value (USD Million) Forecast by Customer Industry, 2020-2035
  • Table 48: Europe Market Volume (Units) Forecast by Customer Industry, 2020-2035
  • Table 49: East Asia Market Value (USD Million) Forecast by Country, 2020-2035
  • Table 50: East Asia Market Volume (Units) Forecast by Country, 2020-2035
  • Table 51: East Asia Market Value (USD Million) Forecast by Service Type, 2020-2035
  • Table 52: East Asia Market Volume (Units) Forecast by Service Type, 2020-2035
  • Table 53: East Asia Market Value (USD Million) Forecast by Authentication Method, 2020-2035
  • Table 54: East Asia Market Volume (Units) Forecast by Authentication Method, 2020-2035
  • Table 55: East Asia Market Value (USD Million) Forecast by Delivery Mode, 2020-2035
  • Table 56: East Asia Market Volume (Units) Forecast by Delivery Mode, 2020-2035
  • Table 57: East Asia Market Value (USD Million) Forecast by Deployment, 2020-2035
  • Table 58: East Asia Market Volume (Units) Forecast by Deployment, 2020-2035
  • Table 59: East Asia Market Value (USD Million) Forecast by Customer Industry, 2020-2035
  • Table 60: East Asia Market Volume (Units) Forecast by Customer Industry, 2020-2035
  • Table 61: South Asia & Pacific Market Value (USD Million) Forecast by Country, 2020-2035
  • Table 62: South Asia & Pacific Market Volume (Units) Forecast by Country, 2020-2035
  • Table 63: South Asia & Pacific Market Value (USD Million) Forecast by Service Type, 2020-2035
  • Table 64: South Asia & Pacific Market Volume (Units) Forecast by Service Type, 2020-2035
  • Table 65: South Asia & Pacific Market Value (USD Million) Forecast by Authentication Method, 2020-2035
  • Table 66: South Asia & Pacific Market Volume (Units) Forecast by Authentication Method, 2020-2035
  • Table 67: South Asia & Pacific Market Value (USD Million) Forecast by Delivery Mode, 2020-2035
  • Table 68: South Asia & Pacific Market Volume (Units) Forecast by Delivery Mode, 2020-2035
  • Table 69: South Asia & Pacific Market Value (USD Million) Forecast by Deployment, 2020-2035
  • Table 70: South Asia & Pacific Market Volume (Units) Forecast by Deployment, 2020-2035
  • Table 71: South Asia & Pacific Market Value (USD Million) Forecast by Customer Industry, 2020-2035
  • Table 72: South Asia & Pacific Market Volume (Units) Forecast by Customer Industry, 2020-2035
  • Table 73: Middle East and Africa Market Value (USD Million) Forecast by Country, 2020-2035
  • Table 74: Middle East and Africa Market Volume (Units) Forecast by Country, 2020-2035
  • Table 75: Middle East and Africa Market Value (USD Million) Forecast by Service Type, 2020-2035
  • Table 76: Middle East and Africa Market Volume (Units) Forecast by Service Type, 2020-2035
  • Table 77: Middle East and Africa Market Value (USD Million) Forecast by Authentication Method, 2020-2035
  • Table 78: Middle East and Africa Market Volume (Units) Forecast by Authentication Method, 2020-2035
  • Table 79: Middle East and Africa Market Value (USD Million) Forecast by Delivery Mode, 2020-2035
  • Table 80: Middle East and Africa Market Volume (Units) Forecast by Delivery Mode, 2020-2035
  • Table 81: Middle East and Africa Market Value (USD Million) Forecast by Deployment, 2020-2035
  • Table 82: Middle East and Africa Market Volume (Units) Forecast by Deployment, 2020-2035
  • Table 83: Middle East and Africa Market Value (USD Million) Forecast by Customer Industry, 2020-2035
  • Table 84: Middle East and Africa Market Volume (Units) Forecast by Customer Industry, 2020-2035

List of Figures

  • Figure 1: Global Market Value (USD Million) by Service Type, 2025-2035
  • Figure 2: Global Market Value (USD Million) by Authentication Method, 2025-2035
  • Figure 3: Global Market Value (USD Million) by Delivery Mode, 2025-2035
  • Figure 4: Global Market Value (USD Million) by Deployment, 2025-2035
  • Figure 5: Global Market Value (USD Million) by Customer Industry, 2025-2035
  • Figure 6: Global Market Value (USD Million) by Region, 2025-2035
  • Figure 7: Global Market Value (USD Million) Analysis by Region, 2020-2035
  • Figure 8: Global Market Volume (Units) Analysis by Region, 2020-2035
  • Figure 9: Global Market Value Share (%) and BPS Analysis by Region, 2025-2035
  • Figure 10: Global Market Y-o-Y Growth (%) Projections by Region, 2025-2035
  • Figure 11: Global Market Value (USD Million) Analysis by Service Type, 2020-2035
  • Figure 12: Global Market Volume (Units) Analysis by Service Type, 2020-2035
  • Figure 13: Global Market Value Share (%) and BPS Analysis by Service Type, 2025-2035
  • Figure 14: Global Market Y-o-Y Growth (%) Projections by Service Type, 2025-2035
  • Figure 15: Global Market Value (USD Million) Analysis by Authentication Method, 2020-2035
  • Figure 16: Global Market Volume (Units) Analysis by Authentication Method, 2020-2035
  • Figure 17: Global Market Value Share (%) and BPS Analysis by Authentication Method, 2025-2035
  • Figure 18: Global Market Y-o-Y Growth (%) Projections by Authentication Method, 2025-2035
  • Figure 19: Global Market Value (USD Million) Analysis by Delivery Mode, 2020-2035
  • Figure 20: Global Market Volume (Units) Analysis by Delivery Mode, 2020-2035
  • Figure 21: Global Market Value Share (%) and BPS Analysis by Delivery Mode, 2025-2035
  • Figure 22: Global Market Y-o-Y Growth (%) Projections by Delivery Mode, 2025-2035
  • Figure 23: Global Market Value (USD Million) Analysis by Deployment, 2020-2035
  • Figure 24: Global Market Volume (Units) Analysis by Deployment, 2020-2035
  • Figure 25: Global Market Value Share (%) and BPS Analysis by Deployment, 2025-2035
  • Figure 26: Global Market Y-o-Y Growth (%) Projections by Deployment, 2025-2035
  • Figure 27: Global Market Value (USD Million) Analysis by Customer Industry, 2020-2035
  • Figure 28: Global Market Volume (Units) Analysis by Customer Industry, 2020-2035
  • Figure 29: Global Market Value Share (%) and BPS Analysis by Customer Industry, 2025-2035
  • Figure 30: Global Market Y-o-Y Growth (%) Projections by Customer Industry, 2025-2035
  • Figure 31: Global Market Attractiveness by Service Type, 2025-2035
  • Figure 32: Global Market Attractiveness by Authentication Method, 2025-2035
  • Figure 33: Global Market Attractiveness by Delivery Mode, 2025-2035
  • Figure 34: Global Market Attractiveness by Deployment, 2025-2035
  • Figure 35: Global Market Attractiveness by Customer Industry, 2025-2035
  • Figure 36: Global Market Attractiveness by Region, 2025-2035
  • Figure 37: North America Market Value (USD Million) by Service Type, 2025-2035
  • Figure 38: North America Market Value (USD Million) by Authentication Method, 2025-2035
  • Figure 39: North America Market Value (USD Million) by Delivery Mode, 2025-2035
  • Figure 40: North America Market Value (USD Million) by Deployment, 2025-2035
  • Figure 41: North America Market Value (USD Million) by Customer Industry, 2025-2035
  • Figure 42: North America Market Value (USD Million) by Country, 2025-2035
  • Figure 43: North America Market Value (USD Million) Analysis by Country, 2020-2035
  • Figure 44: North America Market Volume (Units) Analysis by Country, 2020-2035
  • Figure 45: North America Market Value Share (%) and BPS Analysis by Country, 2025-2035
  • Figure 46: North America Market Y-o-Y Growth (%) Projections by Country, 2025-2035
  • Figure 47: North America Market Value (USD Million) Analysis by Service Type, 2020-2035
  • Figure 48: North America Market Volume (Units) Analysis by Service Type, 2020-2035
  • Figure 49: North America Market Value Share (%) and BPS Analysis by Service Type, 2025-2035
  • Figure 50: North America Market Y-o-Y Growth (%) Projections by Service Type, 2025-2035
  • Figure 51: North America Market Value (USD Million) Analysis by Authentication Method, 2020-2035
  • Figure 52: North America Market Volume (Units) Analysis by Authentication Method, 2020-2035
  • Figure 53: North America Market Value Share (%) and BPS Analysis by Authentication Method, 2025-2035
  • Figure 54: North America Market Y-o-Y Growth (%) Projections by Authentication Method, 2025-2035
  • Figure 55: North America Market Value (USD Million) Analysis by Delivery Mode, 2020-2035
  • Figure 56: North America Market Volume (Units) Analysis by Delivery Mode, 2020-2035
  • Figure 57: North America Market Value Share (%) and BPS Analysis by Delivery Mode, 2025-2035
  • Figure 58: North America Market Y-o-Y Growth (%) Projections by Delivery Mode, 2025-2035
  • Figure 59: North America Market Value (USD Million) Analysis by Deployment, 2020-2035
  • Figure 60: North America Market Volume (Units) Analysis by Deployment, 2020-2035
  • Figure 61: North America Market Value Share (%) and BPS Analysis by Deployment, 2025-2035
  • Figure 62: North America Market Y-o-Y Growth (%) Projections by Deployment, 2025-2035
  • Figure 63: North America Market Value (USD Million) Analysis by Customer Industry, 2020-2035
  • Figure 64: North America Market Volume (Units) Analysis by Customer Industry, 2020-2035
  • Figure 65: North America Market Value Share (%) and BPS Analysis by Customer Industry, 2025-2035
  • Figure 66: North America Market Y-o-Y Growth (%) Projections by Customer Industry, 2025-2035
  • Figure 67: North America Market Attractiveness by Service Type, 2025-2035
  • Figure 68: North America Market Attractiveness by Authentication Method, 2025-2035
  • Figure 69: North America Market Attractiveness by Delivery Mode, 2025-2035
  • Figure 70: North America Market Attractiveness by Deployment, 2025-2035
  • Figure 71: North America Market Attractiveness by Customer Industry, 2025-2035
  • Figure 72: North America Market Attractiveness by Country, 2025-2035
  • Figure 73: Latin America Market Value (USD Million) by Service Type, 2025-2035
  • Figure 74: Latin America Market Value (USD Million) by Authentication Method, 2025-2035
  • Figure 75: Latin America Market Value (USD Million) by Delivery Mode, 2025-2035
  • Figure 76: Latin America Market Value (USD Million) by Deployment, 2025-2035
  • Figure 77: Latin America Market Value (USD Million) by Customer Industry, 2025-2035
  • Figure 78: Latin America Market Value (USD Million) by Country, 2025-2035
  • Figure 79: Latin America Market Value (USD Million) Analysis by Country, 2020-2035
  • Figure 80: Latin America Market Volume (Units) Analysis by Country, 2020-2035
  • Figure 81: Latin America Market Value Share (%) and BPS Analysis by Country, 2025-2035
  • Figure 82: Latin America Market Y-o-Y Growth (%) Projections by Country, 2025-2035
  • Figure 83: Latin America Market Value (USD Million) Analysis by Service Type, 2020-2035
  • Figure 84: Latin America Market Volume (Units) Analysis by Service Type, 2020-2035
  • Figure 85: Latin America Market Value Share (%) and BPS Analysis by Service Type, 2025-2035
  • Figure 86: Latin America Market Y-o-Y Growth (%) Projections by Service Type, 2025-2035
  • Figure 87: Latin America Market Value (USD Million) Analysis by Authentication Method, 2020-2035
  • Figure 88: Latin America Market Volume (Units) Analysis by Authentication Method, 2020-2035
  • Figure 89: Latin America Market Value Share (%) and BPS Analysis by Authentication Method, 2025-2035
  • Figure 90: Latin America Market Y-o-Y Growth (%) Projections by Authentication Method, 2025-2035
  • Figure 91: Latin America Market Value (USD Million) Analysis by Delivery Mode, 2020-2035
  • Figure 92: Latin America Market Volume (Units) Analysis by Delivery Mode, 2020-2035
  • Figure 93: Latin America Market Value Share (%) and BPS Analysis by Delivery Mode, 2025-2035
  • Figure 94: Latin America Market Y-o-Y Growth (%) Projections by Delivery Mode, 2025-2035
  • Figure 95: Latin America Market Value (USD Million) Analysis by Deployment, 2020-2035
  • Figure 96: Latin America Market Volume (Units) Analysis by Deployment, 2020-2035
  • Figure 97: Latin America Market Value Share (%) and BPS Analysis by Deployment, 2025-2035
  • Figure 98: Latin America Market Y-o-Y Growth (%) Projections by Deployment, 2025-2035
  • Figure 99: Latin America Market Value (USD Million) Analysis by Customer Industry, 2020-2035
  • Figure 100: Latin America Market Volume (Units) Analysis by Customer Industry, 2020-2035
  • Figure 101: Latin America Market Value Share (%) and BPS Analysis by Customer Industry, 2025-2035
  • Figure 102: Latin America Market Y-o-Y Growth (%) Projections by Customer Industry, 2025-2035
  • Figure 103: Latin America Market Attractiveness by Service Type, 2025-2035
  • Figure 104: Latin America Market Attractiveness by Authentication Method, 2025-2035
  • Figure 105: Latin America Market Attractiveness by Delivery Mode, 2025-2035
  • Figure 106: Latin America Market Attractiveness by Deployment, 2025-2035
  • Figure 107: Latin America Market Attractiveness by Customer Industry, 2025-2035
  • Figure 108: Latin America Market Attractiveness by Country, 2025-2035
  • Figure 109: Europe Market Value (USD Million) by Service Type, 2025-2035
  • Figure 110: Europe Market Value (USD Million) by Authentication Method, 2025-2035
  • Figure 111: Europe Market Value (USD Million) by Delivery Mode, 2025-2035
  • Figure 112: Europe Market Value (USD Million) by Deployment, 2025-2035
  • Figure 113: Europe Market Value (USD Million) by Customer Industry, 2025-2035
  • Figure 114: Europe Market Value (USD Million) by Country, 2025-2035
  • Figure 115: Europe Market Value (USD Million) Analysis by Country, 2020-2035
  • Figure 116: Europe Market Volume (Units) Analysis by Country, 2020-2035
  • Figure 117: Europe Market Value Share (%) and BPS Analysis by Country, 2025-2035
  • Figure 118: Europe Market Y-o-Y Growth (%) Projections by Country, 2025-2035
  • Figure 119: Europe Market Value (USD Million) Analysis by Service Type, 2020-2035
  • Figure 120: Europe Market Volume (Units) Analysis by Service Type, 2020-2035
  • Figure 121: Europe Market Value Share (%) and BPS Analysis by Service Type, 2025-2035
  • Figure 122: Europe Market Y-o-Y Growth (%) Projections by Service Type, 2025-2035
  • Figure 123: Europe Market Value (USD Million) Analysis by Authentication Method, 2020-2035
  • Figure 124: Europe Market Volume (Units) Analysis by Authentication Method, 2020-2035
  • Figure 125: Europe Market Value Share (%) and BPS Analysis by Authentication Method, 2025-2035
  • Figure 126: Europe Market Y-o-Y Growth (%) Projections by Authentication Method, 2025-2035
  • Figure 127: Europe Market Value (USD Million) Analysis by Delivery Mode, 2020-2035
  • Figure 128: Europe Market Volume (Units) Analysis by Delivery Mode, 2020-2035
  • Figure 129: Europe Market Value Share (%) and BPS Analysis by Delivery Mode, 2025-2035
  • Figure 130: Europe Market Y-o-Y Growth (%) Projections by Delivery Mode, 2025-2035
  • Figure 131: Europe Market Value (USD Million) Analysis by Deployment, 2020-2035
  • Figure 132: Europe Market Volume (Units) Analysis by Deployment, 2020-2035
  • Figure 133: Europe Market Value Share (%) and BPS Analysis by Deployment, 2025-2035
  • Figure 134: Europe Market Y-o-Y Growth (%) Projections by Deployment, 2025-2035
  • Figure 135: Europe Market Value (USD Million) Analysis by Customer Industry, 2020-2035
  • Figure 136: Europe Market Volume (Units) Analysis by Customer Industry, 2020-2035
  • Figure 137: Europe Market Value Share (%) and BPS Analysis by Customer Industry, 2025-2035
  • Figure 138: Europe Market Y-o-Y Growth (%) Projections by Customer Industry, 2025-2035
  • Figure 139: Europe Market Attractiveness by Service Type, 2025-2035
  • Figure 140: Europe Market Attractiveness by Authentication Method, 2025-2035
  • Figure 141: Europe Market Attractiveness by Delivery Mode, 2025-2035
  • Figure 142: Europe Market Attractiveness by Deployment, 2025-2035
  • Figure 143: Europe Market Attractiveness by Customer Industry, 2025-2035
  • Figure 144: Europe Market Attractiveness by Country, 2025-2035
  • Figure 145: East Asia Market Value (USD Million) by Service Type, 2025-2035
  • Figure 146: East Asia Market Value (USD Million) by Authentication Method, 2025-2035
  • Figure 147: East Asia Market Value (USD Million) by Delivery Mode, 2025-2035
  • Figure 148: East Asia Market Value (USD Million) by Deployment, 2025-2035
  • Figure 149: East Asia Market Value (USD Million) by Customer Industry, 2025-2035
  • Figure 150: East Asia Market Value (USD Million) by Country, 2025-2035
  • Figure 151: East Asia Market Value (USD Million) Analysis by Country, 2020-2035
  • Figure 152: East Asia Market Volume (Units) Analysis by Country, 2020-2035
  • Figure 153: East Asia Market Value Share (%) and BPS Analysis by Country, 2025-2035
  • Figure 154: East Asia Market Y-o-Y Growth (%) Projections by Country, 2025-2035
  • Figure 155: East Asia Market Value (USD Million) Analysis by Service Type, 2020-2035
  • Figure 156: East Asia Market Volume (Units) Analysis by Service Type, 2020-2035
  • Figure 157: East Asia Market Value Share (%) and BPS Analysis by Service Type, 2025-2035
  • Figure 158: East Asia Market Y-o-Y Growth (%) Projections by Service Type, 2025-2035
  • Figure 159: East Asia Market Value (USD Million) Analysis by Authentication Method, 2020-2035
  • Figure 160: East Asia Market Volume (Units) Analysis by Authentication Method, 2020-2035
  • Figure 161: East Asia Market Value Share (%) and BPS Analysis by Authentication Method, 2025-2035
  • Figure 162: East Asia Market Y-o-Y Growth (%) Projections by Authentication Method, 2025-2035
  • Figure 163: East Asia Market Value (USD Million) Analysis by Delivery Mode, 2020-2035
  • Figure 164: East Asia Market Volume (Units) Analysis by Delivery Mode, 2020-2035
  • Figure 165: East Asia Market Value Share (%) and BPS Analysis by Delivery Mode, 2025-2035
  • Figure 166: East Asia Market Y-o-Y Growth (%) Projections by Delivery Mode, 2025-2035
  • Figure 167: East Asia Market Value (USD Million) Analysis by Deployment, 2020-2035
  • Figure 168: East Asia Market Volume (Units) Analysis by Deployment, 2020-2035
  • Figure 169: East Asia Market Value Share (%) and BPS Analysis by Deployment, 2025-2035
  • Figure 170: East Asia Market Y-o-Y Growth (%) Projections by Deployment, 2025-2035
  • Figure 171: East Asia Market Value (USD Million) Analysis by Customer Industry, 2020-2035
  • Figure 172: East Asia Market Volume (Units) Analysis by Customer Industry, 2020-2035
  • Figure 173: East Asia Market Value Share (%) and BPS Analysis by Customer Industry, 2025-2035
  • Figure 174: East Asia Market Y-o-Y Growth (%) Projections by Customer Industry, 2025-2035
  • Figure 175: East Asia Market Attractiveness by Service Type, 2025-2035
  • Figure 176: East Asia Market Attractiveness by Authentication Method, 2025-2035
  • Figure 177: East Asia Market Attractiveness by Delivery Mode, 2025-2035
  • Figure 178: East Asia Market Attractiveness by Deployment, 2025-2035
  • Figure 179: East Asia Market Attractiveness by Customer Industry, 2025-2035
  • Figure 180: East Asia Market Attractiveness by Country, 2025-2035
  • Figure 181: South Asia & Pacific Market Value (USD Million) by Service Type, 2025-2035
  • Figure 182: South Asia & Pacific Market Value (USD Million) by Authentication Method, 2025-2035
  • Figure 183: South Asia & Pacific Market Value (USD Million) by Delivery Mode, 2025-2035
  • Figure 184: South Asia & Pacific Market Value (USD Million) by Deployment, 2025-2035
  • Figure 185: South Asia & Pacific Market Value (USD Million) by Customer Industry, 2025-2035
  • Figure 186: South Asia & Pacific Market Value (USD Million) by Country, 2025-2035
  • Figure 187: South Asia & Pacific Market Value (USD Million) Analysis by Country, 2020-2035
  • Figure 188: South Asia & Pacific Market Volume (Units) Analysis by Country, 2020-2035
  • Figure 189: South Asia & Pacific Market Value Share (%) and BPS Analysis by Country, 2025-2035
  • Figure 190: South Asia & Pacific Market Y-o-Y Growth (%) Projections by Country, 2025-2035
  • Figure 191: South Asia & Pacific Market Value (USD Million) Analysis by Service Type, 2020-2035
  • Figure 192: South Asia & Pacific Market Volume (Units) Analysis by Service Type, 2020-2035
  • Figure 193: South Asia & Pacific Market Value Share (%) and BPS Analysis by Service Type, 2025-2035
  • Figure 194: South Asia & Pacific Market Y-o-Y Growth (%) Projections by Service Type, 2025-2035
  • Figure 195: South Asia & Pacific Market Value (USD Million) Analysis by Authentication Method, 2020-2035
  • Figure 196: South Asia & Pacific Market Volume (Units) Analysis by Authentication Method, 2020-2035
  • Figure 197: South Asia & Pacific Market Value Share (%) and BPS Analysis by Authentication Method, 2025-2035
  • Figure 198: South Asia & Pacific Market Y-o-Y Growth (%) Projections by Authentication Method, 2025-2035
  • Figure 199: South Asia & Pacific Market Value (USD Million) Analysis by Delivery Mode, 2020-2035
  • Figure 200: South Asia & Pacific Market Volume (Units) Analysis by Delivery Mode, 2020-2035
  • Figure 201: South Asia & Pacific Market Value Share (%) and BPS Analysis by Delivery Mode, 2025-2035
  • Figure 202: South Asia & Pacific Market Y-o-Y Growth (%) Projections by Delivery Mode, 2025-2035
  • Figure 203: South Asia & Pacific Market Value (USD Million) Analysis by Deployment, 2020-2035
  • Figure 204: South Asia & Pacific Market Volume (Units) Analysis by Deployment, 2020-2035
  • Figure 205: South Asia & Pacific Market Value Share (%) and BPS Analysis by Deployment, 2025-2035
  • Figure 206: South Asia & Pacific Market Y-o-Y Growth (%) Projections by Deployment, 2025-2035
  • Figure 207: South Asia & Pacific Market Value (USD Million) Analysis by Customer Industry, 2020-2035
  • Figure 208: South Asia & Pacific Market Volume (Units) Analysis by Customer Industry, 2020-2035
  • Figure 209: South Asia & Pacific Market Value Share (%) and BPS Analysis by Customer Industry, 2025-2035
  • Figure 210: South Asia & Pacific Market Y-o-Y Growth (%) Projections by Customer Industry, 2025-2035
  • Figure 211: South Asia & Pacific Market Attractiveness by Service Type, 2025-2035
  • Figure 212: South Asia & Pacific Market Attractiveness by Authentication Method, 2025-2035
  • Figure 213: South Asia & Pacific Market Attractiveness by Delivery Mode, 2025-2035
  • Figure 214: South Asia & Pacific Market Attractiveness by Deployment, 2025-2035
  • Figure 215: South Asia & Pacific Market Attractiveness by Customer Industry, 2025-2035
  • Figure 216: South Asia & Pacific Market Attractiveness by Country, 2025-2035
  • Figure 217: Middle East and Africa Market Value (USD Million) by Service Type, 2025-2035
  • Figure 218: Middle East and Africa Market Value (USD Million) by Authentication Method, 2025-2035
  • Figure 219: Middle East and Africa Market Value (USD Million) by Delivery Mode, 2025-2035
  • Figure 220: Middle East and Africa Market Value (USD Million) by Deployment, 2025-2035
  • Figure 221: Middle East and Africa Market Value (USD Million) by Customer Industry, 2025-2035
  • Figure 222: Middle East and Africa Market Value (USD Million) by Country, 2025-2035
  • Figure 223: Middle East and Africa Market Value (USD Million) Analysis by Country, 2020-2035
  • Figure 224: Middle East and Africa Market Volume (Units) Analysis by Country, 2020-2035
  • Figure 225: Middle East and Africa Market Value Share (%) and BPS Analysis by Country, 2025-2035
  • Figure 226: Middle East and Africa Market Y-o-Y Growth (%) Projections by Country, 2025-2035
  • Figure 227: Middle East and Africa Market Value (USD Million) Analysis by Service Type, 2020-2035
  • Figure 228: Middle East and Africa Market Volume (Units) Analysis by Service Type, 2020-2035
  • Figure 229: Middle East and Africa Market Value Share (%) and BPS Analysis by Service Type, 2025-2035
  • Figure 230: Middle East and Africa Market Y-o-Y Growth (%) Projections by Service Type, 2025-2035
  • Figure 231: Middle East and Africa Market Value (USD Million) Analysis by Authentication Method, 2020-2035
  • Figure 232: Middle East and Africa Market Volume (Units) Analysis by Authentication Method, 2020-2035
  • Figure 233: Middle East and Africa Market Value Share (%) and BPS Analysis by Authentication Method, 2025-2035
  • Figure 234: Middle East and Africa Market Y-o-Y Growth (%) Projections by Authentication Method, 2025-2035
  • Figure 235: Middle East and Africa Market Value (USD Million) Analysis by Delivery Mode, 2020-2035
  • Figure 236: Middle East and Africa Market Volume (Units) Analysis by Delivery Mode, 2020-2035
  • Figure 237: Middle East and Africa Market Value Share (%) and BPS Analysis by Delivery Mode, 2025-2035
  • Figure 238: Middle East and Africa Market Y-o-Y Growth (%) Projections by Delivery Mode, 2025-2035
  • Figure 239: Middle East and Africa Market Value (USD Million) Analysis by Deployment, 2020-2035
  • Figure 240: Middle East and Africa Market Volume (Units) Analysis by Deployment, 2020-2035
  • Figure 241: Middle East and Africa Market Value Share (%) and BPS Analysis by Deployment, 2025-2035
  • Figure 242: Middle East and Africa Market Y-o-Y Growth (%) Projections by Deployment, 2025-2035
  • Figure 243: Middle East and Africa Market Value (USD Million) Analysis by Customer Industry, 2020-2035
  • Figure 244: Middle East and Africa Market Volume (Units) Analysis by Customer Industry, 2020-2035
  • Figure 245: Middle East and Africa Market Value Share (%) and BPS Analysis by Customer Industry, 2025-2035
  • Figure 246: Middle East and Africa Market Y-o-Y Growth (%) Projections by Customer Industry, 2025-2035
  • Figure 247: Middle East and Africa Market Attractiveness by Service Type, 2025-2035
  • Figure 248: Middle East and Africa Market Attractiveness by Authentication Method, 2025-2035
  • Figure 249: Middle East and Africa Market Attractiveness by Delivery Mode, 2025-2035
  • Figure 250: Middle East and Africa Market Attractiveness by Deployment, 2025-2035
  • Figure 251: Middle East and Africa Market Attractiveness by Customer Industry, 2025-2035
  • Figure 252: Middle East and Africa Market Attractiveness by Country, 2025-2035

Frequently Asked Questions

How big is the Global Digital Identity Services Market in 2025?

The Global Digital Identity Services Market is estimated to be valued at USD 28,504.4 million in 2025.

What will be the size of the Global Digital Identity Services Market in 2035?

The market size for the Global Digital Identity Services Market is projected to reach USD 86,541.2 million by 2035.

How much will be the Global Digital Identity Services Market growth between 2025 and 2035?

The Global Digital Identity Services Market is expected to grow at a CAGR of 11.7% between 2025 and 2035.

What are the key service types in the Global Digital Identity Services Market?

The key service types in the Global Digital Identity Services Market are identity verification & KYC/AML, authentication & access, fraud detection & risk scoring, identity orchestration & workflow, and credential issuance & wallet.

Which delivery model will contribute the most share in the Global Digital Identity Services Market in 2025?

In terms of delivery model, API-first SaaS is expected to command the largest share of 63.8% in the Global Digital Identity Services Market in 2025.

Explore Similar Insights

Future Market Insights

Digital Identity Services Market