

- Market Size (2026)
- USD 980.7 Mn
- Forecast (2036)
- USD 1723.4 Mn
- CAGR (2026 to 2036)
- 5.8%
How big is the Duct Rodders Market in 2026?
USD 980.7 million in 2026 and USD 1,723.4 million by 2036 at a 5.8% CAGR from 2026 to 2036.
Demand for duct rodders is projected to expand at 5.8% CAGR from 2026 to 2036, lifting valuation from USD 980.7 million to USD 1,723.4 million. Network contractors use these rods before a cable pull to test a conduit path and carry a draw line through it. In January 2025, the International Telecommunication Union estimated a digital infrastructure investment gap of at least USD 1,600 billion. That funding pressure is expected to support more staged network construction, making fiber installation tools important for repeated field use.
Demand patterns are expected to vary across major markets. India and China are projected to remain key contributors to new-route installations, reflecting continued expansion of fiber-optic and broadband infrastructure. The United States and Germany are likely to exhibit stronger demand for duct rodders in replacement and rehabilitation applications, as network operators prioritize the optimization and assessment of established duct systems. Crews compare rod diameter against conduit size before they choose reel length and tip geometry for a run. The OECD reported in May 2025 that fiber represented 44.6% of fixed broadband connections across member countries. More fiber access points are forecast to increase routine rodding work beside direct burial cable systems.
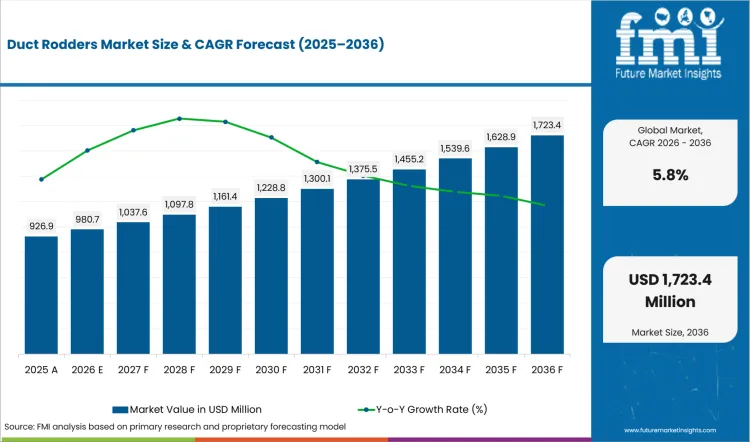
| Metric | Value |
|---|---|
| 2025 Market Size | USD 926.9 million |
| 2026 Market Size | USD 980.7 million |
| 2036 Market Size | USD 1,723.4 million |
| Forecast CAGR (2026-2036) | 5.8% |
| Rodder Type Focus | Fiberglass duct rodders |
| Fiberglass duct rodders Share (2026) | 34.0% |
| Rod Diameter Focus | 6-10 mm rods |
| 6-10 mm rods Share (2026) | 42.0% |
| Rod Length Focus | 100-300 m |
| 100-300 m Share (2026) | 39.0% |
Summary of the Duct Rodders Market
| Market Signal | Commercial Impact |
|---|---|
| Demand and Growth Drivers | New conduit construction and repeated access to existing ducts are expected to support demand. Crews use a rodder before cable entry because a blocked path turns a planned pull into lost field time.
|
| Product and Segment View | The product mix is expected to stay closely linked to conduit diameter and run length. A rod that is too soft stalls in a long duct while excess stiffness makes tighter bends harder to pass.
|
| Geography and Growth Outlook | Country growth is expected to reflect the pace of fiber buildout and the condition of installed conduit networks. New-route work and maintenance work create different tool needs.
|
| Competitive Landscape | Competition is expected to center on rod behavior inside the duct and the support available after field damage. Product breadth carries less weight if crews cannot replace a tip or repair a broken section quickly.
|
| Analyst Perspective | Purchasing decisions are often influenced by how reliably a duct rodder performs during installation. Ease of feeding, durability, and the ability to remain operational despite routine wear and damage are key considerations for cable installation crews.
|
Source: FMI's proprietary forecasting model and primary research
How is the duct rodders market segmented?
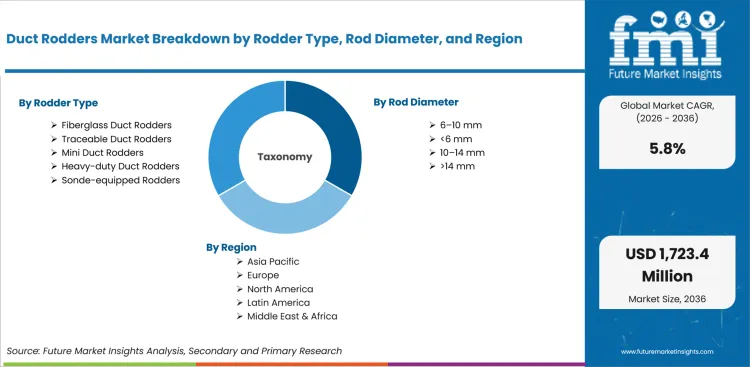
The duct rodders industry is segmented by rodder type, rod diameter, rod length, application, sales channel, and region.
The duct rodders market is segmented by rodder type, rod diameter, rod length, application, and sales channel. Rodder type covers fiberglass duct rodders and traceable models. It also covers mini, heavy-duty, and sonde-equipped rodders. Rod diameter covers below 6 mm and 6-10 mm. Larger groups include 10-14 mm and above 14 mm. Rod length covers below 100 m and 100-300 m. Longer options include 300-500 m and above 500 m. Application covers telecom ducts and power cable ducts. It also includes sewer or drain inspection and utility conduit pulling. Sales channels include tool distributors and telecom supply houses. Direct OEM and online or catalog sales complete the channel scope across regions linked to wire and cable demand.
How does fiberglass shape demand within the rodder type category?
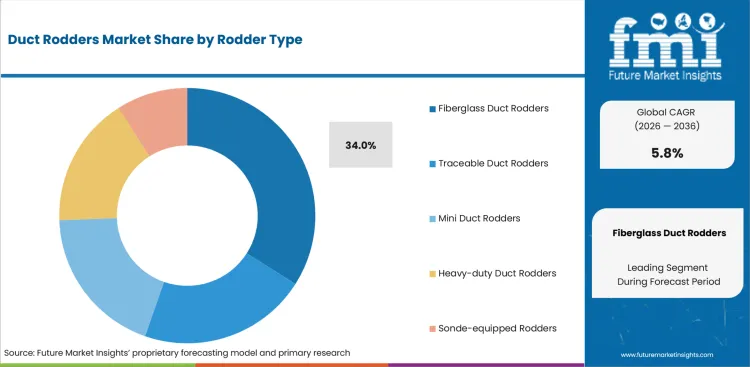
Field crews often need one rodder platform for new cable work and maintenance calls. The Fiber Broadband Association reported in December 2025 that fiber deployment passed 11.8 million additional USA homes during the year. That build pace creates more jobs requiring technicians to prove a conduit path before a pull begins. Fiberglass rods fit this workflow because crews can select different diameters and repair common end fittings in the field.
- Based on rodder type, fiberglass duct rodders are projected to account for 34.0% in 2026 due to familiar field handling and broad accessory support. Contractors use the same basic rod form across telecom and utility conduit jobs. The choice remains practical when cable material selection follows a confirmed duct path.
- Telecom contractors purchase fiberglass rodders because the rods pass bends without losing enough stiffness to push the next section, while repairable rod ends support repeat field use.
What supports demand for 6-10 mm rods within the rod diameter category?
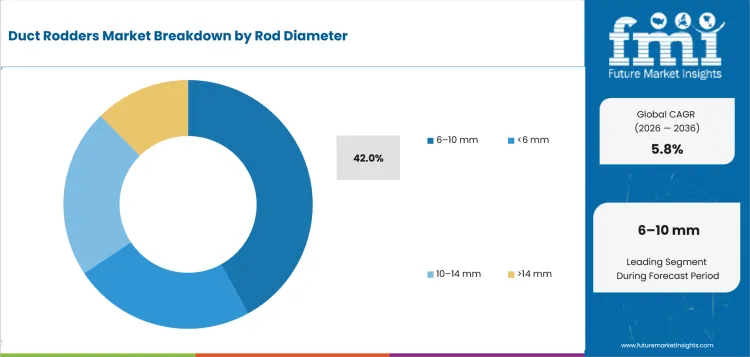
Diameter choice starts with the pipe opening and becomes more difficult once the route includes several sweeps. The European Commission published its broadband coverage study in June 2025 across 31 countries. Work on those varied access networks spans narrow building ducts and larger street conduit. Mid-diameter rods suit mixed contractor fleets because they balance push force with bend handling across common access jobs.
- By rod diameter, 6-10 mm rods are estimated to hold 42.0% in 2026 because they fit many telecom conduit runs. They provide more push force than very small rods without the handling burden of heavier products. The range remains useful beside telecom network infrastructure work across city access routes and utility corridors.
- Demand for 6-10 mm rods is projected to grow among mixed utility crews because one work program often includes varied conduit sizes. A crew can cover short building entries and longer street runs with fewer reel changes. Purchase decisions weigh minimum bend radius and available repair parts together.
How is the 100-300 m band positioned within the rod length category?
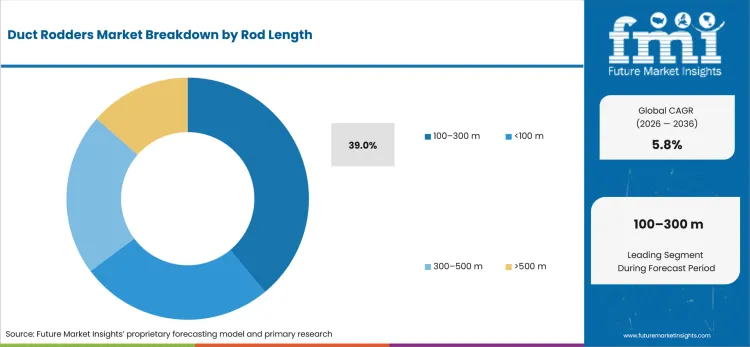
Rod length has to match access-point spacing without turning the reel into dead weight on shorter jobs. Contractors working across changing project schedules need reel lengths that cover routine runs without forcing an oversized cage into every work zone. The 100-300 m band gives crews useful reach for repeated chamber-to-chamber work while keeping the frame manageable for vehicle loading.
- In 2026, the 100-300 m band is expected to lead rod length with 39.0% share because it covers many chamber-to-chamber runs. The reel remains manageable for vehicle loading and roadside setup. Contractors use this band beside underground cable networks once route length is known before work begins.
- Utility contractors are increasingly purchasing 100-300 m rodders because they need useful reach without carrying the heaviest frame. Medium lengths fit repeat maintenance routes and planned new conduit sections.
What drives telecom duct demand within the application category?
Telecom duct work creates repeated rodding tasks before cable blowing or pulling begins. The International Telecommunication Union reported in November 2025 that 6 billion people were using the Internet worldwide during 2025. Access-network expansion and upgrade work require crews to check conduit continuity before they commit cable and pulling equipment.
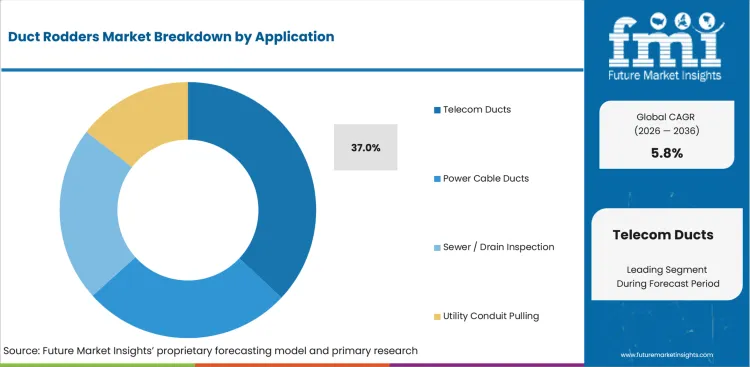
- By application, telecom ducts are forecast to represent 37.0% in 2026 driven by repeated fiber installation and maintenance work. Contractors use rods to place draw lines and identify obstructions before cable entry. Demand tracks local access construction beside telecom equipment programs and recurring repair activity across installed routes.
- Telecom duct applications are drawing attention from fiber crews because discovering a blocked route after cable equipment is set up wastes field time and forces avoidable crew resets. Traceable options support jobs that include route confirmation and obstruction location as part of the work plan.
How do contractors evaluate tool distributors within the sales channel category?
A rodder sale rarely ends with the reel because field damage creates demand for tips and repair pieces. Project schedules create uneven local demand for field tools and spares, especially when a damaged reel must return to work before the next planned pull. Distributors remain useful when contractors need replacement parts between scheduled jobs instead of waiting for factory lead times.
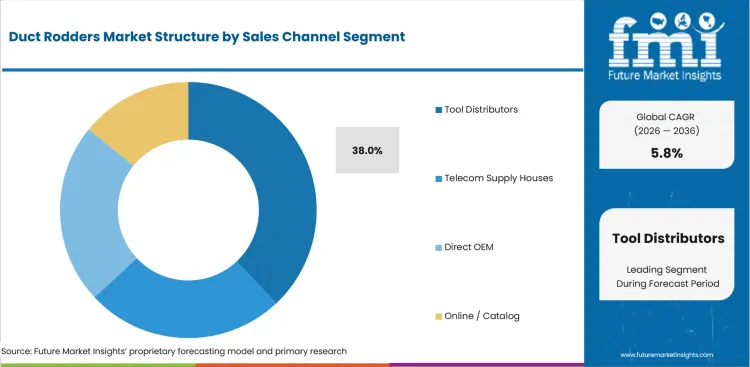
- Tool distributors are estimated to hold 38.0% share in 2026 due to local stock access and repair-part availability near active contractor projects. Contractors often need a coupling or pulling eye before the next shift. Distributor reach remains relevant beside utility locator equipment purchases.
- Purchase activity through tool distributors is anticipated to rise because mixed contractor fleets need both reels and replacement components. A local counter lets crews compare diameter and length before purchase.
What are the drivers, restraints, and opportunities in the duct rodders market?
Network construction is expected to support rodder demand, damaged or blocked ducts are anticipated to slow field productivity, and traceable systems are projected to open higher-value locating workflows.
- Driver: Expanding fiber and utility conduit programs are projected to increase the number of runs that need a draw line before cable installation starts.
- Restraint: Field productivity is anticipated to fall if crushed ducts and tight sweeps prevent the selected rod diameter from passing the route.
- Opportunity: Traceable and sonde-compatible rod systems are forecast to extend supplier value beyond line placement into route confirmation and obstruction locating.
Network construction teams need a simple way to confirm that conduit remains passable before expensive cable work begins. In November 2025, GSMA reported that mobile operators across 21 Asia Pacific countries had invested almost USD 440 billion in network expansion since 2015. Contractors protect crew time by rodding first and setting cable equipment after the route is proven.
Old conduit presents a different problem because the obstruction is often hidden until the rod stops. In August 2025, the Federal Communications Commission issued a broadband infrastructure order focused on removing deployment barriers. Faster permitting does not remove crushed ducts or sharp sweeps underground. Contractors screen rod diameter against route condition before work starts and reserve heavier tools for paths needing more push force. Clear route notes help crews avoid repeated setup attempts at the same obstruction.
Locating workflows are forecast to turn some difficult runs into a broader service task for contractors. In May 2026, Radiodetection introduced the Noggin GPR system with SplitView for underground data review. Contractors value products that help place a line and confirm the route before excavation. That workflow links duct preparation to cable fault location tools as underground asset knowledge shapes field planning.
Which country CAGRs are profiled in the duct rodders market?
.webp "Top Country Growth Comparison Duct Rodders Market Cagr (2026 2036)")
| Country | CAGR |
|---|---|
| United States | 4.9% |
| China | 6.9% |
| India | 7.7% |
| Germany | 4.5% |
| United Kingdom | 5.2% |
| Japan | 4.2% |
| Canada | 5.4% |
Source: FMI's proprietary forecasting model and primary research
How do country-level CAGRs compare in the duct rodders market?
Profiled country growth is expected to follow two different work patterns. India and China are anticipated to benefit from long build programs that add new duct routes. The United States and Canada combine new construction with maintenance across large service territories. Germany and the United Kingdom face more urban route preparation around existing underground assets. Japan is expected to advance through planned upgrades and careful work inside constrained sites.
- Federal middle-mile projects are creating long fiber routes across states and territories, requiring construction crews to prepare conduit reliably. The United States is projected to grow at 4.9% CAGR from 2026 to 2036 due to a mix of new fiber work and maintenance of installed routes. In January 2025, the National Telecommunications and Information Administration reported nearly USD 980 million in awards for more than 12,500 miles of new middle-mile fiber. Condux International and General Machine Products give domestic contractors direct access to duct rodder ranges and service support.
- China ended 2025 with gigabit optical access available in every county and continuing network construction across a very large installed base. Duct rodder demand in China is forecast to rise at 6.9% CAGR over the 2026 to 2036 forecast period because long route programs and dense urban work increase tool use. The State Council Information Office reported in January 2026 that the national optical fiber cable network reached 74.99 million km. Local crews compare reel reach against access spacing before choosing rod diameter across single-mode fiber routes. Contractors also need repair parts near high-volume construction zones.
- India is extending optical routes into villages and cities at the same time, creating varied conduit lengths and field conditions. Adoption of duct rodders in India is estimated to expand at 7.7% CAGR from 2026 to 2036 driven by fiber construction and maintenance work. The Press Information Bureau reported in December 2025 that optical fiber cable length reached 4.236 million route km by September 2025. Stanlay's office network across India gives telecom and utility crews local access to technical support and inventory. Regional distributors shorten repair delays between projects by keeping common tips and repair pieces closer to active work sites.
- Germany is adding fiber connections within cities, making route preparation more careful around street access and existing underground services. Germany's duct rodders sector is projected to record 4.5% CAGR over the 2026 to 2036 assessment period supported by FTTH and FTTB construction. Bundesnetzagentur reported in June 2026 that connected fiber reached 7.1 million FTTH locations in 2025. KATIMEX serves cable installers with rod systems built around different conduit and cable-laying tasks. Urban contractors also need cage frames that fit controlled roadside work areas. Buyers favor clear bending limits and service documentation before wider fleet standardization across repeat urban and regional project work.
- Full-fiber construction now reaches most UK homes, shifting more contractor work toward infill routes and difficult remaining areas. In the United Kingdom, duct rodder demand is anticipated to advance at 5.2% CAGR from 2026 to 2036 because build and maintenance work continues. Ofcom reported in May 2026 that full fiber was available to 24.9 million residential premises in January 2026. Contractors need compact frames around urban chambers and durable rods on rural extensions. Dense construction schedules make lost shifts costly for smaller installation teams. Service depots near active build areas shorten downtime after tool damage.
- Japan combines dense urban access work with national goals for fiber availability. The combination places a premium on orderly tool handling. Japan is estimated to post 4.2% CAGR over the 2026 to 2036 forecast period due to maintenance work and network upgrades. The OECD reported in July 2025 that Japan's wireless-environment program carried USD 31.9 million in public funding. Compact reels and controlled payout suit narrow work zones around existing utilities. Careful tool storage also carries weight for crews working from compact vehicles and narrow staging areas.
- Canada must prepare fiber routes across widely separated communities, so a damaged field tool can stop work far from the nearest service counter. Duct rodder sales in Canada are forecast to expand at 5.4% CAGR from 2026 to 2036 supported by rural broadband construction. The Canadian Radio-television and Telecommunications Commission reported in April 2026 that its Broadband Fund supported nearly 6,000 km of fiber construction. DCD Design & Manufacturing gives Canadian contractors direct access to standard and detectable rodders from its Richmond, British Columbia base. Long travel distances increase the cost of waiting for a small replacement component.
Who are the notable companies in the duct rodders market?
Condux International, General Machine Products, Jameson LLC, KATIMEX, RUNPOTEC, DCD Design & Manufacturing, Radiodetection, Stanlay, and WCT Products are the notable companies shaping this market.
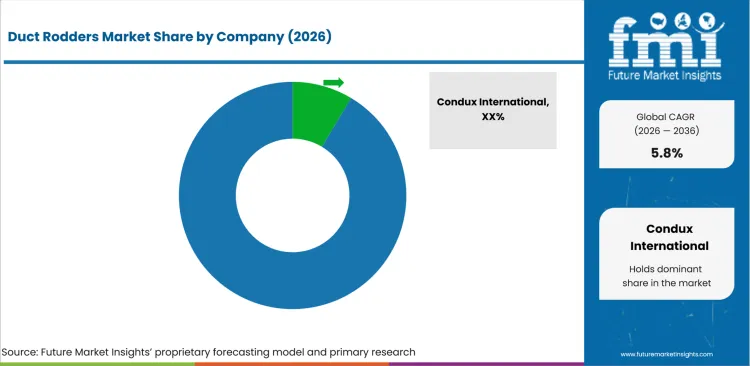
Duct rodder competition centers on fit with conduit size and route length because crews screen those limits before brand preference. Manufacturers are competing on rod stiffness/bending radius and factors such as reel construction/ brake control shape selection. Traceable products are offering another criteria of competition because the rod can become part of an underground locating workflow. For telecom contractors also managing fiber optics testing needs, the same distributor relationship often covers rodders and test gear.
- Condux International are focusing on a direct duct-rodder range and a wider set of fishing tools. General Machine Products adds continuous rodders and powered rod pushing equipment. Both appeal to telecom contractors that want field equipment and matching accessories from established cable-installation suppliers.
- For standard and traceable rodder work, Jameson LLC offers formats that fit telecom and utility crews. KATIMEX competes through cable-pulling systems built for different conduit tasks. Jameson is more rodder-focused while KATIMEX spans a wider installation-tool system.
- Measured feed is a clear point of separation in RUNPOTEC's cable-pulling range. DCD Design & Manufacturing offers standard and detectable rodders across several rod diameters. Their comparison centers on size choice and replaceable accessories for contractors with mixed project books.
- Locating workflows separate Radiodetection from rodder-first suppliers because its sondes and locator systems extend beyond line placement. Stanlay offers traceable rodder products for telecom and utility mapping. WCT Products adds catalog access to detectable and standard rodders alongside repair components.
Competitive Benchmarking: Duct Rodders Market
| Company | Rodder Relevance | Traceable Options | Specification Support | Service Reach |
|---|---|---|---|---|
| Condux International | High | Medium | High | Regional; North America |
| General Machine Products | High | High | High | Regional; North America |
| Jameson LLC | High | High | High | Regional; North America |
| KATIMEX | High | Medium | High | Regional; Europe |
| RUNPOTEC | High | Medium | High | Regional; Europe |
| DCD Design & Manufacturing | High | High | High | Regional; North America |
| Radiodetection | Medium | High | High | Global |
| Stanlay | High | High | High | Country-specific; India |
| WCT Products | Medium | Medium | Medium | Country-specific; United States |
Scoring basis: High indicates substantial direct capability in the stated dimension. Medium indicates relevant but partial or indirect capability. Low indicates limited direct evidence for the stated dimension.
Source: Future Market Insights competitive analysis, 2026. Ratings reflect relative portfolio relevance and workflow fit. Service capability and geographic reach shape the remaining comparison.
Key Developments in the Duct Rodders Market
- In April 2025, Hebei Sinta FRP highlighted its fiberglass duct rodder range for faster cable installation across underground conduits and utility networks.
- In May 2025, RUNPOTEC expanded its GF3 SLIM cable pulling system with an adapter thread set supporting broader accessory compatibility for conduit installation work.
- In September 2025, Greenlee showcased its latest cable pulling technologies at NECA 2025 including a high-performance pulling rope for demanding conduit installation applications.
Key Players in the Duct Rodders Market
Duct rodder manufacturers
- Condux International
- General Machine Products
- Jameson LLC
- KATIMEX
- RUNPOTEC
- DCD Design & Manufacturing
Traceable and locating-oriented suppliers
- Radiodetection
- Stanlay
Distribution and catalog specialists
- WCT Products
Duct Rodders Market - Report Scope
| Coverage field | Report scope |
|---|---|
| Market breakdown | Rodder type, rod diameter, rod length, application, sales channel, and region |
| Market Definition | Duct rodders are flexible rod systems used to prove conduit routes, place draw lines, and support cable or utility work inside ducts. |
| Regions Covered | North America, Latin America, Western Europe, Eastern Europe, East Asia, South Asia and Pacific, and Middle East and Africa |
| Countries Covered | United States, China, India, Germany, United Kingdom, Japan, South Korea, Canada, and 30+ countries |
| Key Companies Profiled | Condux International, General Machine Products, Jameson LLC, KATIMEX, RUNPOTEC, DCD Design & Manufacturing, Radiodetection, Stanlay, WCT Products |
| Forecast Period | 2026 to 2036 |
| Approach | Hybrid methodology using bottom-up supplier and channel assessment with top-down infrastructure and end-use checks. |
Source: Future Market Insights - analysis driven by proprietary forecasting models and primary research
Duct Rodders Market - Research Methodology
| Method | Approach |
|---|---|
| Primary Research | FMI interviews manufacturers, distributors, telecom contractors, utility crews, and tool rental specialists. Discussions test how crews select rod diameter and reel length for real conduit routes. Interviews also cover replacement-part demand and repair practice after field damage. Interview notes also test how crews respond to blocked ducts and damaged rod sections. |
| Desk Research | Desk research reviews official infrastructure programs and regulator publications beside company product information. Analysts examine fiber build activity and conduit work patterns. The team also reviews product ranges for rod diameter, reel length, traceable options, repair parts, and channel availability by region. |
| Market Sizing and Forecasting | FMI sizes demand through a hybrid methodology that combines bottom-up supplier checks with top-down infrastructure indicators. Revenue estimates are tested against channel availability and application mix. Forecasts account for replacement purchases and new route work. Segment shares are reconciled so category totals remain consistent with the market value path. Country growth rates are then tested against local infrastructure work and contractor access to field tools. |
| Data Validation | Data validation compares interview findings from manufacturers, distributors, telecom contractors, and utility crews against fiber deployment programs and channel availability. Analysts test country growth against route construction activity, conduit maintenance needs, and access to replacement parts. The forecast is then triangulated across new-route work, replacement purchases, and field repair cycles that influence repeat duct rodder demand. |
Source: Future Market Insights (FMI) analysis, based on proprietary forecasting model and primary research
Duct Rodders Market by Segments
Duct Rodders Market segmented by Rodder Type:
- Fiberglass duct rodders
- Traceable duct rodders
- Mini duct rodders
- Heavy-duty duct rodders
- Sonde-equipped rodders
Duct Rodders Market segmented by Rod Diameter:
- Below 6 mm
- 6-10 mm
- 10-14 mm
- Above 14 mm
Duct Rodders Market segmented by Rod Length:
- Below 100 m
- 100-300 m
- 300-500 m
- Above 500 m
Duct Rodders Market segmented by Application:
- Telecom ducts
- Power cable ducts
- Sewer or drain inspection
- Utility conduit pulling
Duct Rodders Market segmented by Sales Channel:
- Tool distributors
- Telecom supply houses
- Direct OEM
- Online or catalog
Duct Rodders Market by Region:
- North America
- United States
- Canada
- Latin America
- Brazil
- Mexico
- Rest of Latin America
- Western Europe
- Germany
- United Kingdom
- France
- Italy
- Spain
- Rest of Western Europe
- Eastern Europe
- Poland
- Russia
- Rest of Eastern Europe
- East Asia
- China
- Japan
- South Korea
- South Asia and Pacific
- India
- ASEAN
- Australia and New Zealand
- Rest of South Asia and Pacific
- Middle East and Africa
- GCC countries
- South Africa
- Rest of Middle East and Africa
Research Sources and Bibliography
- International Telecommunication Union. (2025, January). Digital Infrastructure Investment Initiative: Closing the digital infrastructure investment gap by 2030. International Telecommunication Union.
- Organisation for Economic Co-operation and Development. (2025, May). Fibre and 5G continue to expand their footprint, while fixed wireless access gains ground in OECD countries. OECD.
- Organisation for Economic Co-operation and Development. (2025, July). Closing broadband connectivity divides for all. OECD.
- International Telecommunication Union. (2025, November). ITU’s Facts and Figures 2025 shows steady progress, but digital divides remain. International Telecommunication Union.
- GSMA. (2025, November). Digital Nations 2025: Sustaining progress in Asia Pacific’s digital transformation. GSMA.
- National Telecommunications and Information Administration. (2025, January). Technology in service of human progress: NTIA’s accomplishments in the Biden-Harris administration. USA Department of Commerce.
- State Council of the People’s Republic of China. (2026, January). China’s 5G base stations top 4.83 million by end of 2025. The State Council.
- Press Information Bureau. (2025, December). 2025 year end review for Department of Telecommunications. Government of India.
- Bundesnetzagentur. (2026, June). Telecoms Annual Report 2025. Bundesnetzagentur.
- Ofcom. (2026, May). Connected Nations update: Spring 2026. Ofcom.
- Canadian Radio-television and Telecommunications Commission. (2026, April). Telecom Notice of Consultation CRTC 2026-63. CRTC.
- Fiber Broadband Association. (2025, December). Fiber Broadband Association reports historic fiber deployment highs. Fiber Broadband Association.
- European Commission. (2025, June). Digital Decade 2025: Broadband Coverage in Europe 2024. European Commission.
- Federal Communications Commission. (2025, August). Unleashing high-speed infrastructure. Federal Communications Commission.
- General Machine Products. (2025). Continuous duct rodders. General Machine Products.
- Radiodetection. (2026, June). Radiodetection Enhances Underground Precision with New Intuitive Sonde Locating Performance. Radiodetection.
- Condux International. (2025, September). Cable installation: Tools & equipment catalog. Condux International.
- Hebei Sinta FRP Co., Ltd. (2025, April 24). Innovative fiberglass duct rodders revolutionize cable installation.
- RUNPOTEC GmbH. (2025, May). GF3 SLIM adapter thread-set: RTG Ø 3 mm internal thread to RTG Ø 6 mm external thread.
- Greenlee. (2025, September 10). Greenlee showcases bending, pulling, and new innovations at the 2025 National Electrical Contractors Association Convention and Trade Show.
- RUNPOTEC. (2025). Product catalog 2025. RUNPOTEC.
This bibliography is provided for reader reference and uses primary government, standards-body, official trade body, and company sources.
This Report Answers
- What is the estimated value of the duct rodders market in 2026 and what valuation is projected by 2036?
- What CAGR is the duct rodders market forecast to record from 2026 to 2036?
- Which segments are projected to shape demand across rodder type, diameter, length, application, and sales channel categories?
- Which construction pressures and field conditions are expected to support duct rodder purchase activity?
- How are country CAGRs anticipated to differ across the profiled markets?
- Which companies compete across rod design, traceable options, specification support, and service reach?
- How does FMI validate duct rodder forecasts through its hybrid model approach?
- What should telecom contractors and utility crews evaluate before a broader sourcing commitment?
- How do route documentation and underground locating requirements affect supplier selection?
Frequently Asked Questions
What is driving growth in the Duct Rodders Market?
Growth is expected to be driven by fiber construction and repeated conduit access work. Crews are projected to use rodders before cable installation to verify routes and place draw lines efficiently.
Who are the key players in the Duct Rodders Market?
Condux International, General Machine Products, Jameson LLC, KATIMEX, RUNPOTEC and DCD Design & Manufacturing are notable participants. Competition centers on rod performance and the quality of repair support services.
What is a notable restraint in the Duct Rodders Market?
Adoption is anticipated to slow where crushed ducts and tight sweeps prevent successful rod passage. Poor diameter selection can increase failed attempts and require additional crew intervention.
Why should executives track the Duct Rodders Market?
Executives should track the market because fiber construction converts infrastructure spending into recurring field tool demand. Product preferences are projected to evolve with route length requirements and locating applications.
What business problem does the Duct Rodders Market address?
Duct rodders help crews confirm conduit continuity before cable work begins. They also enable the placement of draw lines through enclosed routes that cannot be accessed manually.
What should procurement leaders evaluate before selecting suppliers?
Procurement leaders should compare bending radius against conduit geometry and verify repair part availability. Supplier selection should also align with the reel lengths most frequently used by field crews.
What limits return on investment for purchasers?
Returns fall when crews carry oversized reels that rarely match actual job requirements. Productivity can also decline when replacement tips and repair components are not readily available.
How do suppliers build long-term account confidence?
Suppliers build confidence through clear diameter guidance and responsive troubleshooting after field damage. Local availability of compatible tips and repair kits is expected to encourage repeat contractor purchases.
Preview the report firsthand - request a free sample
Get SampleGet the brochure for pricing and purchase details.
Get PDFTable of Content
- Key Takeaways
- Market Size and CAGR
- Top Growth Driver
- Fastest Growing Segment
- Leading Region
- Key Companies
- Emerging Opportunities
- Executive Summary
- Global Market Outlook
- Demand-side Trends
- Supply-side Trends
- Technology Roadmap Analysis
- Analysis and Recommendations
- Analyst Perspective (What is happening? Why now? What should investors know?)
- Key Questions Answered
- How large is the market?
- What is the CAGR?
- What are key trends?
- Which region dominates?
- Who are the leaders?
- Market Overview
- Market Coverage / Taxonomy
- Market Definition / Scope / Limitations
- Research Methodology
- Chapter Orientation
- Analytical Lens and Working Hypotheses
- Market Structure, Signals, and Trend Drivers
- Benchmarking and Cross-market Comparability
- Market Sizing, Forecasting, and Opportunity Mapping
- Research Design and Evidence Framework
- Desk Research Programme (Secondary Evidence)
- Expert Input and Fieldwork (Primary Evidence)
- Tooling, Models, and Reference Databases
- Data Engineering and Model Build
- Quality Assurance and Audit Trail
- Market Background
- Market Dynamics (Drivers, Restraints, Opportunity, Trends)
- Scenario Forecast (Optimistic, Likely, Conservative)
- Impact Analysis
- AI Impact
- Sustainability Impact
- Regulatory Impact
- Technology Impact
- Consumer / Buyer Analysis
- Purchase Drivers
- Adoption Barriers
- Buyer Journey
- Opportunity Map Analysis
- Product Life Cycle Analysis
- Supply Chain Analysis
- Investment Feasibility Matrix
- Value Chain Analysis
- PESTLE and Porter's Analysis
- Regulatory Landscape
- Regional Parent Market Outlook
- Production and Consumption Statistics
- Import and Export Statistics
- Global Market Analysis and Forecast, 2021 to 2036
- Historical Market Size Value (USD Million) & Volume (Unit) Analysis, 2021 to 2025
- Current and Future Market Size Value (USD Million) & Volume (Unit) Projections, 2026 to 2036
- Y-o-Y Growth Trend Analysis
- Absolute $ Opportunity Analysis
- Global Market Pricing Analysis, 2021 to 2036
- Global Market Analysis and Forecast, By Rodder Type, 2021 to 2036
- Introduction / Key Findings
- Historical Market Size Value (USD Million) & Volume (Unit) Analysis By Rodder Type, 2021 to 2025
- Current and Future Market Size Value (USD Million) & Volume (Unit) Analysis and Forecast By Rodder Type, 2026 to 2036
- Fiberglass Duct Rodders
- Traceable Duct Rodders
- Mini Duct Rodders
- Heavy-duty Duct Rodders
- Sonde-equipped Rodders
- Fiberglass Duct Rodders
- Y-o-Y Growth Trend Analysis By Rodder Type, 2021 to 2025
- Absolute $ Opportunity Analysis By Rodder Type, 2026 to 2036
- Global Market Analysis and Forecast, By Rod Diameter, 2021 to 2036
- Introduction / Key Findings
- Historical Market Size Value (USD Million) & Volume (Unit) Analysis By Rod Diameter, 2021 to 2025
- Current and Future Market Size Value (USD Million) & Volume (Unit) Analysis and Forecast By Rod Diameter, 2026 to 2036
- 6-10 mm
- <6 mm
- 10-14 mm
- >14 mm
- 6-10 mm
- Y-o-Y Growth Trend Analysis By Rod Diameter, 2021 to 2025
- Absolute $ Opportunity Analysis By Rod Diameter, 2026 to 2036
- Global Market Analysis and Forecast, By Rod Length, 2021 to 2036
- Introduction / Key Findings
- Historical Market Size Value (USD Million) & Volume (Unit) Analysis By Rod Length, 2021 to 2025
- Current and Future Market Size Value (USD Million) & Volume (Unit) Analysis and Forecast By Rod Length, 2026 to 2036
- 100-300 m
- <100 m
- 300-500 m
- >500 m
- 100-300 m
- Y-o-Y Growth Trend Analysis By Rod Length, 2021 to 2025
- Absolute $ Opportunity Analysis By Rod Length, 2026 to 2036
- Global Market Analysis and Forecast, By Application, 2021 to 2036
- Introduction / Key Findings
- Historical Market Size Value (USD Million) & Volume (Unit) Analysis By Application, 2021 to 2025
- Current and Future Market Size Value (USD Million) & Volume (Unit) Analysis and Forecast By Application, 2026 to 2036
- Telecom Ducts
- Power Cable Ducts
- Sewer / Drain Inspection
- Utility Conduit Pulling
- Telecom Ducts
- Y-o-Y Growth Trend Analysis By Application, 2021 to 2025
- Absolute $ Opportunity Analysis By Application, 2026 to 2036
- Global Market Analysis and Forecast, By Sales Channel, 2021 to 2036
- Introduction / Key Findings
- Historical Market Size Value (USD Million) & Volume (Unit) Analysis By Sales Channel, 2021 to 2025
- Current and Future Market Size Value (USD Million) & Volume (Unit) Analysis and Forecast By Sales Channel, 2026 to 2036
- Tool Distributors
- Telecom Supply Houses
- Direct OEM
- Online / Catalog
- Tool Distributors
- Y-o-Y Growth Trend Analysis By Sales Channel, 2021 to 2025
- Absolute $ Opportunity Analysis By Sales Channel, 2026 to 2036
- Global Market Analysis and Forecast, By Region, 2021 to 2036
- Introduction
- Historical Market Size Value (USD Million) & Volume (Unit) Analysis By Region, 2021 to 2025
- Current Market Size Value (USD Million) & Volume (Unit) Analysis and Forecast By Region, 2026 to 2036
- North America
- Latin America
- Western Europe
- Eastern Europe
- East Asia
- South Asia and Pacific
- Middle East & Africa
- Market Attractiveness Analysis By Region
- North America Market Analysis and Forecast, By Country, 2021 to 2036
- Historical Market Size Value (USD Million) & Volume (Unit) Trend Analysis By Market Taxonomy, 2021 to 2025
- Market Size Value (USD Million) & Volume (Unit) Forecast By Market Taxonomy, 2026 to 2036
- By Country
- USA
- Canada
- By Rodder Type
- By Rod Diameter
- By Rod Length
- By Application
- By Sales Channel
- By Country
- Market Attractiveness Analysis
- By Country
- By Rodder Type
- By Rod Diameter
- By Rod Length
- By Application
- By Sales Channel
- Key Takeaways
- Latin America Market Analysis and Forecast, By Country
- Historical Market Size Value (USD Million) & Volume (Unit) Trend Analysis By Market Taxonomy, 2021 to 2025
- Market Size Value (USD Million) & Volume (Unit) Forecast By Market Taxonomy, 2026 to 2036
- By Country
- Brazil
- Mexico
- Chile
- Rest of Latin America
- By Rodder Type
- By Rod Diameter
- By Rod Length
- By Application
- By Sales Channel
- By Country
- Market Attractiveness Analysis
- By Country
- By Rodder Type
- By Rod Diameter
- By Rod Length
- By Application
- By Sales Channel
- Key Takeaways
- Western Europe Market Analysis and Forecast, By Country
- Historical Market Size Value (USD Million) & Volume (Unit) Trend Analysis By Market Taxonomy, 2021 to 2025
- Market Size Value (USD Million) & Volume (Unit) Forecast By Market Taxonomy, 2026 to 2036
- By Country
- Germany
- UK
- Italy
- Spain
- France
- Nordic
- BENELUX
- Rest of Western Europe
- By Rodder Type
- By Rod Diameter
- By Rod Length
- By Application
- By Sales Channel
- By Country
- Market Attractiveness Analysis
- By Country
- By Rodder Type
- By Rod Diameter
- By Rod Length
- By Application
- By Sales Channel
- Key Takeaways
- Eastern Europe Market Analysis and Forecast, By Country
- Historical Market Size Value (USD Million) & Volume (Unit) Trend Analysis By Market Taxonomy, 2021 to 2025
- Market Size Value (USD Million) & Volume (Unit) Forecast By Market Taxonomy, 2026 to 2036
- By Country
- Russia
- Poland
- Hungary
- Balkan & Baltic
- Rest of Eastern Europe
- By Rodder Type
- By Rod Diameter
- By Rod Length
- By Application
- By Sales Channel
- By Country
- Market Attractiveness Analysis
- By Country
- By Rodder Type
- By Rod Diameter
- By Rod Length
- By Application
- By Sales Channel
- Key Takeaways
- East Asia Market Analysis and Forecast, By Country
- Historical Market Size Value (USD Million) & Volume (Unit) Trend Analysis By Market Taxonomy, 2021 to 2025
- Market Size Value (USD Million) & Volume (Unit) Forecast By Market Taxonomy, 2026 to 2036
- By Country
- China
- Japan
- South Korea
- By Rodder Type
- By Rod Diameter
- By Rod Length
- By Application
- By Sales Channel
- By Country
- Market Attractiveness Analysis
- By Country
- By Rodder Type
- By Rod Diameter
- By Rod Length
- By Application
- By Sales Channel
- Key Takeaways
- South Asia and Pacific Market Analysis and Forecast, By Country
- Historical Market Size Value (USD Million) & Volume (Unit) Trend Analysis By Market Taxonomy, 2021 to 2025
- Market Size Value (USD Million) & Volume (Unit) Forecast By Market Taxonomy, 2026 to 2036
- By Country
- India
- ASEAN
- Australia & New Zealand
- Rest of South Asia and Pacific
- By Rodder Type
- By Rod Diameter
- By Rod Length
- By Application
- By Sales Channel
- By Country
- Market Attractiveness Analysis
- By Country
- By Rodder Type
- By Rod Diameter
- By Rod Length
- By Application
- By Sales Channel
- Key Takeaways
- Middle East & Africa Market Analysis and Forecast, By Country
- Historical Market Size Value (USD Million) & Volume (Unit) Trend Analysis By Market Taxonomy, 2021 to 2025
- Market Size Value (USD Million) & Volume (Unit) Forecast By Market Taxonomy, 2026 to 2036
- By Country
- Kingdom of Saudi Arabia
- Other GCC Countries
- Türkiye
- South Africa
- Other African Union
- Rest of Middle East & Africa
- By Rodder Type
- By Rod Diameter
- By Rod Length
- By Application
- By Sales Channel
- By Country
- Market Attractiveness Analysis
- By Country
- By Rodder Type
- By Rod Diameter
- By Rod Length
- By Application
- By Sales Channel
- Key Takeaways
- Key Countries Market Analysis
- USA
- Pricing Analysis
- Market Share Analysis, 2025
- By Rodder Type
- By Rod Diameter
- By Rod Length
- By Application
- By Sales Channel
- Canada
- Pricing Analysis
- Market Share Analysis, 2025
- By Rodder Type
- By Rod Diameter
- By Rod Length
- By Application
- By Sales Channel
- Mexico
- Pricing Analysis
- Market Share Analysis, 2025
- By Rodder Type
- By Rod Diameter
- By Rod Length
- By Application
- By Sales Channel
- Brazil
- Pricing Analysis
- Market Share Analysis, 2025
- By Rodder Type
- By Rod Diameter
- By Rod Length
- By Application
- By Sales Channel
- Chile
- Pricing Analysis
- Market Share Analysis, 2025
- By Rodder Type
- By Rod Diameter
- By Rod Length
- By Application
- By Sales Channel
- Germany
- Pricing Analysis
- Market Share Analysis, 2025
- By Rodder Type
- By Rod Diameter
- By Rod Length
- By Application
- By Sales Channel
- UK
- Pricing Analysis
- Market Share Analysis, 2025
- By Rodder Type
- By Rod Diameter
- By Rod Length
- By Application
- By Sales Channel
- Italy
- Pricing Analysis
- Market Share Analysis, 2025
- By Rodder Type
- By Rod Diameter
- By Rod Length
- By Application
- By Sales Channel
- Spain
- Pricing Analysis
- Market Share Analysis, 2025
- By Rodder Type
- By Rod Diameter
- By Rod Length
- By Application
- By Sales Channel
- France
- Pricing Analysis
- Market Share Analysis, 2025
- By Rodder Type
- By Rod Diameter
- By Rod Length
- By Application
- By Sales Channel
- India
- Pricing Analysis
- Market Share Analysis, 2025
- By Rodder Type
- By Rod Diameter
- By Rod Length
- By Application
- By Sales Channel
- ASEAN
- Pricing Analysis
- Market Share Analysis, 2025
- By Rodder Type
- By Rod Diameter
- By Rod Length
- By Application
- By Sales Channel
- Australia & New Zealand
- Pricing Analysis
- Market Share Analysis, 2025
- By Rodder Type
- By Rod Diameter
- By Rod Length
- By Application
- By Sales Channel
- China
- Pricing Analysis
- Market Share Analysis, 2025
- By Rodder Type
- By Rod Diameter
- By Rod Length
- By Application
- By Sales Channel
- Japan
- Pricing Analysis
- Market Share Analysis, 2025
- By Rodder Type
- By Rod Diameter
- By Rod Length
- By Application
- By Sales Channel
- South Korea
- Pricing Analysis
- Market Share Analysis, 2025
- By Rodder Type
- By Rod Diameter
- By Rod Length
- By Application
- By Sales Channel
- Russia
- Pricing Analysis
- Market Share Analysis, 2025
- By Rodder Type
- By Rod Diameter
- By Rod Length
- By Application
- By Sales Channel
- Poland
- Pricing Analysis
- Market Share Analysis, 2025
- By Rodder Type
- By Rod Diameter
- By Rod Length
- By Application
- By Sales Channel
- Hungary
- Pricing Analysis
- Market Share Analysis, 2025
- By Rodder Type
- By Rod Diameter
- By Rod Length
- By Application
- By Sales Channel
- Kingdom of Saudi Arabia
- Pricing Analysis
- Market Share Analysis, 2025
- By Rodder Type
- By Rod Diameter
- By Rod Length
- By Application
- By Sales Channel
- Türkiye
- Pricing Analysis
- Market Share Analysis, 2025
- By Rodder Type
- By Rod Diameter
- By Rod Length
- By Application
- By Sales Channel
- South Africa
- Pricing Analysis
- Market Share Analysis, 2025
- By Rodder Type
- By Rod Diameter
- By Rod Length
- By Application
- By Sales Channel
- USA
- Market Structure Analysis
- Competition Dashboard
- Competition Benchmarking
- Market Share Analysis of Top Players
- By Regional
- By Rodder Type
- By Rod Diameter
- By Rod Length
- By Application
- By Sales Channel
- Emerging Startups
- Innovation Benchmarking
- Competition Analysis
- Competition Deep Dive
- Condux International
- Overview
- Product Portfolio
- Profitability by Market Segments
- Sales Footprint
- Strategy Overview
- Marketing Strategy
- Product Strategy
- Channel Strategy
- GMP Tools
- Katimex
- Jameson
- Greenlee
- Southwire
- Runpotec
- C.Scope
- WCT Products
- Cobra Rod
- Condux International
- Case Studies
- Success Stories
- Recent Developments
- Competition Deep Dive
- Assumptions & Acronyms Used


