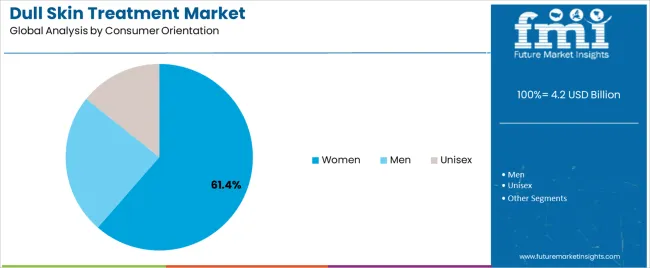
Dull Skin Treatment Market Size and Share Forecast Outlook From 2024 to 2034

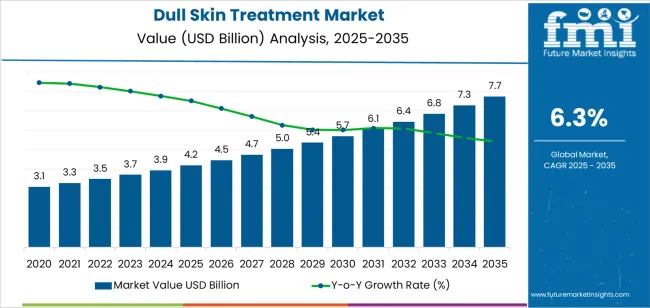
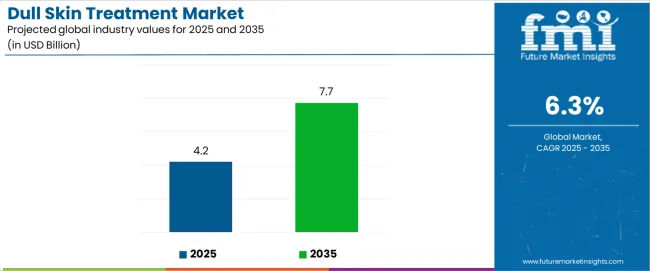
The Dull Skin Treatment market is expected to boom at a CAGR of 6.3% during the projected period. The market value is projected to increase from USD 3,949 million in 2024 to USD 7,247 million by 2034.

Attributes Details
Estimated Market Size, 2024 USD 3,949 million
Forecasted Market Size, 2034 USD 7,247 million
Projected Value CAGR (2024 to 2034) 6.3%

Top Dynamics and Industry Trends Shaping the Dull Skin Treatment Market

  • The significant increase in individuals adopting sedentary lifestyles is contributing to various health issues, notably dull skin. This shift in lifestyle is associated with a range of health concerns, and dull skin is among the notable effects.
  • Reduced sunlight exposure from indoor lifestyles contributes to skin dullness. This has led to a heightened demand for skincare products that rejuvenate and brighten the skin.
  • Rising concerns regarding environmental pollution, with harmful pollutants in the air causing skin damage and dullness, drive a growing demand for products that can help protect the skin from environmental damage and restore its natural glow.
  • The aging population is a key driver of the dull skin treatment market, as skin undergoes changes with age. The market is witnessing a demand for anti-aging skincare products that brighten and rejuvenate.

Lucrative Opportunities Transforming the Dull Skin Treatment Market

  • There is a growing trend toward natural skincare products, driving the growth of the organic dull skin treatment market as consumers prioritize chemical-free options with gentle, natural ingredients. Consequently, market players have the opportunity to develop multiple natural and organic skincare products specifically designed to address skin concerns.
  • Rise of eCommerce has made it easier for consumers to access skincare products. Online sales of skincare products have been growing at a rapid pace, and businesses can leverage this trend to reach a wider consumer base. Developing a strong online presence and investing in digital marketing are expected to help businesses capture a larger share of the market.
  • There is a growing interest in personalized skincare solutions. Consumers are looking for products tailored to their specific skin concerns and needs. Businesses can capitalize on this trend by offering personalized solutions that cater to individual skin types and concerns.
  • Demand for innovative skincare solutions that offer quick and effective results is on the rise. Consumers are willing to pay a premium for products that deliver visible improvements in their skin health and appearance. Developing innovative products that offer quick and effective results can help businesses differentiate themselves in the market and drive growth.

Factors Restraining the Demand for Dull Skin Treatment Products

  • There exists a demand for products that ensure both effectiveness and safety for consumers. With consumers growing more conscious of the potential risks tied to specific ingredients, brands are compelled to innovate and formulate products that are free from harmful chemicals and other toxins.
  • Developing effective products requires careful research and development, as well as testing and monitoring to ensure that products meet the highest standards of safety and efficacy. This increases capital expenditure and may limit market expansion.
  • There is a rising need to stay ahead of the latest trends and innovations. With new products and technologies constantly emerging, it becomes difficult for brands sometimes to stay up-to-date and maintain a competitive edge.
  • The market shifts with consumer preferences. For instance, as interest grows in natural and organic products, brands must adjust their offerings accordingly. This necessitates a deep understanding of consumer preferences and investments in product development and marketing.

Dull Skin Treatment Industry Analysis by Top Investment Segments

In terms of Product Type, the Exfoliators Segment Leads the Market Growth

Attributes Details
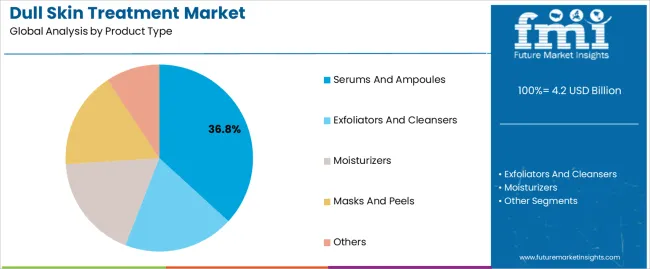
Product Type Exfoliators
Market Share in 2024 30.5%
  • Exfoliators are currently generating significant revenue in the dull skin treatment market due to their effectiveness in removing dead skin cells and revealing brighter, smoother skin.
  • Consumers are increasingly seeking products that provide immediate results, and exfoliators fit the bill by offering instant gratification in the form of brighter, more radiant skin.
  • Exfoliators are relatively easy to use and do not require a lot of time or effort, making them a convenient option for busy consumers.
  • Increased consumer awareness about the importance of exfoliation in maintaining healthy skin is leading to growing demand for exfoliating products and an influx of new brands and products in the market

In terms of Distribution Channel, the Offline Store Segment is dominating the Market

Attributes Details
Distribution Channel Offline Store
Market Share in 2024 57.5%
  • Customers, especially those experiencing skin problems such as dullness, blemishes, and uneven skin tone for the first time, prefer to purchase products from offline stores where they can receive guidance from sales associates.
  • Offline stores are more prevalent in emerging markets where online shopping is less common. They have a greater presence and are more accessible to customers compared to online stores.
  • In countries with large populations and a growing middle class, where individuals are willing to invest in skincare products, preference is given to purchasing from offline stores, regardless of whether discounts are offered.
  • The skincare industry is heavily influenced by trends and fads. Offline stores are better equipped to keep up with these trends and stock the latest products. They also have the advantage of being able to quickly adapt to changing customer preferences and introduce new product lines.

Analysis of Top Countries Formulating, Certifying, Distributing, and Using Dull Skin Treatment Solutions

Countries Forecasted CAGR from 2024 to 2034
United States 4.5%
United Kingdom 8.0%
China 9.4%
Japan 10.8%
Australia 7.2%

Growing Aging Population in the United States Sparks Skin Treatments’ Demand
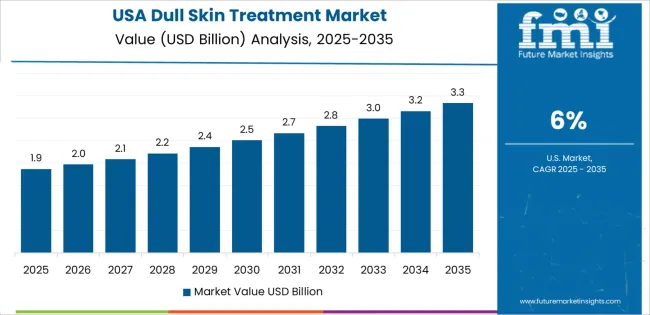
  • The demand for dull skin treatment in the United States has been growing rapidly over the past several years due to the increasing awareness among consumers about the benefits of maintaining healthy skin.
  • Consumers are now more conscious of their skin health than ever before, and they are willing to spend money on products and services that can help them achieve a healthy and radiant complexion.
  • The growing aging population in the United States contributes to this trend. As people get older, their skin tends to become dull and lose its natural glow, leading to an increase in demand for anti-aging products and services that can help rejuvenate the skin and restore its youthful appearance.
  • The United States has a highly developed healthcare industry, enabling the development of advanced skincare technologies and treatments. These advancements lead to numerous treatment options for consumers.

The United Kingdom’s Highly Competitive Skincare Landscape Positively Impacts the Market

  • There is an increasing demand for medical and healthcare products in the United Kingdom, driven by consumers' desire to maintain a youthful and healthy appearance. With the rise of social media and celebrity culture, there is now more pressure than ever before to look good and maintain a flawless complexion.
  • The United Kingdom boasts a highly competitive skincare market, which has spurred the development of innovative and effective skincare products and treatments. Consumers have access to a wide range of skincare products, including natural and organic options, as well as advanced treatments like chemical peels, dermabrasion, and laser therapy, among others.

China’s Access to a Wide Range of Skincare Options Fuels Market Growth

  • Growing awareness about the harmful effects of pollution on the skin has also contributed to this trend. As air pollution levels continue to rise in many parts of the country, consumers are increasingly seeking products and services that can help protect their skin from pollution damage.
  • Consumers in China have access to a wide range of skincare options, including traditional remedies, as well as advanced treatments like chemical peels, laser therapy, and microneedling.

Increasing Interest in Cosmetics in Japan Surges the Adoption of Skin Treatments
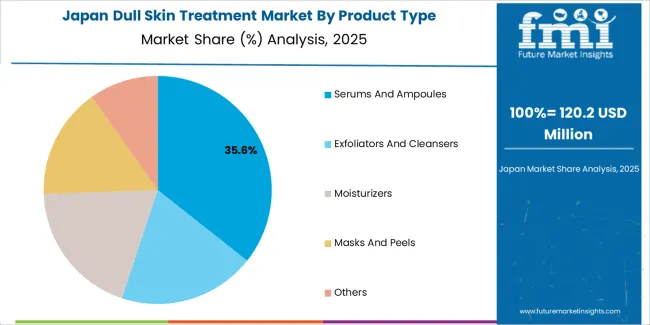
  • There is an increasing interest in beauty and cosmetics among consumers. Consumers in this country are known for their high standards when it comes to beauty, and they are willing to invest in products and treatments that can help them achieve a flawless complexion.
  • Japan’s skincare market is highly developed, leading to the development of advanced skincare technologies and treatments. Consumers here have access to a wide range of skincare products and treatments, including traditional Japanese remedies, as well as innovative treatments like facial massage and lymphatic drainage.

Growing Health Consciousness in Australia Sparks Demand for Skin Treatments

  • Australia has a harsh climate in many parts of the country. With a hot and dry climate, Australia's weather can significantly impact skin health. This, in turn, has led to an increase in demand for products and treatments that can help protect the skin from sun damage and other environmental factors.
  • Individuals in this country are highly health-conscious, leading to an increase in demand for skincare products and services that are natural, organic, and free from harmful chemicals. This trend has given rise to a growing market for natural and organic skincare products, which are seen as safer and more environmentally friendly than traditional skincare products.

Key Dull Skin Treatment Market Players and Concentration

The dull skin treatment market is highly fragmented, with numerous players vying for a share of the market. Key players are focusing on product innovation, strategic collaborations, mergers and acquisitions, and aggressive marketing to expand their market presence and gain a competitive edge. Additionally, companies are also concentrating on expanding their distribution channels to increase their market reach.

However, the market is facing intense competition from new entrants that offer innovative and affordable products. These new entrants leverage social media platforms to promote their products and gain market share.

Recent Development

  • In 2023, Vaseline launched its latest range of skincare products that specifically target the needs of individuals with dull skin. This premium line has been designed with unique formulations that help rejuvenate and brighten dull skin, leaving it looking radiant and healthy. With this new range, Vaseline aims to help individuals with dull skin achieve a more vibrant and youthful complexion.
  • In 2022, mCaffeine, a well-known skincare brand, expanded its product portfolio by launching a new 2-in-1 toner serum specifically designed to address the needs of individuals with dull skin. This innovative product combines the benefits of a toner and serum into a single formula, providing users with a comprehensive skincare solution that helps rejuvenate and brighten the skin.

Leading Suppliers of Dull Skin Treatment Products
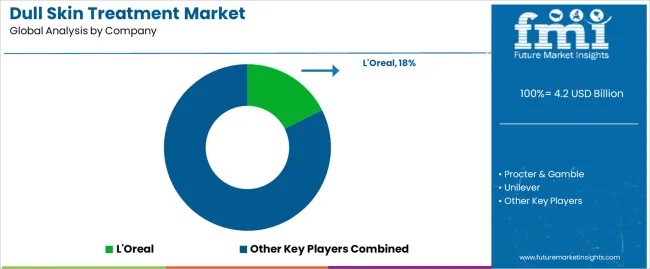
  • L'Oreal
  • Procter & Gamble
  • Unilever
  • Estee Lauder
  • Shiseido
  • Johnson & Johnson
  • Beiersdorf AG
  • Avon Products, Inc.
  • Revlon, Inc.
  • Kao Corporation

Key Shifting Preferences Covered in Dull Skin Treatment Market Report

  • Skin Pigmentation Treatment Market Report
  • In-depth Dull Skin Treatment Analysis with Available Opportunities
  • Skin Glow Enhancement Market Sales Assessment
  • Detailed Skin Brightening Overview in Different Regions
  • Skin Dullness Correction Treatment Pricing Outlook

Top Segments Studied in the Dull Skin Treatment Market Report

By Product Type:

  • Exfoliators and Cleansers
  • Serums and Ampoules
  • Moisturizers
  • Masks and Peels
  • Others

By Skin Type:

  • Dry Skin
  • Oily Skin
  • Normal Skin
  • Combination Skin

By Consumer Orientation:

  • Women
  • Men
  • Unisex

By Distribution Channel:

  • Offline Stores
  • Modern Trade
  • Departmental Stores
  • Convenience Stores
  • Specialty Stores

By Mono Brand Store:

  • Other Sales Channel
  • Online Retailers
  • Direct to Consumer
  • Third-party to Consumer

By Region:

  • North America
  • Latin America
  • East Asia
  • South Asia
  • Europe
  • Oceania
  • MEA

Table of Content

  • 1. Executive Summary
  • 2. Market Overview
  • 3. Market Background
  • 4. Global Market Analysis 2019 to 2023 and Forecast, 2024 to 2034
  • 5. Global Market Analysis 2019 to 2023 and Forecast 2024 to 2034, By Product Type
    • 5.1. Exfoliators & Cleansers
    • 5.2. Serums and Ampoules
    • 5.3. Moisturizers
    • 5.4. Masks and Peels
    • 5.5. Others
  • 6. Global Market Analysis 2019 to 2023 and Forecast 2024 to 2034, By Skin Type
    • 6.1. Dry Skin
    • 6.2. Oily Skin
    • 6.3. Normal Skin
    • 6.4. Combination Skin
  • 7. Global Market Analysis 2019 to 2023 and Forecast 2024 to 2034, By Consumer Orientation
    • 7.1. Women
    • 7.2. Men
    • 7.3. Unisex
  • 8. Global Market Analysis 2019 to 2023 and Forecast 2024 to 2034, By Distribution Channel
    • 8.1. Offline Stores
      • 8.1.1. Modern Trade
      • 8.1.2. Departmental Stores
      • 8.1.3. Convenience Stores
      • 8.1.4. Specialty Stores
      • 8.1.5. Mono Brand Store
      • 8.1.6. Other Sales Channel
    • 8.2. Online Retailers
      • 8.2.1. Direct to Consumer
      • 8.2.2. Third-party to Consumer
  • 9. Global Market Analysis 2019 to 2023 and Forecast 2024 to 2034, By Region
    • 9.1. North America
    • 9.2. Latin America
    • 9.3. Western Europe
    • 9.4. Eastern Europe
    • 9.5. South Asia and Pacific
    • 9.6. East Asia
    • 9.7. Middle East and Africa
  • 10. North America Market Analysis 2019 to 2023 and Forecast 2024 to 2034, By Country
  • 11. Latin America Market Analysis 2019 to 2023 and Forecast 2024 to 2034, By Country
  • 12. Western Europe Market Analysis 2019 to 2023 and Forecast 2024 to 2034, By Country
  • 13. Eastern Europe Market Analysis 2019 to 2023 and Forecast 2024 to 2034, By Country
  • 14. South Asia and Pacific Market Analysis 2019 to 2023 and Forecast 2024 to 2034, By Country
  • 15. East Asia Market Analysis 2019 to 2023 and Forecast 2024 to 2034, By Country
  • 16. Middle East and Africa Market Analysis 2019 to 2023 and Forecast 2024 to 2034, By Country
  • 17. Key Countries Market Analysis
  • 18. Market Structure Analysis
  • 19. Competition Analysis
    • 19.1. The Procter & Gamble Company
    • 19.2. Estée Lauder Companies Inc.
    • 19.3. Clarins Group
    • 19.4. Johnson & Johnson
    • 19.5. Shiseido Company, Limited
    • 19.6. Beiersdorf AG
    • 19.7. Revlon, Inc.
    • 19.8. Avon Products, Inc.
    • 19.9. Amorepacific Corporation
    • 19.10. Kao Corporation
  • 20. Assumptions & Acronyms Used
  • 21. Research Methodology

List of Tables

Table 1: Global Market Value (US$ Million) Forecast by Region, 2019 to 2034

Table 2: Global Market Volume (Unit Pack) Forecast by Region, 2019 to 2034

Table 3: Global Market Value (US$ Million) Forecast by Product Type, 2019 to 2034

Table 4: Global Market Volume (Unit Pack) Forecast by Product Type, 2019 to 2034

Table 5: Global Market Value (US$ Million) Forecast by Skin Type, 2019 to 2034

Table 6: Global Market Volume (Unit Pack) Forecast by Skin Type, 2019 to 2034

Table 7: Global Market Value (US$ Million) Forecast by Consumer Orientation, 2019 to 2034

Table 8: Global Market Volume (Unit Pack) Forecast by Consumer Orientation, 2019 to 2034

Table 9: Global Market Value (US$ Million) Forecast by Distribution Channel, 2019 to 2034

Table 10: Global Market Volume (Unit Pack) Forecast by Distribution Channel, 2019 to 2034

Table 11: North America Market Value (US$ Million) Forecast by Country, 2019 to 2034

Table 12: North America Market Volume (Unit Pack) Forecast by Country, 2019 to 2034

Table 13: North America Market Value (US$ Million) Forecast by Product Type, 2019 to 2034

Table 14: North America Market Volume (Unit Pack) Forecast by Product Type, 2019 to 2034

Table 15: North America Market Value (US$ Million) Forecast by Skin Type, 2019 to 2034

Table 16: North America Market Volume (Unit Pack) Forecast by Skin Type, 2019 to 2034

Table 17: North America Market Value (US$ Million) Forecast by Consumer Orientation, 2019 to 2034

Table 18: North America Market Volume (Unit Pack) Forecast by Consumer Orientation, 2019 to 2034

Table 19: North America Market Value (US$ Million) Forecast by Distribution Channel, 2019 to 2034

Table 20: North America Market Volume (Unit Pack) Forecast by Distribution Channel, 2019 to 2034

Table 21: Latin America Market Value (US$ Million) Forecast by Country, 2019 to 2034

Table 22: Latin America Market Volume (Unit Pack) Forecast by Country, 2019 to 2034

Table 23: Latin America Market Value (US$ Million) Forecast by Product Type, 2019 to 2034

Table 24: Latin America Market Volume (Unit Pack) Forecast by Product Type, 2019 to 2034

Table 25: Latin America Market Value (US$ Million) Forecast by Skin Type, 2019 to 2034

Table 26: Latin America Market Volume (Unit Pack) Forecast by Skin Type, 2019 to 2034

Table 27: Latin America Market Value (US$ Million) Forecast by Consumer Orientation, 2019 to 2034

Table 28: Latin America Market Volume (Unit Pack) Forecast by Consumer Orientation, 2019 to 2034

Table 29: Latin America Market Value (US$ Million) Forecast by Distribution Channel, 2019 to 2034

Table 30: Latin America Market Volume (Unit Pack) Forecast by Distribution Channel, 2019 to 2034

Table 31: Western Europe Market Value (US$ Million) Forecast by Country, 2019 to 2034

Table 32: Western Europe Market Volume (Unit Pack) Forecast by Country, 2019 to 2034

Table 33: Western Europe Market Value (US$ Million) Forecast by Product Type, 2019 to 2034

Table 34: Western Europe Market Volume (Unit Pack) Forecast by Product Type, 2019 to 2034

Table 35: Western Europe Market Value (US$ Million) Forecast by Skin Type, 2019 to 2034

Table 36: Western Europe Market Volume (Unit Pack) Forecast by Skin Type, 2019 to 2034

Table 37: Western Europe Market Value (US$ Million) Forecast by Consumer Orientation, 2019 to 2034

Table 38: Western Europe Market Volume (Unit Pack) Forecast by Consumer Orientation, 2019 to 2034

Table 39: Western Europe Market Value (US$ Million) Forecast by Distribution Channel, 2019 to 2034

Table 40: Western Europe Market Volume (Unit Pack) Forecast by Distribution Channel, 2019 to 2034

Table 41: Eastern Europe Market Value (US$ Million) Forecast by Country, 2019 to 2034

Table 42: Eastern Europe Market Volume (Unit Pack) Forecast by Country, 2019 to 2034

Table 43: Eastern Europe Market Value (US$ Million) Forecast by Product Type, 2019 to 2034

Table 44: Eastern Europe Market Volume (Unit Pack) Forecast by Product Type, 2019 to 2034

Table 45: Eastern Europe Market Value (US$ Million) Forecast by Skin Type, 2019 to 2034

Table 46: Eastern Europe Market Volume (Unit Pack) Forecast by Skin Type, 2019 to 2034

Table 47: Eastern Europe Market Value (US$ Million) Forecast by Consumer Orientation, 2019 to 2034

Table 48: Eastern Europe Market Volume (Unit Pack) Forecast by Consumer Orientation, 2019 to 2034

Table 49: Eastern Europe Market Value (US$ Million) Forecast by Distribution Channel, 2019 to 2034

Table 50: Eastern Europe Market Volume (Unit Pack) Forecast by Distribution Channel, 2019 to 2034

Table 51: South Asia and Pacific Market Value (US$ Million) Forecast by Country, 2019 to 2034

Table 52: South Asia and Pacific Market Volume (Unit Pack) Forecast by Country, 2019 to 2034

Table 53: South Asia and Pacific Market Value (US$ Million) Forecast by Product Type, 2019 to 2034

Table 54: South Asia and Pacific Market Volume (Unit Pack) Forecast by Product Type, 2019 to 2034

Table 55: South Asia and Pacific Market Value (US$ Million) Forecast by Skin Type, 2019 to 2034

Table 56: South Asia and Pacific Market Volume (Unit Pack) Forecast by Skin Type, 2019 to 2034

Table 57: South Asia and Pacific Market Value (US$ Million) Forecast by Consumer Orientation, 2019 to 2034

Table 58: South Asia and Pacific Market Volume (Unit Pack) Forecast by Consumer Orientation, 2019 to 2034

Table 59: South Asia and Pacific Market Value (US$ Million) Forecast by Distribution Channel, 2019 to 2034

Table 60: South Asia and Pacific Market Volume (Unit Pack) Forecast by Distribution Channel, 2019 to 2034

Table 61: East Asia Market Value (US$ Million) Forecast by Country, 2019 to 2034

Table 62: East Asia Market Volume (Unit Pack) Forecast by Country, 2019 to 2034

Table 63: East Asia Market Value (US$ Million) Forecast by Product Type, 2019 to 2034

Table 64: East Asia Market Volume (Unit Pack) Forecast by Product Type, 2019 to 2034

Table 65: East Asia Market Value (US$ Million) Forecast by Skin Type, 2019 to 2034

Table 66: East Asia Market Volume (Unit Pack) Forecast by Skin Type, 2019 to 2034

Table 67: East Asia Market Value (US$ Million) Forecast by Consumer Orientation, 2019 to 2034

Table 68: East Asia Market Volume (Unit Pack) Forecast by Consumer Orientation, 2019 to 2034

Table 69: East Asia Market Value (US$ Million) Forecast by Distribution Channel, 2019 to 2034

Table 70: East Asia Market Volume (Unit Pack) Forecast by Distribution Channel, 2019 to 2034

Table 71: Middle East and Africa Market Value (US$ Million) Forecast by Country, 2019 to 2034

Table 72: Middle East and Africa Market Volume (Unit Pack) Forecast by Country, 2019 to 2034

Table 73: Middle East and Africa Market Value (US$ Million) Forecast by Product Type, 2019 to 2034

Table 74: Middle East and Africa Market Volume (Unit Pack) Forecast by Product Type, 2019 to 2034

Table 75: Middle East and Africa Market Value (US$ Million) Forecast by Skin Type, 2019 to 2034

Table 76: Middle East and Africa Market Volume (Unit Pack) Forecast by Skin Type, 2019 to 2034

Table 77: Middle East and Africa Market Value (US$ Million) Forecast by Consumer Orientation, 2019 to 2034

Table 78: Middle East and Africa Market Volume (Unit Pack) Forecast by Consumer Orientation, 2019 to 2034

Table 79: Middle East and Africa Market Value (US$ Million) Forecast by Distribution Channel, 2019 to 2034

Table 80: Middle East and Africa Market Volume (Unit Pack) Forecast by Distribution Channel, 2019 to 2034

List of Figures

Figure 1: Global Market Value (US$ Million) by Product Type, 2024 to 2034

Figure 2: Global Market Value (US$ Million) by Skin Type, 2024 to 2034

Figure 3: Global Market Value (US$ Million) by Consumer Orientation, 2024 to 2034

Figure 4: Global Market Value (US$ Million) by Distribution Channel, 2024 to 2034

Figure 5: Global Market Value (US$ Million) by Region, 2024 to 2034

Figure 6: Global Market Value (US$ Million) Analysis by Region, 2019 to 2034

Figure 7: Global Market Volume (Unit Pack) Analysis by Region, 2019 to 2034

Figure 8: Global Market Value Share (%) and BPS Analysis by Region, 2024 to 2034

Figure 9: Global Market Y-o-Y Growth (%) Projections by Region, 2024 to 2034

Figure 10: Global Market Value (US$ Million) Analysis by Product Type, 2019 to 2034

Figure 11: Global Market Volume (Unit Pack) Analysis by Product Type, 2019 to 2034

Figure 12: Global Market Value Share (%) and BPS Analysis by Product Type, 2024 to 2034

Figure 13: Global Market Y-o-Y Growth (%) Projections by Product Type, 2024 to 2034

Figure 14: Global Market Value (US$ Million) Analysis by Skin Type, 2019 to 2034

Figure 15: Global Market Volume (Unit Pack) Analysis by Skin Type, 2019 to 2034

Figure 16: Global Market Value Share (%) and BPS Analysis by Skin Type, 2024 to 2034

Figure 17: Global Market Y-o-Y Growth (%) Projections by Skin Type, 2024 to 2034

Figure 18: Global Market Value (US$ Million) Analysis by Consumer Orientation, 2019 to 2034

Figure 19: Global Market Volume (Unit Pack) Analysis by Consumer Orientation, 2019 to 2034

Figure 20: Global Market Value Share (%) and BPS Analysis by Consumer Orientation, 2024 to 2034

Figure 21: Global Market Y-o-Y Growth (%) Projections by Consumer Orientation, 2024 to 2034

Figure 22: Global Market Value (US$ Million) Analysis by Distribution Channel, 2019 to 2034

Figure 23: Global Market Volume (Unit Pack) Analysis by Distribution Channel, 2019 to 2034

Figure 24: Global Market Value Share (%) and BPS Analysis by Distribution Channel, 2024 to 2034

Figure 25: Global Market Y-o-Y Growth (%) Projections by Distribution Channel, 2024 to 2034

Figure 26: Global Market Attractiveness by Product Type, 2024 to 2034

Figure 27: Global Market Attractiveness by Skin Type, 2024 to 2034

Figure 28: Global Market Attractiveness by Consumer Orientation, 2024 to 2034

Figure 29: Global Market Attractiveness by Distribution Channel, 2024 to 2034

Figure 30: Global Market Attractiveness by Region, 2024 to 2034

Figure 31: North America Market Value (US$ Million) by Product Type, 2024 to 2034

Figure 32: North America Market Value (US$ Million) by Skin Type, 2024 to 2034

Figure 33: North America Market Value (US$ Million) by Consumer Orientation, 2024 to 2034

Figure 34: North America Market Value (US$ Million) by Distribution Channel, 2024 to 2034

Figure 35: North America Market Value (US$ Million) by Country, 2024 to 2034

Figure 36: North America Market Value (US$ Million) Analysis by Country, 2019 to 2034

Figure 37: North America Market Volume (Unit Pack) Analysis by Country, 2019 to 2034

Figure 38: North America Market Value Share (%) and BPS Analysis by Country, 2024 to 2034

Figure 39: North America Market Y-o-Y Growth (%) Projections by Country, 2024 to 2034

Figure 40: North America Market Value (US$ Million) Analysis by Product Type, 2019 to 2034

Figure 41: North America Market Volume (Unit Pack) Analysis by Product Type, 2019 to 2034

Figure 42: North America Market Value Share (%) and BPS Analysis by Product Type, 2024 to 2034

Figure 43: North America Market Y-o-Y Growth (%) Projections by Product Type, 2024 to 2034

Figure 44: North America Market Value (US$ Million) Analysis by Skin Type, 2019 to 2034

Figure 45: North America Market Volume (Unit Pack) Analysis by Skin Type, 2019 to 2034

Figure 46: North America Market Value Share (%) and BPS Analysis by Skin Type, 2024 to 2034

Figure 47: North America Market Y-o-Y Growth (%) Projections by Skin Type, 2024 to 2034

Figure 48: North America Market Value (US$ Million) Analysis by Consumer Orientation, 2019 to 2034

Figure 49: North America Market Volume (Unit Pack) Analysis by Consumer Orientation, 2019 to 2034

Figure 50: North America Market Value Share (%) and BPS Analysis by Consumer Orientation, 2024 to 2034

Figure 51: North America Market Y-o-Y Growth (%) Projections by Consumer Orientation, 2024 to 2034

Figure 52: North America Market Value (US$ Million) Analysis by Distribution Channel, 2019 to 2034

Figure 53: North America Market Volume (Unit Pack) Analysis by Distribution Channel, 2019 to 2034

Figure 54: North America Market Value Share (%) and BPS Analysis by Distribution Channel, 2024 to 2034

Figure 55: North America Market Y-o-Y Growth (%) Projections by Distribution Channel, 2024 to 2034

Figure 56: North America Market Attractiveness by Product Type, 2024 to 2034

Figure 57: North America Market Attractiveness by Skin Type, 2024 to 2034

Figure 58: North America Market Attractiveness by Consumer Orientation, 2024 to 2034

Figure 59: North America Market Attractiveness by Distribution Channel, 2024 to 2034

Figure 60: North America Market Attractiveness by Country, 2024 to 2034

Figure 61: Latin America Market Value (US$ Million) by Product Type, 2024 to 2034

Figure 62: Latin America Market Value (US$ Million) by Skin Type, 2024 to 2034

Figure 63: Latin America Market Value (US$ Million) by Consumer Orientation, 2024 to 2034

Figure 64: Latin America Market Value (US$ Million) by Distribution Channel, 2024 to 2034

Figure 65: Latin America Market Value (US$ Million) by Country, 2024 to 2034

Figure 66: Latin America Market Value (US$ Million) Analysis by Country, 2019 to 2034

Figure 67: Latin America Market Volume (Unit Pack) Analysis by Country, 2019 to 2034

Figure 68: Latin America Market Value Share (%) and BPS Analysis by Country, 2024 to 2034

Figure 69: Latin America Market Y-o-Y Growth (%) Projections by Country, 2024 to 2034

Figure 70: Latin America Market Value (US$ Million) Analysis by Product Type, 2019 to 2034

Figure 71: Latin America Market Volume (Unit Pack) Analysis by Product Type, 2019 to 2034

Figure 72: Latin America Market Value Share (%) and BPS Analysis by Product Type, 2024 to 2034

Figure 73: Latin America Market Y-o-Y Growth (%) Projections by Product Type, 2024 to 2034

Figure 74: Latin America Market Value (US$ Million) Analysis by Skin Type, 2019 to 2034

Figure 75: Latin America Market Volume (Unit Pack) Analysis by Skin Type, 2019 to 2034

Figure 76: Latin America Market Value Share (%) and BPS Analysis by Skin Type, 2024 to 2034

Figure 77: Latin America Market Y-o-Y Growth (%) Projections by Skin Type, 2024 to 2034

Figure 78: Latin America Market Value (US$ Million) Analysis by Consumer Orientation, 2019 to 2034

Figure 79: Latin America Market Volume (Unit Pack) Analysis by Consumer Orientation, 2019 to 2034

Figure 80: Latin America Market Value Share (%) and BPS Analysis by Consumer Orientation, 2024 to 2034

Figure 81: Latin America Market Y-o-Y Growth (%) Projections by Consumer Orientation, 2024 to 2034

Figure 82: Latin America Market Value (US$ Million) Analysis by Distribution Channel, 2019 to 2034

Figure 83: Latin America Market Volume (Unit Pack) Analysis by Distribution Channel, 2019 to 2034

Figure 84: Latin America Market Value Share (%) and BPS Analysis by Distribution Channel, 2024 to 2034

Figure 85: Latin America Market Y-o-Y Growth (%) Projections by Distribution Channel, 2024 to 2034

Figure 86: Latin America Market Attractiveness by Product Type, 2024 to 2034

Figure 87: Latin America Market Attractiveness by Skin Type, 2024 to 2034

Figure 88: Latin America Market Attractiveness by Consumer Orientation, 2024 to 2034

Figure 89: Latin America Market Attractiveness by Distribution Channel, 2024 to 2034

Figure 90: Latin America Market Attractiveness by Country, 2024 to 2034

Figure 91: Western Europe Market Value (US$ Million) by Product Type, 2024 to 2034

Figure 92: Western Europe Market Value (US$ Million) by Skin Type, 2024 to 2034

Figure 93: Western Europe Market Value (US$ Million) by Consumer Orientation, 2024 to 2034

Figure 94: Western Europe Market Value (US$ Million) by Distribution Channel, 2024 to 2034

Figure 95: Western Europe Market Value (US$ Million) by Country, 2024 to 2034

Figure 96: Western Europe Market Value (US$ Million) Analysis by Country, 2019 to 2034

Figure 97: Western Europe Market Volume (Unit Pack) Analysis by Country, 2019 to 2034

Figure 98: Western Europe Market Value Share (%) and BPS Analysis by Country, 2024 to 2034

Figure 99: Western Europe Market Y-o-Y Growth (%) Projections by Country, 2024 to 2034

Figure 100: Western Europe Market Value (US$ Million) Analysis by Product Type, 2019 to 2034

Figure 101: Western Europe Market Volume (Unit Pack) Analysis by Product Type, 2019 to 2034

Figure 102: Western Europe Market Value Share (%) and BPS Analysis by Product Type, 2024 to 2034

Figure 103: Western Europe Market Y-o-Y Growth (%) Projections by Product Type, 2024 to 2034

Figure 104: Western Europe Market Value (US$ Million) Analysis by Skin Type, 2019 to 2034

Figure 105: Western Europe Market Volume (Unit Pack) Analysis by Skin Type, 2019 to 2034

Figure 106: Western Europe Market Value Share (%) and BPS Analysis by Skin Type, 2024 to 2034

Figure 107: Western Europe Market Y-o-Y Growth (%) Projections by Skin Type, 2024 to 2034

Figure 108: Western Europe Market Value (US$ Million) Analysis by Consumer Orientation, 2019 to 2034

Figure 109: Western Europe Market Volume (Unit Pack) Analysis by Consumer Orientation, 2019 to 2034

Figure 110: Western Europe Market Value Share (%) and BPS Analysis by Consumer Orientation, 2024 to 2034

Figure 111: Western Europe Market Y-o-Y Growth (%) Projections by Consumer Orientation, 2024 to 2034

Figure 112: Western Europe Market Value (US$ Million) Analysis by Distribution Channel, 2019 to 2034

Figure 113: Western Europe Market Volume (Unit Pack) Analysis by Distribution Channel, 2019 to 2034

Figure 114: Western Europe Market Value Share (%) and BPS Analysis by Distribution Channel, 2024 to 2034

Figure 115: Western Europe Market Y-o-Y Growth (%) Projections by Distribution Channel, 2024 to 2034

Figure 116: Western Europe Market Attractiveness by Product Type, 2024 to 2034

Figure 117: Western Europe Market Attractiveness by Skin Type, 2024 to 2034

Figure 118: Western Europe Market Attractiveness by Consumer Orientation, 2024 to 2034

Figure 119: Western Europe Market Attractiveness by Distribution Channel, 2024 to 2034

Figure 120: Western Europe Market Attractiveness by Country, 2024 to 2034

Figure 121: Eastern Europe Market Value (US$ Million) by Product Type, 2024 to 2034

Figure 122: Eastern Europe Market Value (US$ Million) by Skin Type, 2024 to 2034

Figure 123: Eastern Europe Market Value (US$ Million) by Consumer Orientation, 2024 to 2034

Figure 124: Eastern Europe Market Value (US$ Million) by Distribution Channel, 2024 to 2034

Figure 125: Eastern Europe Market Value (US$ Million) by Country, 2024 to 2034

Figure 126: Eastern Europe Market Value (US$ Million) Analysis by Country, 2019 to 2034

Figure 127: Eastern Europe Market Volume (Unit Pack) Analysis by Country, 2019 to 2034

Figure 128: Eastern Europe Market Value Share (%) and BPS Analysis by Country, 2024 to 2034

Figure 129: Eastern Europe Market Y-o-Y Growth (%) Projections by Country, 2024 to 2034

Figure 130: Eastern Europe Market Value (US$ Million) Analysis by Product Type, 2019 to 2034

Figure 131: Eastern Europe Market Volume (Unit Pack) Analysis by Product Type, 2019 to 2034

Figure 132: Eastern Europe Market Value Share (%) and BPS Analysis by Product Type, 2024 to 2034

Figure 133: Eastern Europe Market Y-o-Y Growth (%) Projections by Product Type, 2024 to 2034

Figure 134: Eastern Europe Market Value (US$ Million) Analysis by Skin Type, 2019 to 2034

Figure 135: Eastern Europe Market Volume (Unit Pack) Analysis by Skin Type, 2019 to 2034

Figure 136: Eastern Europe Market Value Share (%) and BPS Analysis by Skin Type, 2024 to 2034

Figure 137: Eastern Europe Market Y-o-Y Growth (%) Projections by Skin Type, 2024 to 2034

Figure 138: Eastern Europe Market Value (US$ Million) Analysis by Consumer Orientation, 2019 to 2034

Figure 139: Eastern Europe Market Volume (Unit Pack) Analysis by Consumer Orientation, 2019 to 2034

Figure 140: Eastern Europe Market Value Share (%) and BPS Analysis by Consumer Orientation, 2024 to 2034

Figure 141: Eastern Europe Market Y-o-Y Growth (%) Projections by Consumer Orientation, 2024 to 2034

Figure 142: Eastern Europe Market Value (US$ Million) Analysis by Distribution Channel, 2019 to 2034

Figure 143: Eastern Europe Market Volume (Unit Pack) Analysis by Distribution Channel, 2019 to 2034

Figure 144: Eastern Europe Market Value Share (%) and BPS Analysis by Distribution Channel, 2024 to 2034

Figure 145: Eastern Europe Market Y-o-Y Growth (%) Projections by Distribution Channel, 2024 to 2034

Figure 146: Eastern Europe Market Attractiveness by Product Type, 2024 to 2034

Figure 147: Eastern Europe Market Attractiveness by Skin Type, 2024 to 2034

Figure 148: Eastern Europe Market Attractiveness by Consumer Orientation, 2024 to 2034

Figure 149: Eastern Europe Market Attractiveness by Distribution Channel, 2024 to 2034

Figure 150: Eastern Europe Market Attractiveness by Country, 2024 to 2034

Figure 151: South Asia and Pacific Market Value (US$ Million) by Product Type, 2024 to 2034

Figure 152: South Asia and Pacific Market Value (US$ Million) by Skin Type, 2024 to 2034

Figure 153: South Asia and Pacific Market Value (US$ Million) by Consumer Orientation, 2024 to 2034

Figure 154: South Asia and Pacific Market Value (US$ Million) by Distribution Channel, 2024 to 2034

Figure 155: South Asia and Pacific Market Value (US$ Million) by Country, 2024 to 2034

Figure 156: South Asia and Pacific Market Value (US$ Million) Analysis by Country, 2019 to 2034

Figure 157: South Asia and Pacific Market Volume (Unit Pack) Analysis by Country, 2019 to 2034

Figure 158: South Asia and Pacific Market Value Share (%) and BPS Analysis by Country, 2024 to 2034

Figure 159: South Asia and Pacific Market Y-o-Y Growth (%) Projections by Country, 2024 to 2034

Figure 160: South Asia and Pacific Market Value (US$ Million) Analysis by Product Type, 2019 to 2034

Figure 161: South Asia and Pacific Market Volume (Unit Pack) Analysis by Product Type, 2019 to 2034

Figure 162: South Asia and Pacific Market Value Share (%) and BPS Analysis by Product Type, 2024 to 2034

Figure 163: South Asia and Pacific Market Y-o-Y Growth (%) Projections by Product Type, 2024 to 2034

Figure 164: South Asia and Pacific Market Value (US$ Million) Analysis by Skin Type, 2019 to 2034

Figure 165: South Asia and Pacific Market Volume (Unit Pack) Analysis by Skin Type, 2019 to 2034

Figure 166: South Asia and Pacific Market Value Share (%) and BPS Analysis by Skin Type, 2024 to 2034

Figure 167: South Asia and Pacific Market Y-o-Y Growth (%) Projections by Skin Type, 2024 to 2034

Figure 168: South Asia and Pacific Market Value (US$ Million) Analysis by Consumer Orientation, 2019 to 2034

Figure 169: South Asia and Pacific Market Volume (Unit Pack) Analysis by Consumer Orientation, 2019 to 2034

Figure 170: South Asia and Pacific Market Value Share (%) and BPS Analysis by Consumer Orientation, 2024 to 2034

Figure 171: South Asia and Pacific Market Y-o-Y Growth (%) Projections by Consumer Orientation, 2024 to 2034

Figure 172: South Asia and Pacific Market Value (US$ Million) Analysis by Distribution Channel, 2019 to 2034

Figure 173: South Asia and Pacific Market Volume (Unit Pack) Analysis by Distribution Channel, 2019 to 2034

Figure 174: South Asia and Pacific Market Value Share (%) and BPS Analysis by Distribution Channel, 2024 to 2034

Figure 175: South Asia and Pacific Market Y-o-Y Growth (%) Projections by Distribution Channel, 2024 to 2034

Figure 176: South Asia and Pacific Market Attractiveness by Product Type, 2024 to 2034

Figure 177: South Asia and Pacific Market Attractiveness by Skin Type, 2024 to 2034

Figure 178: South Asia and Pacific Market Attractiveness by Consumer Orientation, 2024 to 2034

Figure 179: South Asia and Pacific Market Attractiveness by Distribution Channel, 2024 to 2034

Figure 180: South Asia and Pacific Market Attractiveness by Country, 2024 to 2034

Figure 181: East Asia Market Value (US$ Million) by Product Type, 2024 to 2034

Figure 182: East Asia Market Value (US$ Million) by Skin Type, 2024 to 2034

Figure 183: East Asia Market Value (US$ Million) by Consumer Orientation, 2024 to 2034

Figure 184: East Asia Market Value (US$ Million) by Distribution Channel, 2024 to 2034

Figure 185: East Asia Market Value (US$ Million) by Country, 2024 to 2034

Figure 186: East Asia Market Value (US$ Million) Analysis by Country, 2019 to 2034

Figure 187: East Asia Market Volume (Unit Pack) Analysis by Country, 2019 to 2034

Figure 188: East Asia Market Value Share (%) and BPS Analysis by Country, 2024 to 2034

Figure 189: East Asia Market Y-o-Y Growth (%) Projections by Country, 2024 to 2034

Figure 190: East Asia Market Value (US$ Million) Analysis by Product Type, 2019 to 2034

Figure 191: East Asia Market Volume (Unit Pack) Analysis by Product Type, 2019 to 2034

Figure 192: East Asia Market Value Share (%) and BPS Analysis by Product Type, 2024 to 2034

Figure 193: East Asia Market Y-o-Y Growth (%) Projections by Product Type, 2024 to 2034

Figure 194: East Asia Market Value (US$ Million) Analysis by Skin Type, 2019 to 2034

Figure 195: East Asia Market Volume (Unit Pack) Analysis by Skin Type, 2019 to 2034

Figure 196: East Asia Market Value Share (%) and BPS Analysis by Skin Type, 2024 to 2034

Figure 197: East Asia Market Y-o-Y Growth (%) Projections by Skin Type, 2024 to 2034

Figure 198: East Asia Market Value (US$ Million) Analysis by Consumer Orientation, 2019 to 2034

Figure 199: East Asia Market Volume (Unit Pack) Analysis by Consumer Orientation, 2019 to 2034

Figure 200: East Asia Market Value Share (%) and BPS Analysis by Consumer Orientation, 2024 to 2034

Figure 201: East Asia Market Y-o-Y Growth (%) Projections by Consumer Orientation, 2024 to 2034

Figure 202: East Asia Market Value (US$ Million) Analysis by Distribution Channel, 2019 to 2034

Figure 203: East Asia Market Volume (Unit Pack) Analysis by Distribution Channel, 2019 to 2034

Figure 204: East Asia Market Value Share (%) and BPS Analysis by Distribution Channel, 2024 to 2034

Figure 205: East Asia Market Y-o-Y Growth (%) Projections by Distribution Channel, 2024 to 2034

Figure 206: East Asia Market Attractiveness by Product Type, 2024 to 2034

Figure 207: East Asia Market Attractiveness by Skin Type, 2024 to 2034

Figure 208: East Asia Market Attractiveness by Consumer Orientation, 2024 to 2034

Figure 209: East Asia Market Attractiveness by Distribution Channel, 2024 to 2034

Figure 210: East Asia Market Attractiveness by Country, 2024 to 2034

Figure 211: Middle East and Africa Market Value (US$ Million) by Product Type, 2024 to 2034

Figure 212: Middle East and Africa Market Value (US$ Million) by Skin Type, 2024 to 2034

Figure 213: Middle East and Africa Market Value (US$ Million) by Consumer Orientation, 2024 to 2034

Figure 214: Middle East and Africa Market Value (US$ Million) by Distribution Channel, 2024 to 2034

Figure 215: Middle East and Africa Market Value (US$ Million) by Country, 2024 to 2034

Figure 216: Middle East and Africa Market Value (US$ Million) Analysis by Country, 2019 to 2034

Figure 217: Middle East and Africa Market Volume (Unit Pack) Analysis by Country, 2019 to 2034

Figure 218: Middle East and Africa Market Value Share (%) and BPS Analysis by Country, 2024 to 2034

Figure 219: Middle East and Africa Market Y-o-Y Growth (%) Projections by Country, 2024 to 2034

Figure 220: Middle East and Africa Market Value (US$ Million) Analysis by Product Type, 2019 to 2034

Figure 221: Middle East and Africa Market Volume (Unit Pack) Analysis by Product Type, 2019 to 2034

Figure 222: Middle East and Africa Market Value Share (%) and BPS Analysis by Product Type, 2024 to 2034

Figure 223: Middle East and Africa Market Y-o-Y Growth (%) Projections by Product Type, 2024 to 2034

Figure 224: Middle East and Africa Market Value (US$ Million) Analysis by Skin Type, 2019 to 2034

Figure 225: Middle East and Africa Market Volume (Unit Pack) Analysis by Skin Type, 2019 to 2034

Figure 226: Middle East and Africa Market Value Share (%) and BPS Analysis by Skin Type, 2024 to 2034

Figure 227: Middle East and Africa Market Y-o-Y Growth (%) Projections by Skin Type, 2024 to 2034

Figure 228: Middle East and Africa Market Value (US$ Million) Analysis by Consumer Orientation, 2019 to 2034

Figure 229: Middle East and Africa Market Volume (Unit Pack) Analysis by Consumer Orientation, 2019 to 2034

Figure 230: Middle East and Africa Market Value Share (%) and BPS Analysis by Consumer Orientation, 2024 to 2034

Figure 231: Middle East and Africa Market Y-o-Y Growth (%) Projections by Consumer Orientation, 2024 to 2034

Figure 232: Middle East and Africa Market Value (US$ Million) Analysis by Distribution Channel, 2019 to 2034

Figure 233: Middle East and Africa Market Volume (Unit Pack) Analysis by Distribution Channel, 2019 to 2034

Figure 234: Middle East and Africa Market Value Share (%) and BPS Analysis by Distribution Channel, 2024 to 2034

Figure 235: Middle East and Africa Market Y-o-Y Growth (%) Projections by Distribution Channel, 2024 to 2034

Figure 236: Middle East and Africa Market Attractiveness by Product Type, 2024 to 2034

Figure 237: Middle East and Africa Market Attractiveness by Skin Type, 2024 to 2034

Figure 238: Middle East and Africa Market Attractiveness by Consumer Orientation, 2024 to 2034

Figure 239: Middle East and Africa Market Attractiveness by Distribution Channel, 2024 to 2034

Figure 240: Middle East and Africa Market Attractiveness by Country, 2024 to 2034

Frequently Asked Questions

How Big is the Dull Skin Treatment Market in 2024?

The market is currently valued at around USD 3,949 million in 2024.

Which Product Type Segment Contributes More to the Dull Skin Treatment Market?

Within the product type, the exfoliators segment is expected to hold a 30.5% market share in 2024.

What is Market Outlook of Dull Skin Treatment in the United States?

The United States is set to register 4.5% CAGR from 2024 to 2034.

What is the Projected Value for the Dull Skin Treatment Market by 2034?

The market is set to reach a valuation of around USD 7,247 million by 2034.

What Was the Historical CAGR for the Dull Skin Treatment Market?

Demand for dull skin treatment increased at a 4.9% CAGR from 2019 to 2023.

Explore Beauty & Wellness Insights

Future Market Insights

Dull Skin Treatment Market