

- Market Size (2026)
- USD 265.0 Mn
- Forecast (2036)
- USD 461.3 Mn
- CAGR (2026 to 2036)
- 5.7%
How big is the Egg Yolk Pigments Market in 2026?
USD 265.0 million in 2026 and USD 461.3 million by 2036 at a 5.7% CAGR.
Commercial egg producers are moving yolk shade control closer to feed procurement and premix qualification. FAO reported world eggs production at 100 Mt in 2024, which gives pigment suppliers a wider production base to serve. Large layer operations are expected to treat color stability as a feed quality issue. The shift is likely to favor suppliers that document pigment concentration and field response before procurement teams approve broader buying programs.
Feed mills and egg packers are expected to remain the core buyer groups for egg yolk pigments. Their purchase pressure comes from retail color expectations, grain variation, and batch-level quality records. Buyers gain from suppliers that connect carotenoid selection to mill handling and shade measurement. This link also keeps egg yolk pigments close to poultry feed formulations and feed additive planning.
Pigment value is expected to rise where source selection, dose control and field service work as one operating system. Mature markets are projected to emphasize documentation and supplier continuity. Higher-growth markets are likely to emphasize channel reach and faster trial conversion. Procurement teams are expected to favor partners that reduce formulation disputes before pigment decisions affect packer scorecards and animal feed demand.
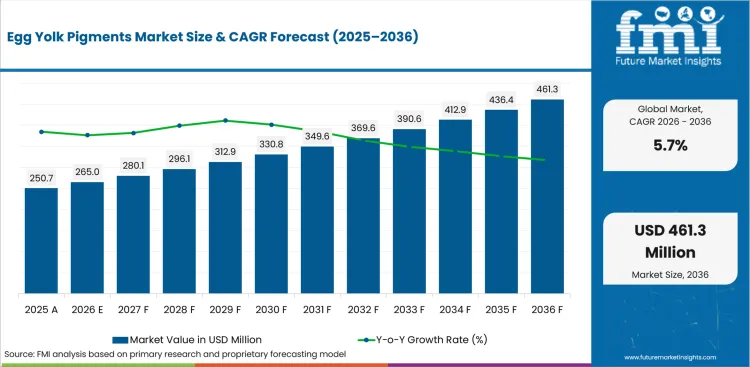
| Metric | Value |
|---|---|
| 2025 Market Size | USD 250.7 million |
| 2026 Market Size | USD 265.0 million |
| 2036 Market Size | USD 461.3 million |
| Forecast CAGR (2026-2036) | 5.7% |
| Form Focus | Dry |
| Dry Share (2026) | 37.5% |
| Source Focus | Microbial |
| Microbial Share (2026) | 35.0% |
| Livestock Focus | Poultry |
| Poultry Share (2026) | 37.5% |
| Fastest-growing Country | India |
| India CAGR by 2036 | 5.1% |
Summary of the Egg Yolk Pigments Market
| Market Signal | Commercial Impact |
| Demand and Growth Drivers | Growth is expected to be driven by layer producers using yolk color control as a feed-performance and retail specification tool. Another driver is the need for feed mills and premix suppliers to connect pigment dosage with flock response records and packing-line consistency.
|
| Product and Segment View | Dry formats, microbial sources, poultry use and yolk color enhancement lead their respective categories in 2026. Segment demand is supported by feed-mill handling needs, traceability review and measurable shade outcomes in layer diets.
|
| Geography and Growth Outlook | Asia is expected to remain a significant expansion base due to layer scale and commercial feed formulation intensity. North America and Europe are likely to grow through retailer specifications, additive documentation and shade-control programs
|
| Competitive Landscape | Competition is projected to focus on carotenoid chemistry, pigment stability and application support for commercial layer programs. Suppliers with stronger shade evidence and feed-mill guidance are expected to receive better buyer consideration.
|
| Analyst Perspective | The primary adoption factor is expected to be proof that pigment programs deliver consistent yolk shade across flock cycles. Suppliers are likely to retain accounts when they reduce shade disputes and support feed mills during diet changes.
- Nandini Roy Choudhury, Principal Consultant at Future Market Insights |
Source: FMI's proprietary forecasting model and primary research
How is the egg yolk pigments market segmented?
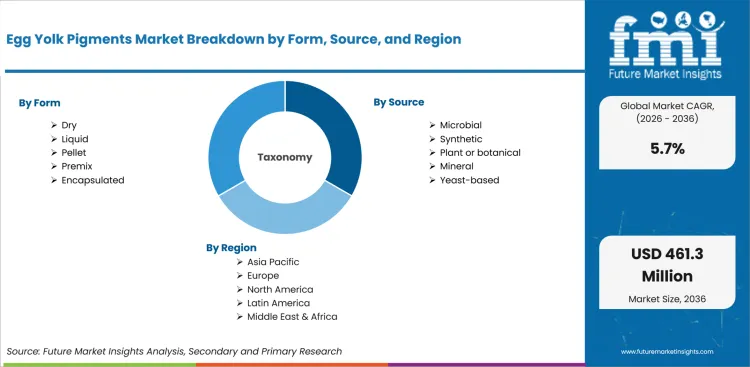
The egg yolk pigments market industry is segmented by form, source, livestock, function, and region.
The egg yolk pigments market is segmented by form, source, livestock, function, and region. By form, the market covers dry, liquid, pellet, premix, and encapsulated formats. By source, it covers synthetic, microbial, plant or botanical, mineral, and yeast-based inputs. By livestock, it covers poultry, broilers, layers, turkey, and other poultry. By function, it covers yolk color enhancement, feed color standardization, carotenoid enrichment, shade consistency, and natural pigment positioning. Regional coverage includes North America, Europe, East Asia, South Asia, and Latin America, supported by related demand in feed pigments sector.
How does dry shape demand within the form category?
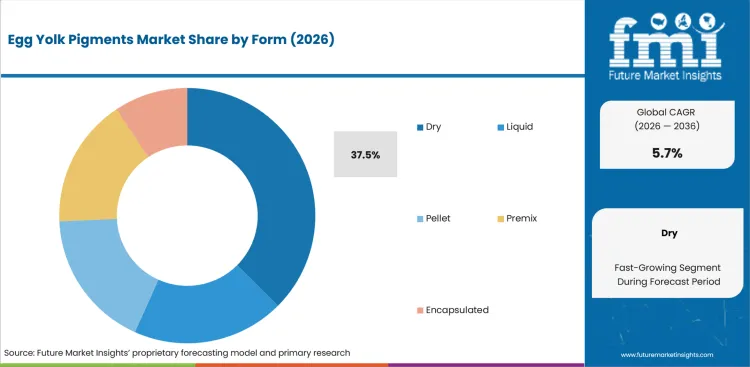
Form selection is expected to influence handling risk before a feed mill approves broader pigment use. Dry products carry procurement weight due to dosing familiarity and compatibility with existing premix operations. Kemin lists ORO GLO 50 Dry as a layer-use product, pointing to buyer interest in powder formats that support uniform color distribution. Suppliers need both concentration data and mill support before commercial layer accounts expand ordering.
- Dry is expected to account for 37.5% market share in 2026, supported by production familiarity and storage discipline. Kemin states that ORO GLO 50 Dry contains 50 g/kg xanthophyll activity, which gives buyers a clear specification basis for comparing dose and handling behavior.
- The executive case for dry centers on lower mill friction: buyers gain a familiar feed format that simplifies weighing, blending, and quality checks. Dry pigment programs also support feed premix programs decisions, which helps nutrition teams compare inclusion rates before larger account rollouts.
What supports demand for microbial source choices?
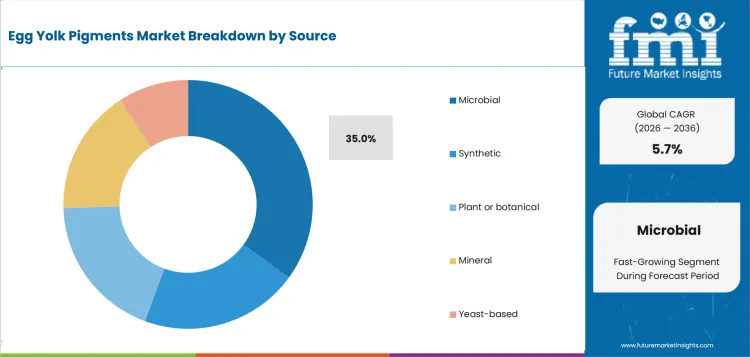
Source decisions are expected to shape trust before pigment inputs move into branded egg programs. Microbial options fit buyers that want a controlled production identity and a cleaner traceability story. Allied Biotech Corporation presents carotenoid products for egg yolk applications, signaling how supplier identity affects source review. Controlled source stories also overlap with algae based feed interest in alternative feed inputs. Procurement teams need batch records and application evidence before source changes move forward.
- Microbial is projected to represent 35.0% of the market in 2026, driven by traceability needs and carotenoid source identity. Allied Biotech Corporation lists beta-carotene and canthaxanthin product series for hens, linking microbial carotenoid portfolios to egg yolk shade programs.
- Brand and premix teams gain from microbial source choices due to clearer production records and supplier qualification pathways. The buying decision remains practical due to proof needs for pigment stability, application fit and compatibility with animal feed ingredients used across layer diets.
How do buyers evaluate poultry within the livestock category?
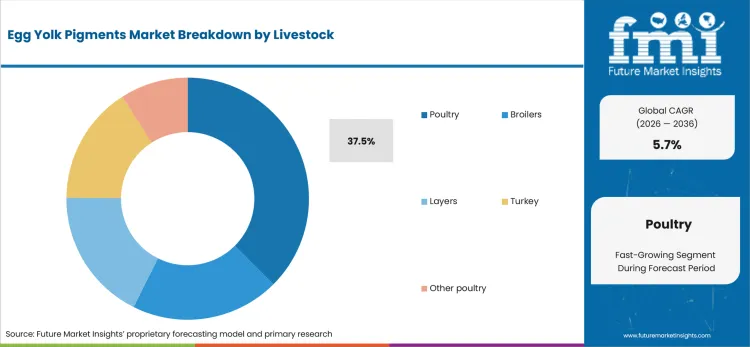
Livestock selection is expected to concentrate pigment demand around layer economics and packer expectations. Poultry buyers need a visible outcome that links feed inclusion to yolk appearance. dsm-firmenich describes CAROPHYLL red and yellow for consistent egg yolk color, showing why species-specific documentation guides purchase review. Layer programs require application service before the buyer accepts switching risk.
- Poultry is anticipated to hold 37.5% share in 2026, attributable to layer programs that connect yolk shade to retail expectations. For example, dsm-firmenich describes CAROPHYLL products for egg yolk color, which supports buyer review of carotenoid choice and response consistency.
- For layer integrators, poultry pigment use reduces rejection risk due to uneven shade response and supplier switching. The segment links formulation work to commercial egg packer scorecards, which keeps pigment decisions near compound feed production and technical service planning.
How is yolk color enhancement positioned within function decisions?
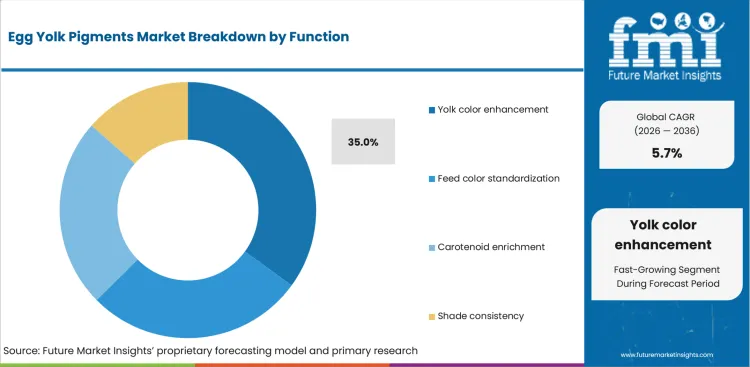
Function selection is expected to influence claims review and trial design more than broad feed additive positioning. Yolk color enhancement creates a narrow promise that must fit shade cards and flock records. EW Nutrition reported field validation in Spain using 57000 hens, showing how commercial trials shape confidence. Evidence language is therefore becoming a higher review hurdle for pigment launches.
- Yolk color enhancement is estimated to reach 35.0% share in 2026, due to commercial layer buyers that measure shade response against customer targets. EW Nutrition reported a 57000-hen field validation in Spain, which explains why buyers ask for application proof before switching inputs.
- For nutrition managers, yolk color enhancement reduces launch ambiguity by tying pigment use to a visible customer outcome. The segment raises evidence work due to source comparison and dose stability needs. Internal reviewers are expected to require those files before approving lutein products and carotenoid blends.
What are the drivers, restraints, and opportunities in the egg yolk pigments market?
Near-term purchases are being shaped by shade consistency, trial burden, and natural pigment expansion outlined below.
- Driver: Retail color expectations are expected to push spending toward pigment programs that support repeatable yolk shade across layer flocks.
- Restraint: Weak farm-trial alignment is anticipated to delay supplier approval in accounts that need shade evidence before switching inputs.
- Opportunity: Natural pigment blends are projected to create extension routes for producers seeking cleaner carotenoid positioning.
Commercial layer programs are expected to increase buying activity when pigment briefs connect shade targets to stable feed production. FAO’s 2025 food outlook reported global hen egg production at 91 million tonnes, reinforcing the scale behind color-control needs. Suppliers that explain dose response in operational terms are likely to gain trial access before broader contracts. Nutrition teams also compare pigment planning with feed enzyme choices during additive reviews.
Quality teams are likely to slow adoption in accounts that lack clear ownership across formulation and flock trials. Shade cards need a named owner before rollout reaches feed mills and packers. Ration changes involving feed grade oils and grains can alter shade expectations. EW Nutrition’s field validation using 57000 hens shows why commercial proof remains central during supplier qualification. Buyers are expected to concentrate trials among suppliers that reduce uncertainty before switching.
Implementation barriers are projected to create a route for vendors that bundle pigments and application service. BASF launched Lutavit A/D3 1000/200 NXT in 2025, showing continued animal nutrition investment from large ingredient suppliers. The portfolio signal is expected to keep buyer attention on suppliers that combine formulation depth and reliable handover support.
Which country CAGRs are profiled in the egg yolk pigments market?
.webp "Top Country Growth Comparison Egg Yolk Pigments Market Cagr (2026 2036)")
| Country | CAGR |
|---|---|
| United States | 3.4% |
| China | 4.3% |
| India | 5.1% |
| Germany | 2.9% |
| United Kingdom | 3.1% |
| Japan | 2.5% |
| South Korea | 3.3% |
Source: FMI's proprietary forecasting model and primary research
How do country-level CAGRs compare in the egg yolk pigments market?
Country CAGR profiles in the egg yolk pigments market reflect layer scale, feed-mill maturity and shade-control requirements. India and China show stronger conversion potential due to dense egg production and expanding commercial feed use. The United States and South Korea form a middle adoption band shaped by packer standards and technical service. The United Kingdom, Germany and Japan show steadier purchasing tied to documentation and careful supplier switching.
- In United States, the industry is projected to grow at 3.4% CAGR through 2036, due to large commercial layer operations and retail carton consistency needs. USDA NASS reported table egg production of 90.1 billion eggs in 2025. Midwest layer complexes are expected to keep dry pigment and premix trials active. Kemin Industries and BASF are positioned to gain traction where buyers need documentation and local support.
- China’s demand outlook is anticipated to advance at 4.3% CAGR over the assessment period, supported by dense egg output and provincial feed integration. The National Bureau of Statistics reported egg output of 34.98 million tonnes in 2025. Shandong and Henan layer farms are expected to prioritize shade uniformity during scale operations. Allied Biotech Corporation and dsm-firmenich are likely to secure attention in accounts needing carotenoid depth.
- India is forecast to rise at 5.1% CAGR over the forecast period, attributable to commercial egg expansion and premix adoption. PIB reported total egg production of 149.11 billion during 2024-25. Andhra Pradesh and Telangana layer clusters are expected to widen pigment use across commercial feed programs. Regional distributors with trial support are likely to expand access where buyers need lower switching risk.
- Adoption in Germany is estimated to post 2.9% CAGR over the forecast period, owing to retailer review and strict feed additive documentation. Destatis reported average laying hens of 44.2 million in commercial holdings. Lower Saxony and North Rhine-Westphalia feed buyers are expected to maintain conservative pigment trials. Suppliers with EU-ready documentation are predicted to receive stronger procurement consideration.
- The United Kingdom outlook is projected to record 3.1% CAGR over the assessment period, driven by retail egg production and packing station discipline. Defra reported 273 million dozen eggs produced for human consumption in Q1 2026. East Anglia and Northern England feed networks are expected to test shade consistency across retail-linked supply. Buyers are expected to favor suppliers that provide clear shade records and packer support.
- In Japan, egg yolk pigment demand is predicted to advance at 2.5% CAGR over the forecast period due to careful supplier coordination and stable feed routines. MAFF food data and industry references point to disciplined livestock supply chains, while local quality norms keep shade variation tightly reviewed. Layer integrators are expected to adopt selectively where dosage proof fits established feed practices. dsm-firmenich and Kemin Industries remain practical options for evidence-led accounts.
- South Korea is estimated to post 3.3% CAGR during the forecast period, supported by concentrated poultry channels and nutrition-driven feed planning. USDA FAS reported that Korea’s chicken consumption in 2026 was forecast to increase 2%, pointing to continued poultry protein demand. Gyeonggi and Chungcheong feed accounts are expected to compare pigment programs carefully. Technical-service suppliers are likely to gain repeat discussions where field support reduces switching friction.
Who are the notable companies in the egg yolk pigments market?
BASF, dsm-firmenich, Kemin Industries, EW Nutrition, Allied Biotech Corporation, Impextraco, Nutrex, Vinayak Ingredients, and Behn Meyer are the notable companies shaping this market.
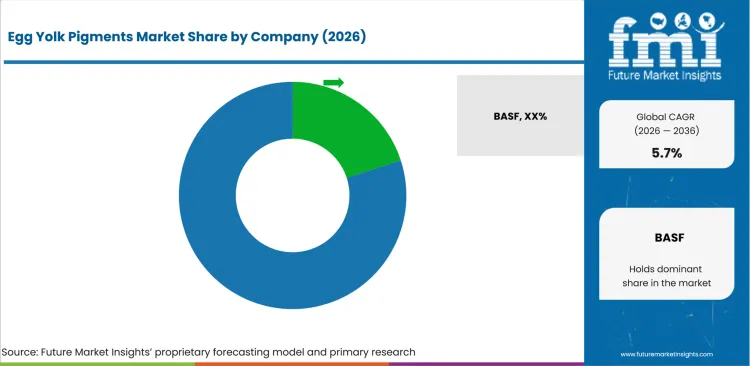
Competition in the egg yolk pigments market is split by synthetic carotenoid depth and natural pigment application support.The buyer decision is expected to center on which supplier reduces trial risk and documentation work.
- BASF and dsm-firmenich focus on carotenoid and animal nutrition breadth, which addresses layer producers needing pigment choices inside wider feed additive screens. Buyers use these portfolios to compare synthetic shade performance and technical support before shifting formulation programs.
- Buyers choosing Kemin Industries or EW Nutrition are typically looking for natural pigment fit due to marigold, paprika, and field-support expertise. Kemin’s layer portfolio and EW Nutrition’s natural pigmentation content help quality teams lower switching risk before broader purchases.
- Allied Biotech Corporation and Impextraco gain preference in carotenoid sourcing environments due to product breadth and channel access. Procurement teams value these suppliers where beta-carotene, canthaxanthin, or lutein options need faster comparison across feed applications.
- In regional distributor-led accounts, Nutrex, Vinayak Ingredients, and Behn Meyer are prominent due to localized supply reach and application familiarity. Feed mills select these suppliers in accounts where service response and smaller trial programs influence adoption decisions.
Competitive Benchmarking: Egg Yolk Pigments Market
| Company | Carotenoid Fit | Natural-Pigment Fit | Service Reach | Regional Access |
|---|---|---|---|---|
| BASF | High | Medium | Global | Strong |
| dsm-firmenich | High | Medium | Global | Strong |
| Kemin Industries | Strong | High | Global | High |
| EW Nutrition | Medium | High | Global | Strong |
| Allied Biotech Corporation | High | Medium | Regional | Strong |
| Impextraco | Strong | Medium | Global | Strong |
| Nutrex | Medium | High | Regional | Regional |
| Vinayak Ingredients | Medium | High | Country-specific | Regional |
| Behn Meyer | Medium | Medium | Regional | Strong |
Source: Future Market Insights competitive analysis, 2026. Ratings reflect relative portfolio relevance and workflow fit. Service capability and geographic reach shape the remaining comparison.
Key Developments in the Egg Yolk Pigments Market
- In October 2025, BASF launched Lutavit A/D3 1000/200 NXT for animal nutrition. The product combines vitamin A and vitamin D3 in one formulation. Feed buyers are expected to read the launch as a signal that large ingredient suppliers are still investing in stable animal nutrition formats.
- In February 2026, dsm-firmenich announced an agreement to divest Animal Nutrition & Health to CVC Capital Partners. The transaction included vitamins, carotenoids, premixes, and performance solutions. Layer pigment buyers are expected to watch service continuity before longer supplier commitments.
- In August 2025, Kemin updated its layer nutrition portfolio content for animal nutrition buyers. The company highlighted Organic ORO GLO and Organic KEM GLO for yolk color support. Organic egg programs are likely to use these options during natural pigment reviews.
Key Players in the Egg Yolk Pigments Market
Synthetic carotenoid and animal nutrition suppliers
- BASF
- dsm-firmenich
- Allied Biotech Corporation
- Impextraco
Natural pigment and application-support suppliers
- Kemin Industries
- EW Nutrition
- Nutrex
- Vinayak Ingredients
Regional distribution and service partners
- Behn Meyer
Egg Yolk Pigments Market - Report Scope
| Coverage field | Report scope |
|---|---|
| Market breakdown | Egg Yolk Pigments Market Breakdown by form, source, livestock, function, and region |
| Market Definition | Pigment ingredients and supporting formats used by feed mills, premix suppliers, and layer producers to deliver consistent egg yolk shade in commercial egg production. |
| Regions Covered | North America, Latin America, Europe, East Asia, South Asia and Pacific, Middle East and Africa |
| Countries Covered | United States, China, India, Germany, United Kingdom, Japan, South Korea and additional country markets |
| Key Companies Profiled | BASF, dsm-firmenich, Kemin Industries, EW Nutrition, Allied Biotech Corporation, Impextraco, Nutrex, Vinayak Ingredients, Behn Meyer |
| Forecast Period | 2026 to 2036 |
| Approach | Hybrid methodology using segment adoption, buyer use cases, country CAGRs, supplier portfolios, and verified public-source signals |
Source: Future Market Insights - analysis driven by proprietary forecasting models and primary research
Egg Yolk Pigments Market - Research Methodology
| Method | Approach |
|---|---|
| Primary Research | FMI analysts reviewed inputs from feed mills, layer integrators, premix suppliers, egg packers, pigment producers, and regional distributors. Supplier interviews focused on pigment concentration, dose stability, shade-card response, application support, and adoption barriers across dry, liquid, and premix formats. |
| Desk Research | Desk research covered official egg production data, national agriculture releases, feed industry references, company product information, and public animal nutrition updates. Product relevance was checked against egg yolk pigmentation use cases, carotenoid source claims, layer feed fit, and documentation needs. |
| Market Sizing and Forecasting | The model combined commercial egg production, feed pigment adoption, form preference, source mix, function positioning, and country-level layer industry signals. Forecast assumptions were adjusted for dry format preference, microbial sourcing, poultry demand, yolk color enhancement, and natural pigment conversion. |
| Data Validation | Forecasts were checked against egg output, layer flock indicators, company pigment portfolios, and country-level poultry feed conditions. Company portfolios were reviewed to avoid counting adjacent animal nutrition products without direct egg yolk pigmentation relevance. Duplicate public statistics were screened before final allocation. |
Source: Future Market Insights (FMI) analysis, based on proprietary forecasting model and primary research
Egg Yolk Pigments Market by Segments
Egg Yolk Pigments Market segmented by Form:
- Dry
- Liquid
- Pellet
- Premix
- Encapsulated
Egg Yolk Pigments Market segmented by Source:
- Synthetic
- Microbial
- Plant or botanical
- Mineral
- Yeast-based
Egg Yolk Pigments Market segmented by Livestock:
- Poultry
- Broilers
- Layers
- Turkey
- Other poultry
Egg Yolk Pigments Market segmented by Function:
- Yolk color enhancement
- Feed color standardization
- Carotenoid enrichment
- Shade consistency
- Natural pigment positioning
Egg Yolk Pigments Market by Region:
- North America
- United States
- Canada
- Europe
- Germany
- United Kingdom
- France
- Italy
- Spain
- Asia Pacific
- China
- Japan
- South Korea
- Taiwan
- Singapore
- Latin America
- Brazil
- Mexico
- Argentina
- Middle East & Africa
- GCC Countries
- South Africa
- Israel
Research Sources and Bibliography
- Food and Agriculture Organization of the United Nations. (2025, June). FAO Food Outlook: Global output of key food commodity crops on course for new records.
- Food and Agriculture Organization of the United Nations. (2025, December). Agricultural production statistics 2010-2024.
- International Feed Industry Federation. (2024). IFIF 2024.
- USA Department of Agriculture, National Agricultural Statistics Service. (2026, February). Chickens and Eggs 2025 Summary 02/17/2026.
- National Bureau of Statistics of China. (2026, February). Statistical Communique of the People’s Republic of China on the 2025 National Economic and Social Development.
- Press Information Bureau, Government of India. (2025, November). Release of Basic Animal Husbandry Statistics 2025.
- Department for Environment, Food & Rural Affairs. (2026, April). Quarterly UK statistics about eggs: Statistics notice data to Q1 2026.
- German Federal Statistical Office. (2024, March). Establishments with laying hens, egg production.
- Eurostat. (2026, June). Poultry statistics.
- USA Department of Agriculture, Foreign Agricultural Service. (2025, September). Poultry and Products Annual Seoul Korea - Republic of KS2025-0036.
- Kemin Industries. (2025, August). Animal Nutrition and Health Solutions for Layers.
- Kemin Industries. (2026). ORO GLO Delivers Consistent Yellow Pigmentation to Egg Yolks and Broiler Skin.
- BASF. (2025, October). BASF launches combined vitamin A and D3 product for animal nutrition.
- BASF. (2026). Lucantin Yellow 10% NXT - Choose your egg yolk color.
- dsm-firmenich. (2026, February). dsm-firmenich announces agreement to divest Animal Nutrition & Health to CVC Capital Partners.
- Vinayak Ingredients. (2024). Enhancing Egg Yolk Color With Natural Pigments.
- EW Nutrition. (2026, May). The Case for Natural Egg Yolk Pigmentation.
This bibliography is provided for reader reference and uses primary government, standards-body, official trade body, and company sources.
This Report Answers
- What is the expected value of the egg yolk pigments market in 2026 and 2036?
- What CAGR is forecast for the egg yolk pigments market from 2026 to 2036?
- Which segments shape form and source demand alongside livestock and function demand?
- Which buyer pressures are expected to support egg yolk pigment adoption?
- How do country CAGRs differ across the profiled markets?
- Which companies compete across synthetic carotenoids and natural pigment programs?
- How does FMI validate forecasts and avoid duplicate external statistics?
- What buyer factors should suppliers address before broader account expansion?
- How do shade documentation and field trials affect supplier selection?
Frequently Asked Questions
Why should executives track the Egg Yolk Pigments Market?
Executives should track this market due to its shift from simple colorant buying toward documented shade-control programs across commercial layer operations.
What business problem does the Egg Yolk Pigments Market address?
It helps feed mills and layer producers keep yolk shade consistent during grain changes, premix adjustments, and retail quality reviews.
What should procurement leaders evaluate before selecting suppliers?
Procurement leaders should evaluate pigment concentration, shade response evidence, batch consistency, source identity, and technical support readiness.
What limits return on investment for buyers?
Return on investment is limited by weak farm trials, inconsistent dose guidance, and delayed agreement between procurement and nutrition teams.
How do suppliers build executive confidence?
Suppliers build confidence by providing field evidence, clear shade documentation, reliable formats, and application support that fits commercial layer routines.
Preview the report firsthand - request a free sample
Get SampleGet the brochure for pricing and purchase details.
Get PDFTable of Content
- Key Takeaways
- Market Size and CAGR
- Top Growth Driver
- Fastest Growing Segment
- Leading Region
- Key Companies
- Emerging Opportunities
- Executive Summary
- Global Market Outlook
- Demand-side Trends
- Supply-side Trends
- Technology Roadmap Analysis
- Analysis and Recommendations
- Analyst Perspective (What is happening? Why now? What should investors know?)
- Key Questions Answered
- How large is the market?
- What is the CAGR?
- What are key trends?
- Which region dominates?
- Who are the leaders?
- Market Overview
- Market Coverage / Taxonomy
- Market Definition / Scope / Limitations
- Research Methodology
- Chapter Orientation
- Analytical Lens and Working Hypotheses
- Market Structure, Signals, and Trend Drivers
- Benchmarking and Cross-market Comparability
- Market Sizing, Forecasting, and Opportunity Mapping
- Research Design and Evidence Framework
- Desk Research Programme (Secondary Evidence)
- Expert Input and Fieldwork (Primary Evidence)
- Tooling, Models, and Reference Databases
- Data Engineering and Model Build
- Quality Assurance and Audit Trail
- Market Background
- Market Dynamics (Drivers, Restraints, Opportunity, Trends)
- Scenario Forecast (Optimistic, Likely, Conservative)
- Impact Analysis
- AI Impact
- Sustainability Impact
- Regulatory Impact
- Technology Impact
- Consumer / Buyer Analysis
- Purchase Drivers
- Adoption Barriers
- Buyer Journey
- Opportunity Map Analysis
- Product Life Cycle Analysis
- Supply Chain Analysis
- Investment Feasibility Matrix
- Value Chain Analysis
- PESTLE and Porter's Analysis
- Regulatory Landscape
- Regional Parent Market Outlook
- Production and Consumption Statistics
- Import and Export Statistics
- Global Market Analysis and Forecast, 2021 to 2036
- Historical Market Size Value (USD Million) & Volume (Unit) Analysis, 2021 to 2025
- Current and Future Market Size Value (USD Million) & Volume (Unit) Projections, 2026 to 2036
- Y-o-Y Growth Trend Analysis
- Absolute $ Opportunity Analysis
- Global Market Pricing Analysis, 2021 to 2036
- Global Market Analysis and Forecast, By Form, 2021 to 2036
- Introduction / Key Findings
- Historical Market Size Value (USD Million) & Volume (Unit) Analysis By Form, 2021 to 2025
- Current and Future Market Size Value (USD Million) & Volume (Unit) Analysis and Forecast By Form, 2026 to 2036
- Dry
- Liquid
- Pellet
- Premix
- Encapsulated
- Dry
- Y-o-Y Growth Trend Analysis By Form, 2021 to 2025
- Absolute $ Opportunity Analysis By Form, 2026 to 2036
- Global Market Analysis and Forecast, By Source, 2021 to 2036
- Introduction / Key Findings
- Historical Market Size Value (USD Million) & Volume (Unit) Analysis By Source, 2021 to 2025
- Current and Future Market Size Value (USD Million) & Volume (Unit) Analysis and Forecast By Source, 2026 to 2036
- Microbial
- Synthetic
- Plant or botanical
- Mineral
- Yeast-based
- Microbial
- Y-o-Y Growth Trend Analysis By Source, 2021 to 2025
- Absolute $ Opportunity Analysis By Source, 2026 to 2036
- Global Market Analysis and Forecast, By Livestock, 2021 to 2036
- Introduction / Key Findings
- Historical Market Size Value (USD Million) & Volume (Unit) Analysis By Livestock, 2021 to 2025
- Current and Future Market Size Value (USD Million) & Volume (Unit) Analysis and Forecast By Livestock, 2026 to 2036
- Poultry
- Broilers
- Layers
- Turkey
- Other poultry
- Poultry
- Y-o-Y Growth Trend Analysis By Livestock, 2021 to 2025
- Absolute $ Opportunity Analysis By Livestock, 2026 to 2036
- Global Market Analysis and Forecast, By Function, 2021 to 2036
- Introduction / Key Findings
- Historical Market Size Value (USD Million) & Volume (Unit) Analysis By Function, 2021 to 2025
- Current and Future Market Size Value (USD Million) & Volume (Unit) Analysis and Forecast By Function, 2026 to 2036
- Yolk color enhancement
- Feed color standardization
- Carotenoid enrichment
- Shade consistency
- Yolk color enhancement
- Y-o-Y Growth Trend Analysis By Function, 2021 to 2025
- Absolute $ Opportunity Analysis By Function, 2026 to 2036
- Global Market Analysis and Forecast, By Region, 2021 to 2036
- Introduction
- Historical Market Size Value (USD Million) & Volume (Unit) Analysis By Region, 2021 to 2025
- Current Market Size Value (USD Million) & Volume (Unit) Analysis and Forecast By Region, 2026 to 2036
- North America
- Latin America
- Western Europe
- Eastern Europe
- East Asia
- South Asia and Pacific
- Middle East & Africa
- Market Attractiveness Analysis By Region
- North America Market Analysis and Forecast, By Country, 2021 to 2036
- Historical Market Size Value (USD Million) & Volume (Unit) Trend Analysis By Market Taxonomy, 2021 to 2025
- Market Size Value (USD Million) & Volume (Unit) Forecast By Market Taxonomy, 2026 to 2036
- By Country
- USA
- Canada
- Mexico
- By Form
- By Source
- By Livestock
- By Function
- By Country
- Market Attractiveness Analysis
- By Country
- By Form
- By Source
- By Livestock
- By Function
- Key Takeaways
- Latin America Market Analysis and Forecast, By Country
- Historical Market Size Value (USD Million) & Volume (Unit) Trend Analysis By Market Taxonomy, 2021 to 2025
- Market Size Value (USD Million) & Volume (Unit) Forecast By Market Taxonomy, 2026 to 2036
- By Country
- Brazil
- Chile
- Rest of Latin America
- By Form
- By Source
- By Livestock
- By Function
- By Country
- Market Attractiveness Analysis
- By Country
- By Form
- By Source
- By Livestock
- By Function
- Key Takeaways
- Western Europe Market Analysis and Forecast, By Country
- Historical Market Size Value (USD Million) & Volume (Unit) Trend Analysis By Market Taxonomy, 2021 to 2025
- Market Size Value (USD Million) & Volume (Unit) Forecast By Market Taxonomy, 2026 to 2036
- By Country
- Germany
- UK
- Italy
- Spain
- France
- Nordic
- BENELUX
- Rest of Western Europe
- By Form
- By Source
- By Livestock
- By Function
- By Country
- Market Attractiveness Analysis
- By Country
- By Form
- By Source
- By Livestock
- By Function
- Key Takeaways
- Eastern Europe Market Analysis and Forecast, By Country
- Historical Market Size Value (USD Million) & Volume (Unit) Trend Analysis By Market Taxonomy, 2021 to 2025
- Market Size Value (USD Million) & Volume (Unit) Forecast By Market Taxonomy, 2026 to 2036
- By Country
- Russia
- Poland
- Hungary
- Balkan & Baltic
- Rest of Eastern Europe
- By Form
- By Source
- By Livestock
- By Function
- By Country
- Market Attractiveness Analysis
- By Country
- By Form
- By Source
- By Livestock
- By Function
- Key Takeaways
- East Asia Market Analysis and Forecast, By Country
- Historical Market Size Value (USD Million) & Volume (Unit) Trend Analysis By Market Taxonomy, 2021 to 2025
- Market Size Value (USD Million) & Volume (Unit) Forecast By Market Taxonomy, 2026 to 2036
- By Country
- China
- Japan
- South Korea
- By Form
- By Source
- By Livestock
- By Function
- By Country
- Market Attractiveness Analysis
- By Country
- By Form
- By Source
- By Livestock
- By Function
- Key Takeaways
- South Asia and Pacific Market Analysis and Forecast, By Country
- Historical Market Size Value (USD Million) & Volume (Unit) Trend Analysis By Market Taxonomy, 2021 to 2025
- Market Size Value (USD Million) & Volume (Unit) Forecast By Market Taxonomy, 2026 to 2036
- By Country
- India
- ASEAN
- Australia & New Zealand
- Rest of South Asia and Pacific
- By Form
- By Source
- By Livestock
- By Function
- By Country
- Market Attractiveness Analysis
- By Country
- By Form
- By Source
- By Livestock
- By Function
- Key Takeaways
- Middle East & Africa Market Analysis and Forecast, By Country
- Historical Market Size Value (USD Million) & Volume (Unit) Trend Analysis By Market Taxonomy, 2021 to 2025
- Market Size Value (USD Million) & Volume (Unit) Forecast By Market Taxonomy, 2026 to 2036
- By Country
- Kingdom of Saudi Arabia
- Other GCC Countries
- Türkiye
- South Africa
- Other African Union
- Rest of Middle East & Africa
- By Form
- By Source
- By Livestock
- By Function
- By Country
- Market Attractiveness Analysis
- By Country
- By Form
- By Source
- By Livestock
- By Function
- Key Takeaways
- Key Countries Market Analysis
- USA
- Pricing Analysis
- Market Share Analysis, 2025
- By Form
- By Source
- By Livestock
- By Function
- Canada
- Pricing Analysis
- Market Share Analysis, 2025
- By Form
- By Source
- By Livestock
- By Function
- Mexico
- Pricing Analysis
- Market Share Analysis, 2025
- By Form
- By Source
- By Livestock
- By Function
- Brazil
- Pricing Analysis
- Market Share Analysis, 2025
- By Form
- By Source
- By Livestock
- By Function
- Chile
- Pricing Analysis
- Market Share Analysis, 2025
- By Form
- By Source
- By Livestock
- By Function
- Germany
- Pricing Analysis
- Market Share Analysis, 2025
- By Form
- By Source
- By Livestock
- By Function
- UK
- Pricing Analysis
- Market Share Analysis, 2025
- By Form
- By Source
- By Livestock
- By Function
- Italy
- Pricing Analysis
- Market Share Analysis, 2025
- By Form
- By Source
- By Livestock
- By Function
- Spain
- Pricing Analysis
- Market Share Analysis, 2025
- By Form
- By Source
- By Livestock
- By Function
- France
- Pricing Analysis
- Market Share Analysis, 2025
- By Form
- By Source
- By Livestock
- By Function
- India
- Pricing Analysis
- Market Share Analysis, 2025
- By Form
- By Source
- By Livestock
- By Function
- ASEAN
- Pricing Analysis
- Market Share Analysis, 2025
- By Form
- By Source
- By Livestock
- By Function
- Australia & New Zealand
- Pricing Analysis
- Market Share Analysis, 2025
- By Form
- By Source
- By Livestock
- By Function
- China
- Pricing Analysis
- Market Share Analysis, 2025
- By Form
- By Source
- By Livestock
- By Function
- Japan
- Pricing Analysis
- Market Share Analysis, 2025
- By Form
- By Source
- By Livestock
- By Function
- South Korea
- Pricing Analysis
- Market Share Analysis, 2025
- By Form
- By Source
- By Livestock
- By Function
- Russia
- Pricing Analysis
- Market Share Analysis, 2025
- By Form
- By Source
- By Livestock
- By Function
- Poland
- Pricing Analysis
- Market Share Analysis, 2025
- By Form
- By Source
- By Livestock
- By Function
- Hungary
- Pricing Analysis
- Market Share Analysis, 2025
- By Form
- By Source
- By Livestock
- By Function
- Kingdom of Saudi Arabia
- Pricing Analysis
- Market Share Analysis, 2025
- By Form
- By Source
- By Livestock
- By Function
- Türkiye
- Pricing Analysis
- Market Share Analysis, 2025
- By Form
- By Source
- By Livestock
- By Function
- South Africa
- Pricing Analysis
- Market Share Analysis, 2025
- By Form
- By Source
- By Livestock
- By Function
- USA
- Market Structure Analysis
- Competition Dashboard
- Competition Benchmarking
- Market Share Analysis of Top Players
- By Regional
- By Form
- By Source
- By Livestock
- By Function
- Emerging Startups
- Innovation Benchmarking
- Competition Analysis
- Competition Deep Dive
- BASF
- Overview
- Product Portfolio
- Profitability by Market Segments (Product/Region/Sales Channel)
- Sales Footprint
- Strategy Overview
- Marketing Strategy
- Product Strategy
- Channel Strategy
- dsm-firmenich
- Allied Biotech Corporation
- Impextraco
- Kemin Industries
- EW Nutrition
- Nutrex
- Vinayak Ingredients
- BASF
- Case Studies
- Success Stories
- Recent Developments
- Competition Deep Dive
- Assumptions & Acronyms Used


