Reports

- Global Locations -

Headquarters

Future Market Insights, Inc.

Christiana Corporate, 200
Continental Drive, Suite 401,
Newark, Delaware - 19713,
United States

T: +1-845-579-5705

Americas

Future Market Insights, Inc.

616 Corporate Way, Suite 2-9018,
Valley Cottage, NY 10989, United States

T: +1-347-918-3531

MEA

Future Market Insights

1602-6 Jumeirah Bay X2 Tower, Plot No: JLT-PH2-X2A,
Jumeirah Lakes Towers, Dubai,
United Arab Emirates

Europe

Future Market Insights

3rd Floor, 207 Regent Street,
W1B 3HH London
United Kingdom

T: + 44 (0) 20 8123 9659
D: +44 (0) 20 3287 4268

Asia Pacific

Future Market Insights

IndiaLand Global Tech Park, Unit UG-1, Behind Grand HighStreet, Phase 1, Hinjawadi, MH, Pune – 411057, India

Epiglottitis Treatment Market Snapshot (2022-2032)

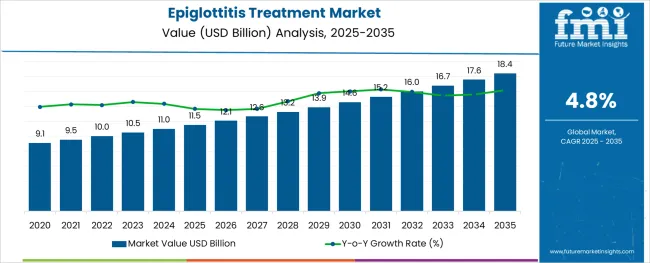
[301 Pages Report] The global epiglottitis treatment demand is presently valued at around US$ 10 Billion and is forecasted to develop at a CAGR of 4.8% to reach US$ 16 Billion by 2032. As of 2021, the market was valued at US$ 9.7 Billion, and is slated to register a Y-o-Y growth rate of 3.1% by 2022.

There is a huge spike in the prevalence of the disease is likely to significantly contribute to the epiglottitis treatment market. The spike in the diagnosis of the abovementioned condition as well as developing medical infrastructure is anticipated to surge the demand for epiglottitis treatment in this region during the forecast period.

Report Attribute Details
Estimated Base Year Value (2021) US$ 9.7 Billion
Expected Market Value (2022) US$ 10 Billion
Anticipated Forecast Value (2032) US$ 16 Billion
Projected Growth Rate (2022 to 2032) 4.8% CAGR

Epiglottitis is a bacterial viral infection that causes inflammation and swelling of the epiglottis. The epiglottis is a cartilage structure located at the back of the throat, beneath the tongue, and its function is to close over the trachea when foods are swallowed. Epiglottitis causes breathing problems, tachycardia, swelling of supraglottic tissue, inspiratory stridor, pharyngitis, cervical lymph nodes, and inability to deal with secretion.

Drooling, dysphagia, dysphonia, and distressed inspiration efforts are all symptoms of epiglottitis. Adult epiglottitis differential diagnosis includes Infectious process and non-infectious disease, infectious process symptoms include diphtheria, pertussis, croup, tracheobronchitis, peripharyngeal, and others, and non-infectious disease symptoms include allergic reaction, angioneurotic, oedema, reflex laryngospasm, systemic lupus, and others.

Epiglottitis can affect people of any age; however, it is usually diagnosed in males rather than females and occurs in children aged 2 to 8 years. Epiglottitis is primarily caused by Haemophilus influenzae type B (HIB), but other bacteria and viruses such as Streptococcus pneumonia, Streptococcus A, B, and C, and Staphylococcus aureus can also cause epiglottitis inflammation.

A blood test to identify bacteria, an x-ray, and a CT scan to determine the level of swelling are used to diagnose epiglottitis. Epiglottitis is treated with an oxygen mask, which delivers oxygen to the lungs, and a tracheostomy, which may be required to bypass the swelling in the throat.

Don't pay for what you don't need

Customize your report by selecting specific countries or regions and save 30%!

Which are Some Prominent Drivers Spearheading Epiglottitis Treatment Market Growth?

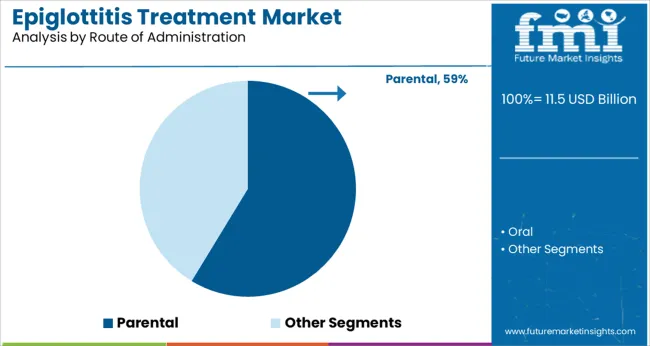
During the forecast period, the increasing prevalence and incidence rate of epiglottitis are expected to contribute to the growth of the Epiglottitis Treatment market. HIB vaccination and third generation cephalosporin, which is administered via the parental route (intramuscular/intravenous) and is effective against Haemophilus influenzae type B, which causes Epiglottitis disease, is expected to drive the Epiglottitis Treatment market.

Because epiglottitis is an inflammatory disease caused by a variety of organisms, antibiotics and the combination of an intravenous ant staphylococcal agent are expected to grow significantly during the Epiglottitis Treatment market forecast period. Furthermore, the soaring unhealthy lifestyle combined with lack of cleanliness is anticipated to boost the market’s growth.

What are the Challenges Faced by the Epiglottitis Treatment Industry?

Even though epiglottitis treatment is flourishing, there are still some factors impeding the growth of the worldwide epiglottitis treatment market. Epiglottitis Treatment drugs can occasionally cause depression and other side effects, limiting the Epiglottitis Treatment market's growth. The primary restraint of the Epiglottitis Treatment market is a lack of access to healthcare facilities, affordability constraints, and a lack of market penetration of approved drugs.

Sabyasachi Ghosh
Sabyasachi Ghosh

Principal Consultant

Talk to Analyst

Find your sweet spots for generating winning opportunities in this market.

Why is Asia-Pacific emerging as an Opportunistic Epiglottitis Treatment Market?

The Epiglottitis Treatment market in Asia Pacific is projected to thrive at a substantial CAGR of 4.5% over the assessment period from 2022 to 2032. The inclusion of one of the largest economies, such as India and China, is projected to boost the market of the APAC epiglottitis treatment market. As a result of the availability of funds for research and development, this region is expected to observe significant growth in the epiglottitis treatment market.

On the other hand, APAC is further experiencing prominent growth prospects in the epiglottitis treatment market due to increased bacterial infection prevalence as well as increased investment in healthcare infrastructure.
How is North America Contributing to Growth of the Epiglottitis Treatment Market?

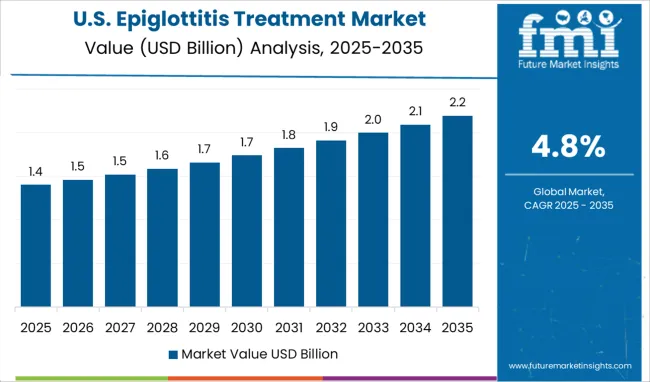
According to Future Market Insights, North America is predicted to dominate the worldwide Epiglottitis Treatment market with a significant CAGR of 4.9%, due to higher adoption and number of customers using Epiglottitis Treatment, as well as increased awareness about Epiglottitis disease. Around 7 million Americans have weak immune system which is also one of the causes of epiglottitis.

In addition to that, an estimated 1.5 million people over the age of 12 use cocaine each month In the United States which is another cause of epiglottitis. Moreover, due to the recent technological advancements and the presence of a variety of novel drug molecules to improve the treatment procedure in the region, the North America epiglottitis treatment market is anticipated to flourish during the forecast period from 2022 to 2032.

Get the data you need at a Fraction of the cost

Personalize your report by choosing insights you need
and save 40%!

Market Competition

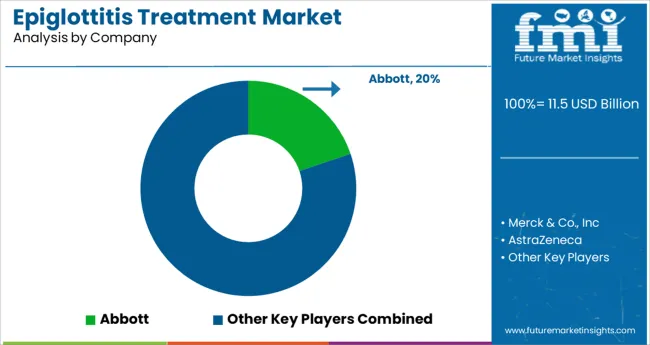
The global epiglottitis treatment market is a moderately fragmented market. Abbott, Merck & Co., Inc., AstraZeneca, Boehringer Ingelheim International GmbH, Pfizer Inc., Sanofi, Teva Pharmaceutical Industries Ltd., GlaxoSmithKline Plc., Johnson & Johnson, Roche Holding AG, and others are some of the market participants identified in the global Epiglottitis Treatment market.

Report Scope

Report Attribute Details
Growth Rate CAGR of 5% from 2022 to 2032
Market Value in 2022 US$ 10 Billion
Market Value in 2032 US$ 16 Billion
Base Year for Estimation 2021
Historical Data 2017 to 2021
Forecast Period 2022 to 2032
Quantitative Units Revenue in USD Million and CAGR from 2022 to 2032
Report Coverage Revenue Forecast, Volume Forecast, Company Ranking, Competitive Landscape, Growth Factors, Trends and Pricing Analysis
Segments Covered
  • Drug Type
  • Route of Administration
  • End User
  • Region
Regions Covered
  • North America
  • Latin America
  • Europe
  • Asia Pacific
  • Middle East and Africa
Key Countries Profiled
  • USA
  • Canada
  • Brazil
  • Mexico
  • Germany
  • UK
  • France
  • Spain
  • Italy
  • Russia
  • BENELUX
  • China
  • Japan
  • South Korea
  • GCC
  • South Africa
  • Turkey
Key Companies Profiled
  • Abbot
  • Merck & Co., Inc.
  • AstraZeneca
  • Boehringer Ingelheim International GmbH
  • Pfizer Inc.
  • Sanofi
  • Teva Pharmaceutical Industries Ltd.
  • GlaxoSmithKline Plc.
  • Johnson & Johnson
  • Roche Holding AG
Customization Available Upon Request

Key Segments Profiled in the Epiglottitis Treatment Industry Survey

Epiglottitis Treatment Market by Drug Type:

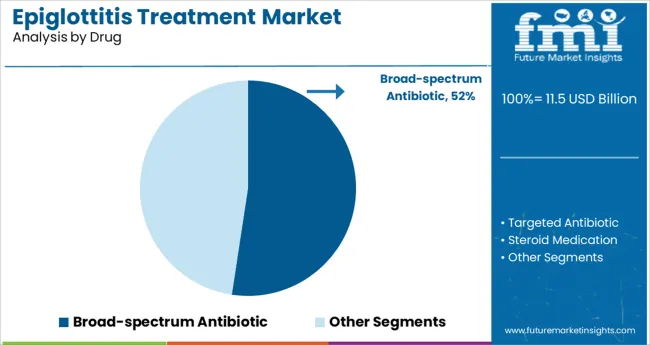
  • Epiglottitis Treatment through Broad-Spectrum Antibiotics
  • Epiglottitis Treatment through Targeted Antibiotic
  • Epiglottitis Treatment through Steroid Medication

Epiglottitis Treatment Market by Route of Administration:

  • Oral Epiglottitis Treatment
  • Parental Epiglottitis Treatment

Epiglottitis Treatment Market by End User:

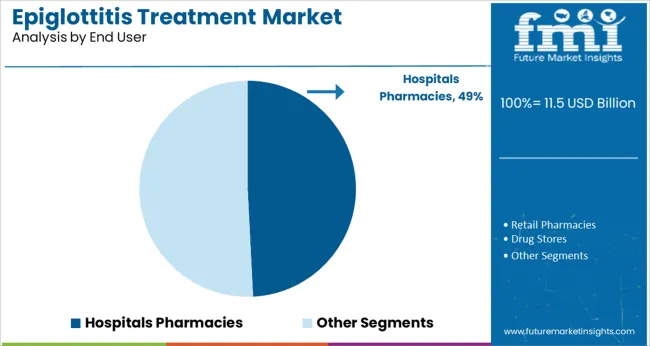
  • Epiglottitis Treatment Drug Sales across Hospitals Pharmacies
  • Epiglottitis Treatment Drug Sales across Retail Pharmacies
  • Epiglottitis Treatment Drug Sales across Drug Stores
  • Epiglottitis Treatment Drug Sales across Clinics
  • Epiglottitis Treatment Drug Sales across Online Pharmacies

Epiglottitis Treatment Market by Region:

  • North America  Epiglottitis Treatment Market
  • Latin America Epiglottitis Treatment Market
  • Europe Epiglottitis Treatment Market
  • Asia Pacific Epiglottitis Treatment Market
  • Middle East and Africa Epiglottitis Treatment Market

Frequently Asked Questions

What is the anticipated growth of the Epiglottitis Treatment market until 2032?

FMI projects the global epiglottitis treatment market to expand at a 5% value CAGR by 2032

Which region is forecast to be the most lucrative for Epiglottitis Treatment market growth?

Asia Pacific is expected to be the most opportunistic Epiglottitis Treatment market, expanding at a 4.5% CAGR

Which are some prominent Epiglottitis Treatment manufacturers?

Abbott, Merck & Co., Inc., AstraZeneca, Boehringer Ingelheim International GmbH, Pfizer Inc., Sanofi, Teva Pharmaceutical Industries Ltd, GlaxoSmithKline plc, Johnson & Johnson and Roche Holding AG, are some prominent Epiglottitis Treatment manufacturers

Table of Content

1. Executive Summary

    1.1. Global Market Outlook

    1.2. Demand-side Trends

    1.3. Supply-side Trends

    1.4. Technology Roadmap Analysis

    1.5. Analysis and Recommendations

2. Market Overview

    2.1. Market Coverage / Taxonomy

    2.2. Market Definition / Scope / Limitations

3. Market Background

    3.1. Market Dynamics

        3.1.1. Drivers

        3.1.2. Restraints

        3.1.3. Opportunity 

        3.1.4. Trends

    3.2. Scenario Forecast

        3.2.1. Demand in Optimistic Scenario

        3.2.2. Demand in Likely Scenario

        3.2.3. Demand in Conservative Scenario

    3.3. Opportunity Map Analysis

    3.4. Investment Feasibility Matrix

    3.5. PESTLE and Porter’s Analysis

    3.6. Regulatory Landscape

        3.6.1. By Key Regions

        3.6.2. By Key Countries

    3.7. Regional Parent Market Outlook

4. Global Epiglottitis Treatment Market Analysis 2017-2021 and Forecast, 2022-2032

    4.1. Historical Market Size Value (US$ Mn) Analysis, 2017-2021

    4.2. Current and Future Market Size Value (US$ Mn) Projections, 2022-2032

        4.2.1. Y-o-Y Growth Trend Analysis

        4.2.2. Absolute $ Opportunity Analysis

5. Global Epiglottitis Treatment Market Analysis 2017-2021 and Forecast 2022-2032, By Drug

    5.1. Introduction / Key Findings

    5.2. Historical Market Size Value (US$ Mn) Analysis By Drug, 2017-2021

    5.3. Current and Future Market Size Value (US$ Mn) Analysis and Forecast By Drug, 2022-2032

        5.3.1. Broad-spectrum Antibiotic

        5.3.2. Targeted Antibiotic

        5.3.3. Steroid Medication

    5.4. Y-o-Y Growth Trend Analysis By Drug, 2017-2021

    5.5. Absolute $ Opportunity Analysis By Drug, 2022-2032

6. Global Epiglottitis Treatment Market Analysis 2017-2021 and Forecast 2022-2032, By Route of Administration

    6.1. Introduction / Key Findings

    6.2. Historical Market Size Value (US$ Mn) Analysis By Route of Administration, 2017-2021

    6.3. Current and Future Market Size Value (US$ Mn) Analysis and Forecast By Route of Administration, 2022-2032

        6.3.1. Oral

        6.3.2. Parental

    6.4. Y-o-Y Growth Trend Analysis By Route of Administration, 2017-2021

    6.5. Absolute $ Opportunity Analysis By Route of Administration, 2022-2032

7. Global Epiglottitis Treatment Market Analysis 2017-2021 and Forecast 2022-2032, By End User

    7.1. Introduction / Key Findings

    7.2. Historical Market Size Value (US$ Mn) Analysis By End User, 2017-2021

    7.3. Current and Future Market Size Value (US$ Mn) Analysis and Forecast By End User, 2022-2032

        7.3.1. Hospitals Pharmacies

        7.3.2. Retail Pharmacies

        7.3.3. Drug Stores

        7.3.4. Clinics

        7.3.5. Online Pharmacies

    7.4. Y-o-Y Growth Trend Analysis By End User, 2017-2021

    7.5. Absolute $ Opportunity Analysis By End User, 2022-2032

8. Global Epiglottitis Treatment Market Analysis 2017-2021 and Forecast 2022-2032, By Region

    8.1. Introduction

    8.2. Historical Market Size Value (US$ Mn) Analysis By Region, 2017-2021

    8.3. Current Market Size Value (US$ Mn) Analysis and Forecast By Region, 2022-2032

        8.3.1. North America

        8.3.2. Latin America

        8.3.3. Europe

        8.3.4. Asia Pacific

        8.3.5. MEA

    8.4. Market Attractiveness Analysis By Region

9. North America Epiglottitis Treatment Market Analysis 2017-2021 and Forecast 2022-2032, By Country

    9.1. Historical Market Size Value (US$ Mn) Trend Analysis By Market Taxonomy, 2017-2021

    9.2. Market Size Value (US$ Mn) Forecast By Market Taxonomy, 2022-2032

        9.2.1. By Country

            9.2.1.1. U.K.

            9.2.1.2. Canada

        9.2.2. By Drug

        9.2.3. By Route of Administration

        9.2.4. By End User

    9.3. Market Attractiveness Analysis

        9.3.1. By Country

        9.3.2. By Drug

        9.3.3. By Route of Administration

        9.3.4. By End User

    9.4. Key Takeaways

10. Latin America Epiglottitis Treatment Market Analysis 2017-2021 and Forecast 2022-2032, By Country

    10.1. Historical Market Size Value (US$ Mn) Trend Analysis By Market Taxonomy, 2017-2021

    10.2. Market Size Value (US$ Mn) Forecast By Market Taxonomy, 2022-2032

        10.2.1. By Country

            10.2.1.1. Brazil

            10.2.1.2. Mexico

            10.2.1.3. Rest of Latin America

        10.2.2. By Drug

        10.2.3. By Route of Administration

        10.2.4. By End User

    10.3. Market Attractiveness Analysis

        10.3.1. By Country

        10.3.2. By Drug

        10.3.3. By Route of Administration

        10.3.4. By End User

    10.4. Key Takeaways

11. Europe Epiglottitis Treatment Market Analysis 2017-2021 and Forecast 2022-2032, By Country

    11.1. Historical Market Size Value (US$ Mn) Trend Analysis By Market Taxonomy, 2017-2021

    11.2. Market Size Value (US$ Mn) Forecast By Market Taxonomy, 2022-2032

        11.2.1. By Country

            11.2.1.1. Germany

            11.2.1.2. U.K.

            11.2.1.3. France

            11.2.1.4. Spain

            11.2.1.5. Italy

            11.2.1.6. Rest of Europe

        11.2.2. By Drug

        11.2.3. By Route of Administration

        11.2.4. By End User

    11.3. Market Attractiveness Analysis

        11.3.1. By Country

        11.3.2. By Drug

        11.3.3. By Route of Administration

        11.3.4. By End User

    11.4. Key Takeaways

12. Asia Pacific Epiglottitis Treatment Market Analysis 2017-2021 and Forecast 2022-2032, By Country

    12.1. Historical Market Size Value (US$ Mn) Trend Analysis By Market Taxonomy, 2017-2021

    12.2. Market Size Value (US$ Mn) Forecast By Market Taxonomy, 2022-2032

        12.2.1. By Country

            12.2.1.1. China

            12.2.1.2. Japan

            12.2.1.3. South Korea

            12.2.1.4. Malaysia

            12.2.1.5. Singapore

            12.2.1.6. Australia

            12.2.1.7. Rest of Asia Pacific

        12.2.2. By Drug

        12.2.3. By Route of Administration

        12.2.4. By End User

    12.3. Market Attractiveness Analysis

        12.3.1. By Country

        12.3.2. By Drug

        12.3.3. By Route of Administration

        12.3.4. By End User

    12.4. Key Takeaways

13. MEA Epiglottitis Treatment Market Analysis 2017-2021 and Forecast 2022-2032, By Country

    13.1. Historical Market Size Value (US$ Mn) Trend Analysis By Market Taxonomy, 2017-2021

    13.2. Market Size Value (US$ Mn) Forecast By Market Taxonomy, 2022-2032

        13.2.1. By Country

            13.2.1.1. GCC Countries

            13.2.1.2. South Africa

            13.2.1.3. Israel

            13.2.1.4. Rest of MEA

        13.2.2. By Drug

        13.2.3. By Route of Administration

        13.2.4. By End User

    13.3. Market Attractiveness Analysis

        13.3.1. By Country

        13.3.2. By Drug

        13.3.3. By Route of Administration

        13.3.4. By End User

    13.4. Key Takeaways

14. Key Countries Epiglottitis Treatment Market Analysis

    14.1. U.K.

        14.1.1. Pricing Analysis

        14.1.2. Market Share Analysis, 2021

            14.1.2.1. By Drug

            14.1.2.2. By Route of Administration

            14.1.2.3. By End User

    14.2. Canada

        14.2.1. Pricing Analysis

        14.2.2. Market Share Analysis, 2021

            14.2.2.1. By Drug

            14.2.2.2. By Route of Administration

            14.2.2.3. By End User

    14.3. Brazil

        14.3.1. Pricing Analysis

        14.3.2. Market Share Analysis, 2021

            14.3.2.1. By Drug

            14.3.2.2. By Route of Administration

            14.3.2.3. By End User

    14.4. Mexico

        14.4.1. Pricing Analysis

        14.4.2. Market Share Analysis, 2021

            14.4.2.1. By Drug

            14.4.2.2. By Route of Administration

            14.4.2.3. By End User

    14.5. Rest of Latin America

        14.5.1. Pricing Analysis

        14.5.2. Market Share Analysis, 2021

            14.5.2.1. By Drug

            14.5.2.2. By Route of Administration

            14.5.2.3. By End User

    14.6. Germany

        14.6.1. Pricing Analysis

        14.6.2. Market Share Analysis, 2021

            14.6.2.1. By Drug

            14.6.2.2. By Route of Administration

            14.6.2.3. By End User

    14.7. U.K.

        14.7.1. Pricing Analysis

        14.7.2. Market Share Analysis, 2021

            14.7.2.1. By Drug

            14.7.2.2. By Route of Administration

            14.7.2.3. By End User

    14.8. France

        14.8.1. Pricing Analysis

        14.8.2. Market Share Analysis, 2021

            14.8.2.1. By Drug

            14.8.2.2. By Route of Administration

            14.8.2.3. By End User

    14.9. Spain

        14.9.1. Pricing Analysis

        14.9.2. Market Share Analysis, 2021

            14.9.2.1. By Drug

            14.9.2.2. By Route of Administration

            14.9.2.3. By End User

    14.10. Italy

        14.10.1. Pricing Analysis

        14.10.2. Market Share Analysis, 2021

            14.10.2.1. By Drug

            14.10.2.2. By Route of Administration

            14.10.2.3. By End User

    14.11. Rest of Europe

        14.11.1. Pricing Analysis

        14.11.2. Market Share Analysis, 2021

            14.11.2.1. By Drug

            14.11.2.2. By Route of Administration

            14.11.2.3. By End User

    14.12. China

        14.12.1. Pricing Analysis

        14.12.2. Market Share Analysis, 2021

            14.12.2.1. By Drug

            14.12.2.2. By Route of Administration

            14.12.2.3. By End User

    14.13. Japan

        14.13.1. Pricing Analysis

        14.13.2. Market Share Analysis, 2021

            14.13.2.1. By Drug

            14.13.2.2. By Route of Administration

            14.13.2.3. By End User

    14.14. South Korea

        14.14.1. Pricing Analysis

        14.14.2. Market Share Analysis, 2021

            14.14.2.1. By Drug

            14.14.2.2. By Route of Administration

            14.14.2.3. By End User

    14.15. Malaysia

        14.15.1. Pricing Analysis

        14.15.2. Market Share Analysis, 2021

            14.15.2.1. By Drug

            14.15.2.2. By Route of Administration

            14.15.2.3. By End User

    14.16. Singapore

        14.16.1. Pricing Analysis

        14.16.2. Market Share Analysis, 2021

            14.16.2.1. By Drug

            14.16.2.2. By Route of Administration

            14.16.2.3. By End User

    14.17. Australia

        14.17.1. Pricing Analysis

        14.17.2. Market Share Analysis, 2021

            14.17.2.1. By Drug

            14.17.2.2. By Route of Administration

            14.17.2.3. By End User

    14.18. Rest of Asia Pacific

        14.18.1. Pricing Analysis

        14.18.2. Market Share Analysis, 2021

            14.18.2.1. By Drug

            14.18.2.2. By Route of Administration

            14.18.2.3. By End User

    14.19. GCC Countries

        14.19.1. Pricing Analysis

        14.19.2. Market Share Analysis, 2021

            14.19.2.1. By Drug

            14.19.2.2. By Route of Administration

            14.19.2.3. By End User

    14.20. South Africa

        14.20.1. Pricing Analysis

        14.20.2. Market Share Analysis, 2021

            14.20.2.1. By Drug

            14.20.2.2. By Route of Administration

            14.20.2.3. By End User

    14.21. Israel

        14.21.1. Pricing Analysis

        14.21.2. Market Share Analysis, 2021

            14.21.2.1. By Drug

            14.21.2.2. By Route of Administration

            14.21.2.3. By End User

    14.22. Rest of MEA

        14.22.1. Pricing Analysis

        14.22.2. Market Share Analysis, 2021

            14.22.2.1. By Drug

            14.22.2.2. By Route of Administration

            14.22.2.3. By End User

15. Market Structure Analysis

    15.1. Competition Dashboard

    15.2. Competition Benchmarking

    15.3. Market Share Analysis of Top Players

        15.3.1. By Regional

        15.3.2. By Drug

        15.3.3. By Route of Administration

        15.3.4. By End User

16. Competition Analysis

    16.1. Competition Deep Dive

        16.1.1. Abbott

            16.1.1.1. Overview

            16.1.1.2. Product Portfolio

            16.1.1.3. Profitability by Market Segments

            16.1.1.4. Sales Footprint

            16.1.1.5. Strategy Overview

                16.1.1.5.1. Marketing Strategy

        16.1.2. Merck & Co., Inc

            16.1.2.1. Overview

            16.1.2.2. Product Portfolio

            16.1.2.3. Profitability by Market Segments

            16.1.2.4. Sales Footprint

            16.1.2.5. Strategy Overview

                16.1.2.5.1. Marketing Strategy

        16.1.3. AstraZeneca

            16.1.3.1. Overview

            16.1.3.2. Product Portfolio

            16.1.3.3. Profitability by Market Segments

            16.1.3.4. Sales Footprint

            16.1.3.5. Strategy Overview

                16.1.3.5.1. Marketing Strategy

        16.1.4. Boehringer Ingelheim International GmbH

            16.1.4.1. Overview

            16.1.4.2. Product Portfolio

            16.1.4.3. Profitability by Market Segments

            16.1.4.4. Sales Footprint

            16.1.4.5. Strategy Overview

                16.1.4.5.1. Marketing Strategy

        16.1.5. Pfizer Inc.

            16.1.5.1. Overview

            16.1.5.2. Product Portfolio

            16.1.5.3. Profitability by Market Segments

            16.1.5.4. Sales Footprint

            16.1.5.5. Strategy Overview

                16.1.5.5.1. Marketing Strategy

        16.1.6. Sanofi

            16.1.6.1. Overview

            16.1.6.2. Product Portfolio

            16.1.6.3. Profitability by Market Segments

            16.1.6.4. Sales Footprint

            16.1.6.5. Strategy Overview

                16.1.6.5.1. Marketing Strategy

        16.1.7. Teva Pharmaceutical Industries Ltd

            16.1.7.1. Overview

            16.1.7.2. Product Portfolio

            16.1.7.3. Profitability by Market Segments

            16.1.7.4. Sales Footprint

            16.1.7.5. Strategy Overview

                16.1.7.5.1. Marketing Strategy

        16.1.8. GlaxoSmithKline Plc

            16.1.8.1. Overview

            16.1.8.2. Product Portfolio

            16.1.8.3. Profitability by Market Segments

            16.1.8.4. Sales Footprint

            16.1.8.5. Strategy Overview

                16.1.8.5.1. Marketing Strategy

        16.1.9. Johnson & Johnson

            16.1.9.1. Overview

            16.1.9.2. Product Portfolio

            16.1.9.3. Profitability by Market Segments

            16.1.9.4. Sales Footprint

            16.1.9.5. Strategy Overview

                16.1.9.5.1. Marketing Strategy

        16.1.10. Roche Holding AG

            16.1.10.1. Overview

            16.1.10.2. Product Portfolio

            16.1.10.3. Profitability by Market Segments

            16.1.10.4. Sales Footprint

            16.1.10.5. Strategy Overview

                16.1.10.5.1. Marketing Strategy

17. Assumptions & Acronyms Used

18. Research Methodology

Don't pay for what you don't need

Customize your report by selecting specific countries or regions and save 30%!

List of Tables

Table 1: Global Epiglottitis Treatment Market Value (US$ Mn) Forecast by Region, 2017-2032

Table 2: Global Epiglottitis Treatment Market Value (US$ Mn) Forecast by Drug, 2017-2032

Table 3: Global Epiglottitis Treatment Market Value (US$ Mn) Forecast by Route of Administration, 2017-2032

Table 4: Global Epiglottitis Treatment Market Value (US$ Mn) Forecast by End User, 2017-2032

Table 5: North America Epiglottitis Treatment Market Value (US$ Mn) Forecast by Country, 2017-2032

Table 6: North America Epiglottitis Treatment Market Value (US$ Mn) Forecast by Drug, 2017-2032

Table 7: North America Epiglottitis Treatment Market Value (US$ Mn) Forecast by Route of Administration, 2017-2032

Table 8: North America Epiglottitis Treatment Market Value (US$ Mn) Forecast by End User, 2017-2032

Table 9: Latin America Epiglottitis Treatment Market Value (US$ Mn) Forecast by Country, 2017-2032

Table 10: Latin America Epiglottitis Treatment Market Value (US$ Mn) Forecast by Drug, 2017-2032

Table 11: Latin America Epiglottitis Treatment Market Value (US$ Mn) Forecast by Route of Administration, 2017-2032

Table 12: Latin America Epiglottitis Treatment Market Value (US$ Mn) Forecast by End User, 2017-2032

Table 13: Europe Epiglottitis Treatment Market Value (US$ Mn) Forecast by Country, 2017-2032

Table 14: Europe Epiglottitis Treatment Market Value (US$ Mn) Forecast by Drug, 2017-2032

Table 15: Europe Epiglottitis Treatment Market Value (US$ Mn) Forecast by Route of Administration, 2017-2032

Table 16: Europe Epiglottitis Treatment Market Value (US$ Mn) Forecast by End User, 2017-2032

Table 17: Asia Pacific Epiglottitis Treatment Market Value (US$ Mn) Forecast by Country, 2017-2032

Table 18: Asia Pacific Epiglottitis Treatment Market Value (US$ Mn) Forecast by Drug, 2017-2032

Table 19: Asia Pacific Epiglottitis Treatment Market Value (US$ Mn) Forecast by Route of Administration, 2017-2032

Table 20: Asia Pacific Epiglottitis Treatment Market Value (US$ Mn) Forecast by End User, 2017-2032

Table 21: MEA Epiglottitis Treatment Market Value (US$ Mn) Forecast by Country, 2017-2032

Table 22: MEA Epiglottitis Treatment Market Value (US$ Mn) Forecast by Drug, 2017-2032

Table 23: MEA Epiglottitis Treatment Market Value (US$ Mn) Forecast by Route of Administration, 2017-2032

Table 24: MEA Epiglottitis Treatment Market Value (US$ Mn) Forecast by End User, 2017-2032
Sabyasachi Ghosh
Sabyasachi Ghosh

Principal Consultant

Talk to Analyst

Find your sweet spots for generating winning opportunities in this market.

List of Charts

Figure 1: Global Epiglottitis Treatment Market Value (US$ Mn) by Drug, 2022-2032

Figure 2: Global Epiglottitis Treatment Market Value (US$ Mn) by Route of Administration, 2022-2032

Figure 3: Global Epiglottitis Treatment Market Value (US$ Mn) by End User, 2022-2032

Figure 4: Global Epiglottitis Treatment Market Value (US$ Mn) by Region, 2022-2032

Figure 5: Global Epiglottitis Treatment Market Value (US$ Mn) Analysis by Region, 2017-2032

Figure 6: Global Epiglottitis Treatment Market Value Share (%) and BPS Analysis by Region, 2022-2032

Figure 7: Global Epiglottitis Treatment Market Y-o-Y Growth (%) Projections by Region, 2022-2032

Figure 8: Global Epiglottitis Treatment Market Value (US$ Mn) Analysis by Drug, 2017-2032

Figure 9: Global Epiglottitis Treatment Market Value Share (%) and BPS Analysis by Drug, 2022-2032

Figure 10: Global Epiglottitis Treatment Market Y-o-Y Growth (%) Projections by Drug, 2022-2032

Figure 11: Global Epiglottitis Treatment Market Value (US$ Mn) Analysis by Route of Administration, 2017-2032

Figure 12: Global Epiglottitis Treatment Market Value Share (%) and BPS Analysis by Route of Administration, 2022-2032

Figure 13: Global Epiglottitis Treatment Market Y-o-Y Growth (%) Projections by Route of Administration, 2022-2032

Figure 14: Global Epiglottitis Treatment Market Value (US$ Mn) Analysis by End User, 2017-2032

Figure 15: Global Epiglottitis Treatment Market Value Share (%) and BPS Analysis by End User, 2022-2032

Figure 16: Global Epiglottitis Treatment Market Y-o-Y Growth (%) Projections by End User, 2022-2032

Figure 17: Global Epiglottitis Treatment Market Attractiveness by Drug, 2022-2032

Figure 18: Global Epiglottitis Treatment Market Attractiveness by Route of Administration, 2022-2032

Figure 19: Global Epiglottitis Treatment Market Attractiveness by End User, 2022-2032

Figure 20: Global Epiglottitis Treatment Market Attractiveness by Region, 2022-2032

Figure 21: North America Epiglottitis Treatment Market Value (US$ Mn) by Drug, 2022-2032

Figure 22: North America Epiglottitis Treatment Market Value (US$ Mn) by Route of Administration, 2022-2032

Figure 23: North America Epiglottitis Treatment Market Value (US$ Mn) by End User, 2022-2032

Figure 24: North America Epiglottitis Treatment Market Value (US$ Mn) by Country, 2022-2032

Figure 25: North America Epiglottitis Treatment Market Value (US$ Mn) Analysis by Country, 2017-2032

Figure 26: North America Epiglottitis Treatment Market Value Share (%) and BPS Analysis by Country, 2022-2032

Figure 27: North America Epiglottitis Treatment Market Y-o-Y Growth (%) Projections by Country, 2022-2032

Figure 28: North America Epiglottitis Treatment Market Value (US$ Mn) Analysis by Drug, 2017-2032

Figure 29: North America Epiglottitis Treatment Market Value Share (%) and BPS Analysis by Drug, 2022-2032

Figure 30: North America Epiglottitis Treatment Market Y-o-Y Growth (%) Projections by Drug, 2022-2032

Figure 31: North America Epiglottitis Treatment Market Value (US$ Mn) Analysis by Route of Administration, 2017-2032

Figure 32: North America Epiglottitis Treatment Market Value Share (%) and BPS Analysis by Route of Administration, 2022-2032

Figure 33: North America Epiglottitis Treatment Market Y-o-Y Growth (%) Projections by Route of Administration, 2022-2032

Figure 34: North America Epiglottitis Treatment Market Value (US$ Mn) Analysis by End User, 2017-2032

Figure 35: North America Epiglottitis Treatment Market Value Share (%) and BPS Analysis by End User, 2022-2032

Figure 36: North America Epiglottitis Treatment Market Y-o-Y Growth (%) Projections by End User, 2022-2032

Figure 37: North America Epiglottitis Treatment Market Attractiveness by Drug, 2022-2032

Figure 38: North America Epiglottitis Treatment Market Attractiveness by Route of Administration, 2022-2032

Figure 39: North America Epiglottitis Treatment Market Attractiveness by End User, 2022-2032

Figure 40: North America Epiglottitis Treatment Market Attractiveness by Country, 2022-2032

Figure 41: Latin America Epiglottitis Treatment Market Value (US$ Mn) by Drug, 2022-2032

Figure 42: Latin America Epiglottitis Treatment Market Value (US$ Mn) by Route of Administration, 2022-2032

Figure 43: Latin America Epiglottitis Treatment Market Value (US$ Mn) by End User, 2022-2032

Figure 44: Latin America Epiglottitis Treatment Market Value (US$ Mn) by Country, 2022-2032

Figure 45: Latin America Epiglottitis Treatment Market Value (US$ Mn) Analysis by Country, 2017-2032

Figure 46: Latin America Epiglottitis Treatment Market Value Share (%) and BPS Analysis by Country, 2022-2032

Figure 47: Latin America Epiglottitis Treatment Market Y-o-Y Growth (%) Projections by Country, 2022-2032

Figure 48: Latin America Epiglottitis Treatment Market Value (US$ Mn) Analysis by Drug, 2017-2032

Figure 49: Latin America Epiglottitis Treatment Market Value Share (%) and BPS Analysis by Drug, 2022-2032

Figure 50: Latin America Epiglottitis Treatment Market Y-o-Y Growth (%) Projections by Drug, 2022-2032

Figure 51: Latin America Epiglottitis Treatment Market Value (US$ Mn) Analysis by Route of Administration, 2017-2032

Figure 52: Latin America Epiglottitis Treatment Market Value Share (%) and BPS Analysis by Route of Administration, 2022-2032

Figure 53: Latin America Epiglottitis Treatment Market Y-o-Y Growth (%) Projections by Route of Administration, 2022-2032

Figure 54: Latin America Epiglottitis Treatment Market Value (US$ Mn) Analysis by End User, 2017-2032

Figure 55: Latin America Epiglottitis Treatment Market Value Share (%) and BPS Analysis by End User, 2022-2032

Figure 56: Latin America Epiglottitis Treatment Market Y-o-Y Growth (%) Projections by End User, 2022-2032

Figure 57: Latin America Epiglottitis Treatment Market Attractiveness by Drug, 2022-2032

Figure 58: Latin America Epiglottitis Treatment Market Attractiveness by Route of Administration, 2022-2032

Figure 59: Latin America Epiglottitis Treatment Market Attractiveness by End User, 2022-2032

Figure 60: Latin America Epiglottitis Treatment Market Attractiveness by Country, 2022-2032

Figure 61: Europe Epiglottitis Treatment Market Value (US$ Mn) by Drug, 2022-2032

Figure 62: Europe Epiglottitis Treatment Market Value (US$ Mn) by Route of Administration, 2022-2032

Figure 63: Europe Epiglottitis Treatment Market Value (US$ Mn) by End User, 2022-2032

Figure 64: Europe Epiglottitis Treatment Market Value (US$ Mn) by Country, 2022-2032

Figure 65: Europe Epiglottitis Treatment Market Value (US$ Mn) Analysis by Country, 2017-2032

Figure 66: Europe Epiglottitis Treatment Market Value Share (%) and BPS Analysis by Country, 2022-2032

Figure 67: Europe Epiglottitis Treatment Market Y-o-Y Growth (%) Projections by Country, 2022-2032

Figure 68: Europe Epiglottitis Treatment Market Value (US$ Mn) Analysis by Drug, 2017-2032

Figure 69: Europe Epiglottitis Treatment Market Value Share (%) and BPS Analysis by Drug, 2022-2032

Figure 70: Europe Epiglottitis Treatment Market Y-o-Y Growth (%) Projections by Drug, 2022-2032

Figure 71: Europe Epiglottitis Treatment Market Value (US$ Mn) Analysis by Route of Administration, 2017-2032

Figure 72: Europe Epiglottitis Treatment Market Value Share (%) and BPS Analysis by Route of Administration, 2022-2032

Figure 73: Europe Epiglottitis Treatment Market Y-o-Y Growth (%) Projections by Route of Administration, 2022-2032

Figure 74: Europe Epiglottitis Treatment Market Value (US$ Mn) Analysis by End User, 2017-2032

Figure 75: Europe Epiglottitis Treatment Market Value Share (%) and BPS Analysis by End User, 2022-2032

Figure 76: Europe Epiglottitis Treatment Market Y-o-Y Growth (%) Projections by End User, 2022-2032

Figure 77: Europe Epiglottitis Treatment Market Attractiveness by Drug, 2022-2032

Figure 78: Europe Epiglottitis Treatment Market Attractiveness by Route of Administration, 2022-2032

Figure 79: Europe Epiglottitis Treatment Market Attractiveness by End User, 2022-2032

Figure 80: Europe Epiglottitis Treatment Market Attractiveness by Country, 2022-2032

Figure 81: Asia Pacific Epiglottitis Treatment Market Value (US$ Mn) by Drug, 2022-2032

Figure 82: Asia Pacific Epiglottitis Treatment Market Value (US$ Mn) by Route of Administration, 2022-2032

Figure 83: Asia Pacific Epiglottitis Treatment Market Value (US$ Mn) by End User, 2022-2032

Figure 84: Asia Pacific Epiglottitis Treatment Market Value (US$ Mn) by Country, 2022-2032

Figure 85: Asia Pacific Epiglottitis Treatment Market Value (US$ Mn) Analysis by Country, 2017-2032

Figure 86: Asia Pacific Epiglottitis Treatment Market Value Share (%) and BPS Analysis by Country, 2022-2032

Figure 87: Asia Pacific Epiglottitis Treatment Market Y-o-Y Growth (%) Projections by Country, 2022-2032

Figure 88: Asia Pacific Epiglottitis Treatment Market Value (US$ Mn) Analysis by Drug, 2017-2032

Figure 89: Asia Pacific Epiglottitis Treatment Market Value Share (%) and BPS Analysis by Drug, 2022-2032

Figure 90: Asia Pacific Epiglottitis Treatment Market Y-o-Y Growth (%) Projections by Drug, 2022-2032

Figure 91: Asia Pacific Epiglottitis Treatment Market Value (US$ Mn) Analysis by Route of Administration, 2017-2032

Figure 92: Asia Pacific Epiglottitis Treatment Market Value Share (%) and BPS Analysis by Route of Administration, 2022-2032

Figure 93: Asia Pacific Epiglottitis Treatment Market Y-o-Y Growth (%) Projections by Route of Administration, 2022-2032

Figure 94: Asia Pacific Epiglottitis Treatment Market Value (US$ Mn) Analysis by End User, 2017-2032

Figure 95: Asia Pacific Epiglottitis Treatment Market Value Share (%) and BPS Analysis by End User, 2022-2032

Figure 96: Asia Pacific Epiglottitis Treatment Market Y-o-Y Growth (%) Projections by End User, 2022-2032

Figure 97: Asia Pacific Epiglottitis Treatment Market Attractiveness by Drug, 2022-2032

Figure 98: Asia Pacific Epiglottitis Treatment Market Attractiveness by Route of Administration, 2022-2032

Figure 99: Asia Pacific Epiglottitis Treatment Market Attractiveness by End User, 2022-2032

Figure 100: Asia Pacific Epiglottitis Treatment Market Attractiveness by Country, 2022-2032

Figure 101: MEA Epiglottitis Treatment Market Value (US$ Mn) by Drug, 2022-2032

Figure 102: MEA Epiglottitis Treatment Market Value (US$ Mn) by Route of Administration, 2022-2032

Figure 103: MEA Epiglottitis Treatment Market Value (US$ Mn) by End User, 2022-2032

Figure 104: MEA Epiglottitis Treatment Market Value (US$ Mn) by Country, 2022-2032

Figure 105: MEA Epiglottitis Treatment Market Value (US$ Mn) Analysis by Country, 2017-2032

Figure 106: MEA Epiglottitis Treatment Market Value Share (%) and BPS Analysis by Country, 2022-2032

Figure 107: MEA Epiglottitis Treatment Market Y-o-Y Growth (%) Projections by Country, 2022-2032

Figure 108: MEA Epiglottitis Treatment Market Value (US$ Mn) Analysis by Drug, 2017-2032

Figure 109: MEA Epiglottitis Treatment Market Value Share (%) and BPS Analysis by Drug, 2022-2032

Figure 110: MEA Epiglottitis Treatment Market Y-o-Y Growth (%) Projections by Drug, 2022-2032

Figure 111: MEA Epiglottitis Treatment Market Value (US$ Mn) Analysis by Route of Administration, 2017-2032

Figure 112: MEA Epiglottitis Treatment Market Value Share (%) and BPS Analysis by Route of Administration, 2022-2032

Figure 113: MEA Epiglottitis Treatment Market Y-o-Y Growth (%) Projections by Route of Administration, 2022-2032

Figure 114: MEA Epiglottitis Treatment Market Value (US$ Mn) Analysis by End User, 2017-2032

Figure 115: MEA Epiglottitis Treatment Market Value Share (%) and BPS Analysis by End User, 2022-2032

Figure 116: MEA Epiglottitis Treatment Market Y-o-Y Growth (%) Projections by End User, 2022-2032

Figure 117: MEA Epiglottitis Treatment Market Attractiveness by Drug, 2022-2032

Figure 118: MEA Epiglottitis Treatment Market Attractiveness by Route of Administration, 2022-2032

Figure 119: MEA Epiglottitis Treatment Market Attractiveness by End User, 2022-2032

Figure 120: MEA Epiglottitis Treatment Market Attractiveness by Country, 2022-2032

Recommendations

Healthcare

Phototherapy Treatment Market

Published : November 2023

Healthcare

Hypercalcemia Treatment Market

Published : September 2023

Healthcare

Meningitis Treatment Market

Published : November 2022

Healthcare

Hemophilia Treatment Market

Published : June 2022

Explore Healthcare Insights

View Reports

Epiglottitis Treatment Market