Floor Marking Tape Market Size and Share Forecast Outlook 2025 to 2035

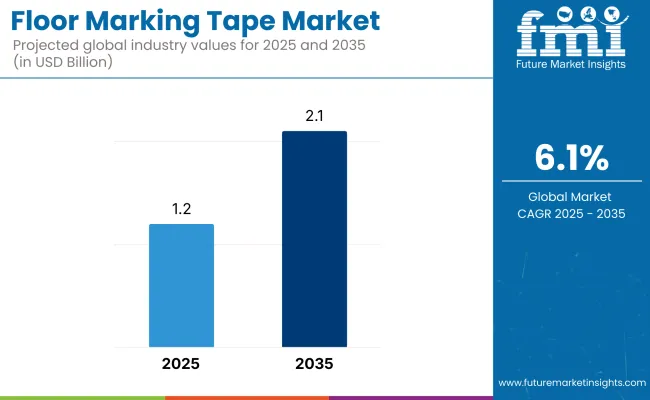
The floor marking tape market is projected to expand from USD 1.2 billion in 2025 to USD 2.1 billion by 2035, reflecting a total increase of USD 0.9 billion over the ten-year period. This represents a 75.0% overall growth, supported by a compound annual growth rate (CAGR) of 6.1%. Over the forecast timeline, the market grows by a 1.7 multiple.
Quick Stats for Floor Marking Tape Market

  • Market Value (2025): USD 1.2 billion
  • Market Forecast Value (2035): USD 2.1 billion
  • Market Forecast CAGR: 6.1%
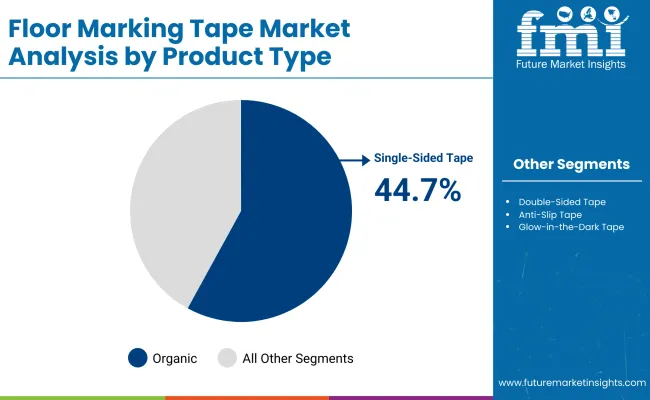
  • Leading Segment in 2025: Single-Sided Tape (44.7%)
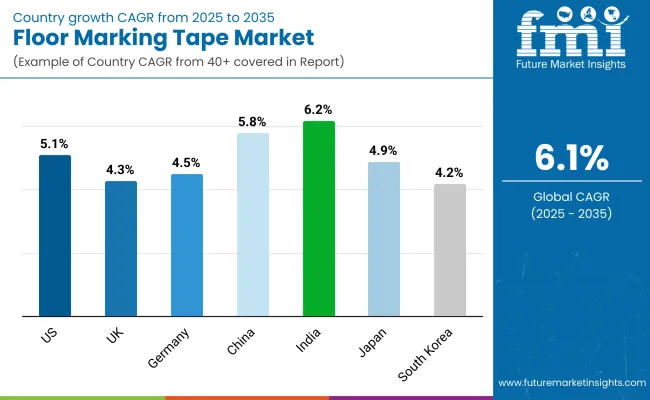
  • Key Growth Regions: Asia-Pacific (India is the fastest-growing market with 6.2 % CAGR)
  • Top Key Players: 3M Company, Brady Corporation, Shurtape Technologies, LLC, Intertape Polymer Group Inc., Avery Dennison Corporation, and Tesa SE.

Floor Marking Tape Market

Metric Value
Industry Size (2025E) USD 1.2 billion
Industry Value (2035F) USD 2.1 billion
CAGR (2025 to 2035) 6.1%

In the first half of the decade (2025–2030), the market rises from USD 1.2 billion to USD 1.6 billion, contributing USD 0.4 billion, or 44.4% of the decade’s total growth. Demand in this phase is fueled by occupational safety regulations and lean manufacturing practices, with applications expanding in warehouses, manufacturing plants, and logistics hubs. PVC-based tapes with high-visibility pigments dominate due to their durability, slip resistance, and compliance with OSHA and ANSI color codes.

In the second half (2030–2035), the market advances from USD 1.6 billion to USD 2.1 billion, contributing USD 0.5 billion, or 55.6% of the total growth. Adoption accelerates with the rise of automation in industrial facilities and the integration of smart, sensor-embedded tapes that can track traffic patterns and wear over time. Eco-friendly adhesive formulations and recyclable substrates gain traction as sustainability policies tighten across global manufacturing and warehousing sectors.

From 2020 to 2024, the floor marking tape market grew from USD 0.9 billion to USD 1.1 billion, driven by hardware-centric adoption in industrial facilities, warehouses, and commercial spaces to improve safety, organization, and compliance with workplace regulations. During this period, the competitive landscape was dominated by adhesive tape manufacturers controlling nearly 70% of total revenue, with leaders such as 3M Company, Brady Corporation, and Shurtape Technologies, LLC focusing on high-durability PVC and vinyl tapes designed for heavy-traffic areas. Competitive differentiation relied on adhesion strength, abrasion resistance, and compliance with OSHA or ISO safety color codes, while software-enabled safety management systems were often bundled with broader facility solutions rather than acting as standalone revenue drivers. Service-based models, including installation and on-site audits, contributed less than 10% of total market value as most users opted for in-house application.

Demand for floor marking tape will expand to USD 2.1 billion in 2035, and the revenue mix will shift as digital integration, smart floor labeling, and customized safety solutions grow to over 40% share. Traditional adhesive manufacturers face increasing competition from innovation-focused players offering IoT-enabled floor sensors, RFID-embedded labels, and AR-compatible safety guides.

Why the Floor Marking Tape Market is growing?

Increasing emphasis on workplace safety, lean manufacturing practices, and regulatory compliance is driving the growth of the floor marking tape market. These tapes are widely used in industrial, commercial, and institutional environments to designate pathways, mark hazardous zones, and improve visual communication on production floors. The global shift toward safer and more organized work environments, reinforced by occupational health and safety regulations, is accelerating adoption.

PVC, vinyl, and polyester-based floor marking tapes have gained popularity due to their durability, adhesive strength, and resistance to abrasion, chemicals, and moisture. Advances in high-visibility color printing, reflective finishes, and anti-slip coatings have improved functionality, making these tapes suitable for both indoor and outdoor use. Easy application and removal without damaging surfaces also contribute to their operational efficiency.

Segmental Analysis

The market is segmented by product type, material type, adhesive type, application, end-use industry, and region. Product type includes single-sided tape, double-sided tape, anti-slip tape, glow-in-the-dark tape, and reflective tape, each serving distinct visibility, safety, and functional requirements across industrial and public environments. Material type segmentation comprises polyvinyl chloride (PVC), vinyl, polypropylene (PP), polyester (PET), and polylactic acid, offering a balance between durability, flexibility, and environmental performance.

Adhesive type includes rubber-based adhesive, acrylic-based adhesive, silicone-based adhesive, and pressure-sensitive adhesive, enabling varied bonding strengths and surface compatibility. Application areas include aisle marking, hazardous zone marking, floor identification, workflow & lean 5S guidance, sports courts/event floors, and social distancing marking, reflecting both operational efficiency and safety compliance functions. End-use industries include manufacturing facilities, warehouses & logistics, food & beverage, pharmaceuticals, and healthcare, where visual communication and hazard prevention are critical. Regionally, the market is segmented into North America, Europe, Asia-Pacific, Latin America, and the Middle East & Africa.
Single-Sided Tape Segment Leads on Ease of Application and Cost Efficiency

Floor Marking Tape Market By Product Type

The single-sided tape segment is expected to account for the highest share of 44.7% in 2025. Adoption is fueled by its fast, low-skill installation, minimal downtime, and straightforward replacement versus paints or epoxies. Facilities favor single-sided formats for routine maintenance, quick layout changes, and seasonal reconfiguration especially in high-throughput plants and distribution centers where every minute of line time matters.

Beyond speed, single-sided floor tapes deliver reliable adhesion, clear color coding, and clean removability that protects floors. They support lean/5S initiatives with crisp edges and high-visibility pigments, and they’re compatible with textured, sealed, or polished concrete. As EHS teams standardize visual management, single-sided solutions remain the default for scalable, compliant floor demarcation.
Manufacturing Facilities Drive Demand on Safety Compliance and Lean Workflows

Floor Marking Tape Market By End User

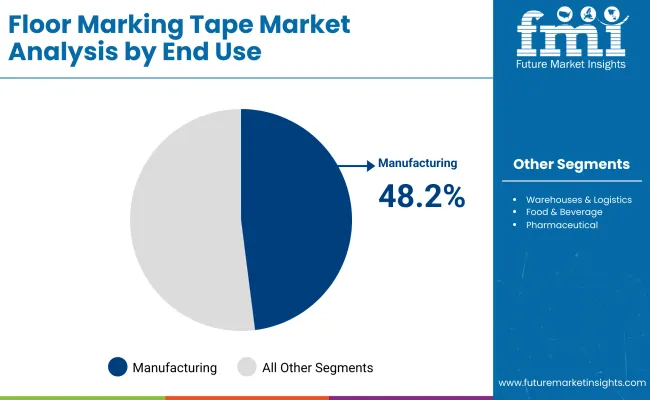
The manufacturing facilities end-use segment is projected to lead with a 48.2% share in 2025. Plants rely on floor marking to delineate workcells, pedestrian aisles, forklift lanes, WIP staging, and emergency egress routes core controls under audit by safety and quality teams. Frequent line changeovers and SKU proliferation increase the need for tapes that can be applied, repositioned, and removed without surface damage.

With continuous improvement programs and visual factory standards, manufacturers prioritize durable, color-stable tapes that resist abrasion, chemicals, and cart traffic. High-contrast patterns (chevrons, hatchings) and pre-printed messages further streamline training and compliance. As factories digitize, floor markings also serve as physical anchors for connected workflows (e.g., AGV paths, kanban zones), reinforcing their central role on the shop floor.

PVC Material Preferred for Durability, Conformability, and Color Stability

Polyvinyl chloride (PVC) is expected to lead the material type category with a 46.2% share in 2025. PVC tapes balance tensile strength with flexibility, enabling tight turns around corners, posts, and drains while maintaining edge integrity. Their dense, pigmented films deliver long-lasting color and gloss retention under harsh lighting and frequent washdowns.

PVC also offers scuff resistance and shock absorption that protect graphics from pallet jacks and forklifts. Coupled with strong adhesives, PVC constructions provide a high-service-life option for warehouses and plants seeking fewer replacements and predictable TCO. Availability in a wide palette and custom prints makes PVC the go-to for standardized visual management systems.

Rubber-Based Adhesives Win on High Tack and Cold-Floor Performance

Rubber-based adhesive systems are projected to lead the adhesive type category at 37.3% in 2025. They deliver immediate, aggressive tack that bonds quickly even on challenging substrates or slightly dusty surfaces minimizing prep time and enabling rapid reopen of traffic lanes.

These formulations perform well on colder floors where acrylics can struggle to wet out, making them ideal for ambient swings and dock areas. While acrylics offer longer-term UV/chemical resistance in some settings, rubber-based systems remain the preferred choice where fast grip, quick installs, and reliable adhesion under rolling loads are the priority.

Aisle Marking Remains Core Use Case for Wayfinding and Traffic Separation

The aisle marking application is anticipated to hold a 28.1% share in 2025, reflecting its foundational role in warehouse and production layouts. Clear aisles reduce congestion, improve picker efficiency, and separate industrial vehicles from pedestrians key to reducing recordable incidents.

Programs aligned with 5S and visual workplace standards rely on consistent aisle colors, widths, and symbols for instant comprehension. As e‑commerce and just‑in‑time operations intensify material flow, durable aisle tapesoften paired with corner, T-, and L‑markersenable fast reconfiguration and continuous compliance without paint fumes or curing time.

What are the Drivers, Restraints, and Key Trends of the Floor Marking Tape Market?

Adhesion challenges on uneven surfaces and durability concerns in high-traffic areas limit broader application, even as demand grows across manufacturing, warehousing, healthcare, and public infrastructure for cost-effective, high-visibility floor marking solutions that enhance safety, navigation, and compliance.

Safety Compliance and Lean Manufacturing Practices Driving Adoption

Floor marking tape usage is expanding rapidly in industrial and commercial settings due to its role in workplace organization, hazard identification, and compliance with safety regulations. In manufacturing plants, tapes are integral to 5S and Lean practices demarcating work zones, walkways, and storage areas to streamline operations and reduce accidents. Warehouses use color-coded markings to guide forklift traffic and indicate hazard zones, while healthcare facilities employ them for patient flow management.

Surface Adhesion and Wear Resistance Limitations

Despite their utility, floor marking tapes face performance limitations in certain environments. On porous, dusty, or oily surfaces, adhesion can weaken, leading to premature peeling or lifting. In heavy-traffic zones especially where forklifts or pallet jacks operate abrasion can reduce tape visibility and lifespan, requiring frequent replacement. Exposure to moisture, chemicals, or extreme temperatures can further degrade adhesive performance and material integrity.

Advancements in High-performance Materials and Customization Options

A leading trend in the market is the development of high-durability PVC, vinyl, and polyester tapes with reinforced adhesives designed for extreme industrial conditions. Manufacturers are offering products with enhanced slip resistance, UV stability, and chemical resistance to meet the demands of both indoor and outdoor applications. Custom printing capabilities now allow companies to integrate logos, QR codes, or bilingual safety messages directly onto the tape surface, expanding functionality beyond visual guidance.
Analysis of Floor Marking Tape Market by Key Countries

Floor Marking Tape Market Country

The floor marking tape market is expanding steadily as industrial safety compliance, warehouse organization, and lean manufacturing principles gain traction. Demand is supported by manufacturing modernization, regulatory workplace safety mandates, and the rise of e-commerce logistics. Emerging economies such as India and China are driving rapid adoption in manufacturing and warehousing, while developed countries are focusing on high-durability, chemical-resistant, and OSHA/ISO-compliant tape solutions.

Sales Outlook for Floor Marking Tape United States

The USA market is expected to grow at a CAGR of 5.1%, driven by OSHA-compliant floor marking in manufacturing facilities, logistics hubs, and retail warehouses. Custom color-coded tapes for safety zones, equipment marking, and lean workflows are widely adopted.

  • Manufacturers adopt high-bond, abrasion-resistant tapes for heavy traffic areas.
  • E-commerce warehouses implement visual safety floor layouts for compliance.
  • Suppliers develop UV- and chemical-resistant tapes for industrial environments.

Growth Outlook for Floor Marking Tape Germany

Germany’s market is forecast to expand at a CAGR of 4.5%, supported by strict workplace safety regulations and lean manufacturing standards in automotive and engineering sectors. Demand for eco-friendly adhesive technologies is also rising.

  • Factories use floor tapes to demarcate safety zones and assembly workflows.
  • Sustainable adhesives gain traction in ISO-certified plants.
  • Automotive lines deploy color-coded, anti-slip tapes for operator safety.

Expansion Outlook for Floor Marking Tape United Kingdom

The UK market is projected to grow at a CAGR of 4.3%, fueled by adoption in healthcare facilities, logistics hubs, and food processing units. High-visibility tapes with anti-bacterial coatings are emerging as a niche growth area.

  • Hospitals use antimicrobial floor marking tapes for hygiene compliance.
  • Cold storage units adopt temperature-resistant tapes for safety zones.
  • Distribution centers employ removable tapes for seasonal layout changes.

Sales Outlook for Floor Marking Tape China

China’s market is set to grow at a CAGR of 5.8%, driven by large-scale manufacturing, smart warehouse development, and industrial safety upgrades. Local production ensures affordability and fast customization.

  • Manufacturers integrate floor markings with automated guided vehicle (AGV) routes.
  • Electronics plants use ESD-safe floor tapes in assembly zones.
  • Local brands offer budget-friendly yet durable adhesive options.

Growth Outlook for Floor Marking Tape India

India’s market is expected to grow at the highest CAGR of 6.2%, driven by MSME factory safety modernization and government workplace compliance drives. Affordable adhesive tapes are being adopted in both organized and unorganized sectors.

  • MSMEs adopt low-cost floor marking tapes for visual factory management.
  • Automotive plants use heat-resistant tapes in welding and assembly zones.
  • Warehouses implement heavy-duty tapes for pallet movement pathways.

Growth Outlook for Floor Marking Tape Japan

Japan’s market is projected to expand at a CAGR of 4.9%, supported by precision manufacturing, robotics integration, and high workplace safety culture. Long-lasting, thin-profile tapes are in demand for cleanroom and electronics assembly areas.

  • Cleanrooms use low-particulate, residue-free floor tapes for zoning.
  • Robotic assembly lines integrate machine-readable tape markers.
  • Aerospace and electronics plants prefer thin yet durable materials.

Expansion Outlook for Floor Marking Tape South Korea

South Korea’s market is set to grow at a CAGR of 4.2%, with demand fueled by semiconductor fabs, automotive plants, and logistics automation. Tapes with advanced adhesive technology that can withstand chemical exposure are preferred.

  • Semiconductor facilities use chemical-resistant floor markings in clean zones.
  • Automotive plants adopt ergonomic, high-grip tapes for assembly areas.
  • Logistics hubs use reflective tapes to support automated navigation.

Competitive Landscape of Floor Marking Tape Market

The floor marking tape market is moderately fragmented, with global adhesive product leaders, safety identification specialists, and industrial marking solution providers competing across manufacturing, logistics, retail, and public infrastructure sectors. Global leaders such as 3M Company, Brady Corporation, and Avery Dennison Corporation hold significant market share, driven by high-durability adhesive technologies, compliance with OSHA and ANSI safety standards, and integration with visual workplace management systems. Their strategies increasingly emphasize heavy-duty PVC and polyester backing, high-visibility color coding, and solvent-free adhesive innovations for sustainability.

Established mid-sized players including Intertape Polymer Group Inc., Shurtape Technologies, LLC, and Tesa SE are advancing adoption through abrasion-resistant tapes, removable and repositionable adhesive formats, and customizable print options for branding or hazard communication. These companies serve both industrial and commercial environments, offering products optimized for quick installation, minimal downtime, and compatibility with diverse floor surfaces.

Key Development of Floor Marking Tape Market

  • Jun 25, 2025, Avery Dennison unveils industry-first RFID label recognized by APR for compatibility with PET recycling stream.
  • Jul 30, 2025, Shurtape® Launches AP 251 Acrylic Packaging Tape to Expand Custom Print Offerings

Floor Marking Tape Market

  • Key Companies
  • 3M Company
  • Brady Corporation
  • Shurtape Technologies, LLC
  • Intertape Polymer Group Inc.
  • Avery Dennison Corporation
  • Tesa SE

Scope of the Report

Item Value
Quantitative Units USD 1.2 Billion
By Product Type Single-Sided Tape, Double-Sided Tape, Anti-Slip Tape, Glow-in-the-Dark Tape, and Reflective Tape
By Material Type Polyvinyl Chloride (PVC), Vinyl, Polypropylene (PP), Polyester (PET), and Polylactic Acid
By Adhesive Type Rubber-Based Adhesive, Acrylic-Based Adhesive, Silicone-Based Adhesive, and Pressure-Sensitive Adhesive
By Application Aisle Marking, Hazardous Zone Marking, Floor Identification, Workflow & Lean 5S Guidance, Sports Courts / Event Floors, and Social Distancing Marking
By End-Use Industry Manufacturing Facilities, Warehouses & Logistics, Food & Beverage, Pharmaceuticals, and Healthcare
Key Companies Profiled 3M Company, Brady Corporation, Shurtape Technologies, LLC, Intertape Polymer Group Inc., Avery Dennison Corporation, and Tesa SE
Additional Attributes Rising demand for high-durability tapes in industrial safety compliance, increasing adoption in workflow optimization and lean manufacturing setups, growth in anti-slip and reflective tapes for hazardous zones, strong demand from logistics and warehouse automation, expansion in sports and event marking applications, innovation in eco-friendly adhesive formulations, regulatory focus on workplace safety standards, surge in customized print tapes for brand visibility, increasing replacement demand in high-traffic facilities, and strong market presence in North America, Europe, and Asia-Pacific

Key Segments

By Product Type:

  • Single-Sided Tape
  • Double-Sided Tape
  • Anti-Slip Tape
  • Glow-in-the-Dark Tape
  • Reflective Tape

By Material Type:

  • Polyvinyl Chloride (PVC)
  • Vinyl
  • Polypropylene (PP)
  • Polyester (PET)
  • Polylactic Acid

By Adhesive Type:

  • Rubber-Based Adhesive
  • Acrylic-Based Adhesive
  • Silicone-Based Adhesive
  • Pressure-Sensitive Adhesive

By Application:

  • Aisle Marking
  • Hazardous Zone Marking
  • Floor Identification
  • Workflow & Lean 5S Guidance
  • Sports Courts / Event Floors
  • Social Distancing Marking

By End-Use Industry:

  • Manufacturing Facilities
  • Warehouses & Logistics
  • Food & Beverage
  • Pharmaceuticals
  • Healthcare

By Region:

  • North America
  • Europe
  • Asia-Pacific
  • Latin America
  • Middle East & Africa

Table of Content

  1. Executive Summary
    • Global Market Outlook
    • Demand-side Trends
    • Supply-side Trends
    • Technology Roadmap Analysis
    • Analysis and Recommendations
  2. Market Overview
    • Market Coverage / Taxonomy
    • Market Definition / Scope / Limitations
  3. Market Background
    • Market Dynamics
      • Drivers
      • Restraints
      • Opportunity
      • Trends
    • Scenario Forecast
      • Demand in Optimistic Scenario
      • Demand in Likely Scenario
      • Demand in Conservative Scenario
    • Opportunity Map Analysis
    • Product Life Cycle Analysis
    • Supply Chain Analysis
      • Supply Side Participants and their Roles
        • Producers
        • Mid-Level Participants (Traders/ Agents/ Brokers)
        • Wholesalers and Distributors
      • Value Added and Value Created at Node in the Supply Chain
      • List of Raw Material Suppliers
      • List of Existing and Potential Buyer’s
    • Investment Feasibility Matrix
    • Value Chain Analysis
      • Profit Margin Analysis
      • Wholesalers and Distributors
      • Retailers
    • PESTLE and Porter’s Analysis
    • Regulatory Landscape
      • By Key Regions
      • By Key Countries
    • Regional Parent Market Outlook
    • Production and Consumption Statistics
    • Import and Export Statistics
  4. Global Market Analysis 2020 to 2024 and Forecast, 2025 to 2035
    • Historical Market Size Value (USD Million) & Volume (Units) Analysis, 2020 to 2024
    • Current and Future Market Size Value (USD Million) & Volume (Units) Projections, 2025 to 2035
      • Y-o-Y Growth Trend Analysis
      • Absolute $ Opportunity Analysis
  5. GlobalAnalysis 2020 to 2024 and Forecast 2025 to 2035
  6. Global Market Analysis 2020 to 2024 and Forecast 2025 to 2035, By Product Type
    • Introduction / Key Findings
    • Historical Market Size Value (USD Million) & Volume (Units) Analysis By Product Type, 2020 to 2024
    • Current and Future Market Size Value (USD Million) & Volume (Units) Analysis and Forecast By Product Type, 2025 to 2035
      • Single-Sided Tape
      • Double-Sided Tape
      • Anti-Slip Tape
      • Glow-in-the-Dark Tape
      • Reflective Tape
    • Y-o-Y Growth Trend Analysis By Product Type, 2020 to 2024
    • Absolute $ Opportunity Analysis By Product Type, 2025 to 2035
  7. Global Market Analysis 2020 to 2024 and Forecast 2025 to 2035, By Material Type
    • Introduction / Key Findings
    • Historical Market Size Value (USD Million) & Volume (Units) Analysis By Material Type, 2020 to 2024
    • Current and Future Market Size Value (USD Million) & Volume (Units) Analysis and Forecast By Material Type, 2025 to 2035
      • Polyvinyl Chloride (PVC)
      • Vinyl
      • Polypropylene (PP)
      • Polyester (PET)
      • Polylactic Acid
    • Y-o-Y Growth Trend Analysis By Material Type, 2020 to 2024
    • Absolute $ Opportunity Analysis By Material Type, 2025 to 2035
  8. Global Market Analysis 2020 to 2024 and Forecast 2025 to 2035, By Adhesive Type
    • Introduction / Key Findings
    • Historical Market Size Value (USD Million) & Volume (Units) Analysis By Adhesive Type, 2020 to 2024
    • Current and Future Market Size Value (USD Million) & Volume (Units) Analysis and Forecast By Adhesive Type, 2025 to 2035
      • Rubber-Based Adhesive
      • Acrylic-Based Adhesive
      • Silicone-Based Adhesive
      • Pressure-Sensitive Adhesive
    • Y-o-Y Growth Trend Analysis By Adhesive Type, 2020 to 2024
    • Absolute $ Opportunity Analysis By Adhesive Type, 2025 to 2035
  9. Global Market Analysis 2020 to 2024 and Forecast 2025 to 2035, By Application
    • Introduction / Key Findings
    • Historical Market Size Value (USD Million) & Volume (Units) Analysis By Application, 2020 to 2024
    • Current and Future Market Size Value (USD Million) & Volume (Units) Analysis and Forecast By Application, 2025 to 2035
      • Aisle Marking
      • Hazardous Zone Marking
      • Floor Identification
      • Workflow & Lean 5S Guidance
      • Sports Courts / Event Floors
      • Social Distancing Marking
    • Y-o-Y Growth Trend Analysis By Application, 2020 to 2024
    • Absolute $ Opportunity Analysis By Application, 2025 to 2035
  10. Global Market Analysis 2020 to 2024 and Forecast 2025 to 2035, By End-Use Industry
    • Introduction / Key Findings
    • Historical Market Size Value (USD Million) & Volume (Units) Analysis By End-Use Industry, 2020 to 2024
    • Current and Future Market Size Value (USD Million) & Volume (Units) Analysis and Forecast By End-Use Industry, 2025 to 2035
      • Manufacturing Facilities
      • Warehouses & Logistics
      • Food & Beverage
      • Pharmaceuticals
      • Healthcare
    • Y-o-Y Growth Trend Analysis By End-Use Industry, 2020 to 2024
    • Absolute $ Opportunity Analysis By End-Use Industry, 2025 to 2035
  11. Global Market Analysis 2020 to 2024 and Forecast 2025 to 2035, By Region
    • Introduction
    • Historical Market Size Value (USD Million) & Volume (Units) Analysis By Region, 2020 to 2024
    • Current Market Size Value (USD Million) & Volume (Units) Analysis and Forecast By Region, 2025 to 2035
      • North America
      • Latin America
      • Europe
      • East Asia
      • South Asia
      • Oceania
      • MEA
    • Market Attractiveness Analysis By Region
  12. North America Market Analysis 2020 to 2024 and Forecast 2025 to 2035, By Country
    • Historical Market Size Value (USD Million) & Volume (Units) Trend Analysis By Market Taxonomy, 2020 to 2024
    • Market Size Value (USD Million) & Volume (Units) Forecast By Market Taxonomy, 2025 to 2035
      • By Country
        • USA
        • Canada
      • By Product Type
      • By Material Type
      • By Adhesive Type
      • By Application
      • By End-Use Industry
    • Market Attractiveness Analysis
      • By Country
      • By Product Type
      • By Material Type
      • By Adhesive Type
      • By Application
      • By End-Use Industry
    • Key Takeaways
  13. Latin America Market Analysis 2020 to 2024 and Forecast 2025 to 2035, By Country
    • Historical Market Size Value (USD Million) & Volume (Units) Trend Analysis By Market Taxonomy, 2020 to 2024
    • Market Size Value (USD Million) & Volume (Units) Forecast By Market Taxonomy, 2025 to 2035
      • By Country
        • Brazil
        • Mexico
        • Argentina
        • Chile
        • Peru
        • Rest of Latin America
      • By Product Type
      • By Material Type
      • By Adhesive Type
      • By Application
      • By End-Use Industry
    • Market Attractiveness Analysis
      • By Country
      • By Product Type
      • By Material Type
      • By Adhesive Type
      • By Application
      • By End-Use Industry
    • Key Takeaways
  14. Europe Market Analysis 2020 to 2024 and Forecast 2025 to 2035, By Country
    • Historical Market Size Value (USD Million) & Volume (Units) Trend Analysis By Market Taxonomy, 2020 to 2024
    • Market Size Value (USD Million) & Volume (Units) Forecast By Market Taxonomy, 2025 to 2035
      • By Country
        • Germany
        • Italy
        • France
        • UK
        • Spain
        • Russia
        • BENELUX
        • Rest of Europe
      • By Product Type
      • By Material Type
      • By Adhesive Type
      • By Application
      • By End-Use Industry
    • Market Attractiveness Analysis
      • By Country
      • By Product Type
      • By Material Type
      • By Adhesive Type
      • By Application
      • By End-Use Industry
    • Key Takeaways
  15. East Asia Market Analysis 2020 to 2024 and Forecast 2025 to 2035, By Country
    • Historical Market Size Value (USD Million) & Volume (Units) Trend Analysis By Market Taxonomy, 2020 to 2024
    • Market Size Value (USD Million) & Volume (Units) Forecast By Market Taxonomy, 2025 to 2035
      • By Country
        • China
        • Japan
        • South Korea
      • By Product Type
      • By Material Type
      • By Adhesive Type
      • By Application
      • By End-Use Industry
    • Market Attractiveness Analysis
      • By Country
      • By Product Type
      • By Material Type
      • By Adhesive Type
      • By Application
      • By End-Use Industry
    • Key Takeaways
  16. South Asia Market Analysis 2020 to 2024 and Forecast 2025 to 2035, By Country
    • Historical Market Size Value (USD Million) & Volume (Units) Trend Analysis By Market Taxonomy, 2020 to 2024
    • Market Size Value (USD Million) & Volume (Units) Forecast By Market Taxonomy, 2025 to 2035
      • By Country
        • India
        • Thailand
        • Malaysia
        • Indonesia
        • Rest of South Asia
      • By Product Type
      • By Material Type
      • By Adhesive Type
      • By Application
      • By End-Use Industry
    • Market Attractiveness Analysis
      • By Country
      • By Product Type
      • By Material Type
      • By Adhesive Type
      • By Application
      • By End-Use Industry
    • Key Takeaways
  17. Oceania Market Analysis 2020 to 2024 and Forecast 2025 to 2035, By Country
    • Historical Market Size Value (USD Million) & Volume (Units) Trend Analysis By Market Taxonomy, 2020 to 2024
    • Market Size Value (USD Million) & Volume (Units) Forecast By Market Taxonomy, 2025 to 2035
      • By Country
        • Australia
        • New Zealand
      • By Product Type
      • By Material Type
      • By Adhesive Type
      • By Application
      • By End-Use Industry
    • Market Attractiveness Analysis
      • By Country
      • By Product Type
      • By Material Type
      • By Adhesive Type
      • By Application
      • By End-Use Industry
    • Key Takeaways
  18. MEA Market Analysis 2020 to 2024 and Forecast 2025 to 2035, By Country
    • Historical Market Size Value (USD Million) & Volume (Units) Trend Analysis By Market Taxonomy, 2020 to 2024
    • Market Size Value (USD Million) & Volume (Units) Forecast By Market Taxonomy, 2025 to 2035
      • By Country
        • GCC
        • Rest of MEA
      • By Product Type
      • By Material Type
      • By Adhesive Type
      • By Application
      • By End-Use Industry
    • Market Attractiveness Analysis
      • By Country
      • By Product Type
      • By Material Type
      • By Adhesive Type
      • By Application
      • By End-Use Industry
    • Key Takeaways
  19. Key Countries Market Analysis
    • USA
      • Pricing Analysis
      • Market Share Analysis, 2024
        • By Product Type
        • By Material Type
        • By Adhesive Type
        • By Application
        • By End-Use Industry
    • Canada
      • Pricing Analysis
      • Market Share Analysis, 2024
        • By Product Type
        • By Material Type
        • By Adhesive Type
        • By Application
        • By End-Use Industry
    • Brazil
      • Pricing Analysis
      • Market Share Analysis, 2024
        • By Product Type
        • By Material Type
        • By Adhesive Type
        • By Application
        • By End-Use Industry
    • Mexico
      • Pricing Analysis
      • Market Share Analysis, 2024
        • By Product Type
        • By Material Type
        • By Adhesive Type
        • By Application
        • By End-Use Industry
    • Argentina
      • Pricing Analysis
      • Market Share Analysis, 2024
        • By Product Type
        • By Material Type
        • By Adhesive Type
        • By Application
        • By End-Use Industry
  20. Market Structure Analysis
    • Competition Dashboard
    • Competition Benchmarking
    • Market Share Analysis of Top Players
      • By Regional
      • By Product Type
      • By Material Type
      • By Adhesive Type
      • By Application
      • By End-Use Industry
  21. Competition Analysis
    • Competition Deep Dive
      • 3M Company
        • Overview
        • Product Portfolio
        • Profitability by Market Segments (Product/Age /Sales Channel/Region)
        • Sales Footprint
        • Strategy Overview
          • Marketing Strategy
          • Product Strategy
          • Channel Strategy
      • Brady Corporation
        • Overview
        • Product Portfolio
        • Profitability by Market Segments (Product/Age /Sales Channel/Region)
        • Sales Footprint
        • Strategy Overview
          • Marketing Strategy
          • Product Strategy
          • Channel Strategy
      • Shurtape Technologies, LLC
        • Overview
        • Product Portfolio
        • Profitability by Market Segments (Product/Age /Sales Channel/Region)
        • Sales Footprint
        • Strategy Overview
          • Marketing Strategy
          • Product Strategy
          • Channel Strategy
      • Intertape Polymer Group Inc.
        • Overview
        • Product Portfolio
        • Profitability by Market Segments (Product/Age /Sales Channel/Region)
        • Sales Footprint
        • Strategy Overview
          • Marketing Strategy
          • Product Strategy
          • Channel Strategy
      • Avery Dennison Corporation
        • Overview
        • Product Portfolio
        • Profitability by Market Segments (Product/Age /Sales Channel/Region)
        • Sales Footprint
        • Strategy Overview
          • Marketing Strategy
          • Product Strategy
          • Channel Strategy
      • Tesa SE
        • Overview
        • Product Portfolio
        • Profitability by Market Segments (Product/Age /Sales Channel/Region)
        • Sales Footprint
        • Strategy Overview
          • Marketing Strategy
          • Product Strategy
          • Channel Strategy
  22. Assumptions & Acronyms Used
  23. Research Methodology

List of Tables

  • Table 1: Global Market Value (USD Million) Forecast by Region, 2020-2035
  • Table 2: Global Market Volume (Units) Forecast by Region, 2020-2035
  • Table 3: Global Market Value (USD Million) Forecast By Product Type, 2020-2035
  • Table 4: Global Market Volume (Units) Forecast By Product Type, 2020-2035
  • Table 5: Global Market Value (USD Million) Forecast By Material Type, 2020-2035
  • Table 6: Global Market Volume (Units) Forecast By Material Type, 2020-2035
  • Table 7: Global Market Value (USD Million) Forecast By Adhesive Type, 2020-2035
  • Table 8: Global Market Volume (Units) Forecast By Adhesive Type, 2020-2035
  • Table 9: Global Market Value (USD Million) Forecast By Application, 2020-2035
  • Table 10: Global Market Volume (Units) Forecast By Application, 2020-2035
  • Table 11: Global Market Value (USD Million) Forecast By End-Use Industry, 2020-2035
  • Table 12: Global Market Volume (Units) Forecast By End-Use Industry, 2020-2035
  • Table 13: North America Market Value (USD Million) Forecast by Country, 2020-2035
  • Table 14: North America Market Volume (Units) Forecast by Country, 2020-2035
  • Table 15: North America Market Value (USD Million) Forecast By Product Type, 2020-2035
  • Table 16: North America Market Volume (Units) Forecast By Product Type, 2020-2035
  • Table 17: North America Market Value (USD Million) Forecast By Material Type, 2020-2035
  • Table 18: North America Market Volume (Units) Forecast By Material Type, 2020-2035
  • Table 19: North America Market Value (USD Million) Forecast By Adhesive Type, 2020-2035
  • Table 20: North America Market Volume (Units) Forecast By Adhesive Type, 2020-2035
  • Table 21: North America Market Value (USD Million) Forecast By Application, 2020-2035
  • Table 22: North America Market Volume (Units) Forecast By Application, 2020-2035
  • Table 23: North America Market Value (USD Million) Forecast By End-Use Industry, 2020-2035
  • Table 24: North America Market Volume (Units) Forecast By End-Use Industry, 2020-2035
  • Table 25: Latin America Market Value (USD Million) Forecast by Country, 2020-2035
  • Table 26: Latin America Market Volume (Units) Forecast by Country, 2020-2035
  • Table 27: Latin America Market Value (USD Million) Forecast By Product Type, 2020-2035
  • Table 28: Latin America Market Volume (Units) Forecast By Product Type, 2020-2035
  • Table 29: Latin America Market Value (USD Million) Forecast By Material Type, 2020-2035
  • Table 30: Latin America Market Volume (Units) Forecast By Material Type, 2020-2035
  • Table 31: Latin America Market Value (USD Million) Forecast By Adhesive Type, 2020-2035
  • Table 32: Latin America Market Volume (Units) Forecast By Adhesive Type, 2020-2035
  • Table 33: Latin America Market Value (USD Million) Forecast By Application, 2020-2035
  • Table 34: Latin America Market Volume (Units) Forecast By Application, 2020-2035
  • Table 35: Latin America Market Value (USD Million) Forecast By End-Use Industry, 2020-2035
  • Table 36: Latin America Market Volume (Units) Forecast By End-Use Industry, 2020-2035
  • Table 37: Europe Market Value (USD Million) Forecast by Country, 2020-2035
  • Table 38: Europe Market Volume (Units) Forecast by Country, 2020-2035
  • Table 39: Europe Market Value (USD Million) Forecast By Product Type, 2020-2035
  • Table 40: Europe Market Volume (Units) Forecast By Product Type, 2020-2035
  • Table 41: Europe Market Value (USD Million) Forecast By Material Type, 2020-2035
  • Table 42: Europe Market Volume (Units) Forecast By Material Type, 2020-2035
  • Table 43: Europe Market Value (USD Million) Forecast By Adhesive Type, 2020-2035
  • Table 44: Europe Market Volume (Units) Forecast By Adhesive Type, 2020-2035
  • Table 45: Europe Market Value (USD Million) Forecast By Application, 2020-2035
  • Table 46: Europe Market Volume (Units) Forecast By Application, 2020-2035
  • Table 47: Europe Market Value (USD Million) Forecast By End-Use Industry, 2020-2035
  • Table 48: Europe Market Volume (Units) Forecast By End-Use Industry, 2020-2035
  • Table 49: East Asia Market Value (USD Million) Forecast by Country, 2020-2035
  • Table 50: East Asia Market Volume (Units) Forecast by Country, 2020-2035
  • Table 51: East Asia Market Value (USD Million) Forecast By Product Type, 2020-2035
  • Table 52: East Asia Market Volume (Units) Forecast By Product Type, 2020-2035
  • Table 53: East Asia Market Value (USD Million) Forecast By Material Type, 2020-2035
  • Table 54: East Asia Market Volume (Units) Forecast By Material Type, 2020-2035
  • Table 55: East Asia Market Value (USD Million) Forecast By Adhesive Type, 2020-2035
  • Table 56: East Asia Market Volume (Units) Forecast By Adhesive Type, 2020-2035
  • Table 57: East Asia Market Value (USD Million) Forecast By Application, 2020-2035
  • Table 58: East Asia Market Volume (Units) Forecast By Application, 2020-2035
  • Table 59: East Asia Market Value (USD Million) Forecast By End-Use Industry, 2020-2035
  • Table 60: East Asia Market Volume (Units) Forecast By End-Use Industry, 2020-2035
  • Table 61: South Asia Market Value (USD Million) Forecast by Country, 2020-2035
  • Table 62: South Asia Market Volume (Units) Forecast by Country, 2020-2035
  • Table 63: South Asia Market Value (USD Million) Forecast By Product Type, 2020-2035
  • Table 64: South Asia Market Volume (Units) Forecast By Product Type, 2020-2035
  • Table 65: South Asia Market Value (USD Million) Forecast By Material Type, 2020-2035
  • Table 66: South Asia Market Volume (Units) Forecast By Material Type, 2020-2035
  • Table 67: South Asia Market Value (USD Million) Forecast By Adhesive Type, 2020-2035
  • Table 68: South Asia Market Volume (Units) Forecast By Adhesive Type, 2020-2035
  • Table 69: South Asia Market Value (USD Million) Forecast By Application, 2020-2035
  • Table 70: South Asia Market Volume (Units) Forecast By Application, 2020-2035
  • Table 71: South Asia Market Value (USD Million) Forecast By End-Use Industry, 2020-2035
  • Table 72: South Asia Market Volume (Units) Forecast By End-Use Industry, 2020-2035
  • Table 73: Oceania Market Value (USD Million) Forecast by Country, 2020-2035
  • Table 74: Oceania Market Volume (Units) Forecast by Country, 2020-2035
  • Table 75: Oceania Market Value (USD Million) Forecast By Product Type, 2020-2035
  • Table 76: Oceania Market Volume (Units) Forecast By Product Type, 2020-2035
  • Table 77: Oceania Market Value (USD Million) Forecast By Material Type, 2020-2035
  • Table 78: Oceania Market Volume (Units) Forecast By Material Type, 2020-2035
  • Table 79: Oceania Market Value (USD Million) Forecast By Adhesive Type, 2020-2035
  • Table 80: Oceania Market Volume (Units) Forecast By Adhesive Type, 2020-2035
  • Table 81: Oceania Market Value (USD Million) Forecast By Application, 2020-2035
  • Table 82: Oceania Market Volume (Units) Forecast By Application, 2020-2035
  • Table 83: Oceania Market Value (USD Million) Forecast By End-Use Industry, 2020-2035
  • Table 84: Oceania Market Volume (Units) Forecast By End-Use Industry, 2020-2035
  • Table 85: MEA Market Value (USD Million) Forecast by Country, 2020-2035
  • Table 86: MEA Market Volume (Units) Forecast by Country, 2020-2035
  • Table 87: MEA Market Value (USD Million) Forecast By Product Type, 2020-2035
  • Table 88: MEA Market Volume (Units) Forecast By Product Type, 2020-2035
  • Table 89: MEA Market Value (USD Million) Forecast By Material Type, 2020-2035
  • Table 90: MEA Market Volume (Units) Forecast By Material Type, 2020-2035
  • Table 91: MEA Market Value (USD Million) Forecast By Adhesive Type, 2020-2035
  • Table 92: MEA Market Volume (Units) Forecast By Adhesive Type, 2020-2035
  • Table 93: MEA Market Value (USD Million) Forecast By Application, 2020-2035
  • Table 94: MEA Market Volume (Units) Forecast By Application, 2020-2035
  • Table 95: MEA Market Value (USD Million) Forecast By End-Use Industry, 2020-2035
  • Table 96: MEA Market Volume (Units) Forecast By End-Use Industry, 2020-2035

List of Figures

  • Figure 1: Global Market Volume (Units) Forecast 2020-2035
  • Figure 2: Global Market Pricing Analysis
  • Figure 3: Global Market Value (USD Million) Forecast 2020-2035
  • Figure 4: Global Market Value Share and BPS Analysis By Product Type, 2025 and 2035
  • Figure 5: Global Market Y-o-Y Growth Comparison By Product Type, 2025-2035
  • Figure 6: Global Market Attractiveness Analysis By Product Type
  • Figure 7: Global Market Value Share and BPS Analysis By Material Type, 2025 and 2035
  • Figure 8: Global Market Y-o-Y Growth Comparison By Material Type, 2025-2035
  • Figure 9: Global Market Attractiveness Analysis By Material Type
  • Figure 10: Global Market Value Share and BPS Analysis By Adhesive Type, 2025 and 2035
  • Figure 11: Global Market Y-o-Y Growth Comparison By Adhesive Type, 2025-2035
  • Figure 12: Global Market Attractiveness Analysis By Adhesive Type
  • Figure 13: Global Market Value Share and BPS Analysis By Application, 2025 and 2035
  • Figure 14: Global Market Y-o-Y Growth Comparison By Application, 2025-2035
  • Figure 15: Global Market Attractiveness Analysis By Application
  • Figure 16: Global Market Value Share and BPS Analysis By End-Use Industry, 2025 and 2035
  • Figure 17: Global Market Y-o-Y Growth Comparison By End-Use Industry, 2025-2035
  • Figure 18: Global Market Attractiveness Analysis By End-Use Industry
  • Figure 19: Global Market Value (USD Million) Share and BPS Analysis by Region, 2025 and 2035
  • Figure 20: Global Market Y-o-Y Growth Comparison by Region, 2025-2035
  • Figure 21: Global Market Attractiveness Analysis by Region
  • Figure 22: North America Market Incremental $ Opportunity, 2025-2035
  • Figure 23: Latin America Market Incremental $ Opportunity, 2025-2035
  • Figure 24: Europe Market Incremental $ Opportunity, 2025-2035
  • Figure 25: East Asia Market Incremental $ Opportunity, 2025-2035
  • Figure 26: South Asia Market Incremental $ Opportunity, 2025-2035
  • Figure 27: Oceania Market Incremental $ Opportunity, 2025-2035
  • Figure 28: MEA Market Incremental $ Opportunity, 2025-2035
  • Figure 29: North America Market Value Share and BPS Analysis by Country, 2025 and 2035
  • Figure 30: North America Market Value Share and BPS Analysis By Product Type, 2025 and 2035
  • Figure 31: North America Market Y-o-Y Growth Comparison By Product Type, 2025-2035
  • Figure 32: North America Market Attractiveness Analysis By Product Type
  • Figure 33: North America Market Value Share and BPS Analysis By Material Type, 2025 and 2035
  • Figure 34: North America Market Y-o-Y Growth Comparison By Material Type, 2025-2035
  • Figure 35: North America Market Attractiveness Analysis By Material Type
  • Figure 36: North America Market Value Share and BPS Analysis By Adhesive Type, 2025 and 2035
  • Figure 37: North America Market Y-o-Y Growth Comparison By Adhesive Type, 2025-2035
  • Figure 38: North America Market Attractiveness Analysis By Adhesive Type
  • Figure 39: North America Market Value Share and BPS Analysis By Application, 2025 and 2035
  • Figure 40: North America Market Y-o-Y Growth Comparison By Application, 2025-2035
  • Figure 41: North America Market Attractiveness Analysis By Application
  • Figure 42: North America Market Value Share and BPS Analysis By End-Use Industry, 2025 and 2035
  • Figure 43: North America Market Y-o-Y Growth Comparison By End-Use Industry, 2025-2035
  • Figure 44: North America Market Attractiveness Analysis By End-Use Industry
  • Figure 45: Latin America Market Value Share and BPS Analysis by Country, 2025 and 2035
  • Figure 46: Latin America Market Value Share and BPS Analysis By Product Type, 2025 and 2035
  • Figure 47: Latin America Market Y-o-Y Growth Comparison By Product Type, 2025-2035
  • Figure 48: Latin America Market Attractiveness Analysis By Product Type
  • Figure 49: Latin America Market Value Share and BPS Analysis By Material Type, 2025 and 2035
  • Figure 50: Latin America Market Y-o-Y Growth Comparison By Material Type, 2025-2035
  • Figure 51: Latin America Market Attractiveness Analysis By Material Type
  • Figure 52: Latin America Market Value Share and BPS Analysis By Adhesive Type, 2025 and 2035
  • Figure 53: Latin America Market Y-o-Y Growth Comparison By Adhesive Type, 2025-2035
  • Figure 54: Latin America Market Attractiveness Analysis By Adhesive Type
  • Figure 55: Latin America Market Value Share and BPS Analysis By Application, 2025 and 2035
  • Figure 56: Latin America Market Y-o-Y Growth Comparison By Application, 2025-2035
  • Figure 57: Latin America Market Attractiveness Analysis By Application
  • Figure 58: Latin America Market Value Share and BPS Analysis By End-Use Industry, 2025 and 2035
  • Figure 59: Latin America Market Y-o-Y Growth Comparison By End-Use Industry, 2025-2035
  • Figure 60: Latin America Market Attractiveness Analysis By End-Use Industry
  • Figure 61: Europe Market Value Share and BPS Analysis by Country, 2025 and 2035
  • Figure 62: Europe Market Value Share and BPS Analysis By Product Type, 2025 and 2035
  • Figure 63: Europe Market Y-o-Y Growth Comparison By Product Type, 2025-2035
  • Figure 64: Europe Market Attractiveness Analysis By Product Type
  • Figure 65: Europe Market Value Share and BPS Analysis By Material Type, 2025 and 2035
  • Figure 66: Europe Market Y-o-Y Growth Comparison By Material Type, 2025-2035
  • Figure 67: Europe Market Attractiveness Analysis By Material Type
  • Figure 68: Europe Market Value Share and BPS Analysis By Adhesive Type, 2025 and 2035
  • Figure 69: Europe Market Y-o-Y Growth Comparison By Adhesive Type, 2025-2035
  • Figure 70: Europe Market Attractiveness Analysis By Adhesive Type
  • Figure 71: Europe Market Value Share and BPS Analysis By Application, 2025 and 2035
  • Figure 72: Europe Market Y-o-Y Growth Comparison By Application, 2025-2035
  • Figure 73: Europe Market Attractiveness Analysis By Application
  • Figure 74: Europe Market Value Share and BPS Analysis By End-Use Industry, 2025 and 2035
  • Figure 75: Europe Market Y-o-Y Growth Comparison By End-Use Industry, 2025-2035
  • Figure 76: Europe Market Attractiveness Analysis By End-Use Industry
  • Figure 77: East Asia Market Value Share and BPS Analysis by Country, 2025 and 2035
  • Figure 78: East Asia Market Value Share and BPS Analysis By Product Type, 2025 and 2035
  • Figure 79: East Asia Market Y-o-Y Growth Comparison By Product Type, 2025-2035
  • Figure 80: East Asia Market Attractiveness Analysis By Product Type
  • Figure 81: East Asia Market Value Share and BPS Analysis By Material Type, 2025 and 2035
  • Figure 82: East Asia Market Y-o-Y Growth Comparison By Material Type, 2025-2035
  • Figure 83: East Asia Market Attractiveness Analysis By Material Type
  • Figure 84: East Asia Market Value Share and BPS Analysis By Adhesive Type, 2025 and 2035
  • Figure 85: East Asia Market Y-o-Y Growth Comparison By Adhesive Type, 2025-2035
  • Figure 86: East Asia Market Attractiveness Analysis By Adhesive Type
  • Figure 87: East Asia Market Value Share and BPS Analysis By Application, 2025 and 2035
  • Figure 88: East Asia Market Y-o-Y Growth Comparison By Application, 2025-2035
  • Figure 89: East Asia Market Attractiveness Analysis By Application
  • Figure 90: East Asia Market Value Share and BPS Analysis By End-Use Industry, 2025 and 2035
  • Figure 91: East Asia Market Y-o-Y Growth Comparison By End-Use Industry, 2025-2035
  • Figure 92: East Asia Market Attractiveness Analysis By End-Use Industry
  • Figure 93: South Asia Market Value Share and BPS Analysis by Country, 2025 and 2035
  • Figure 94: South Asia Market Value Share and BPS Analysis By Product Type, 2025 and 2035
  • Figure 95: South Asia Market Y-o-Y Growth Comparison By Product Type, 2025-2035
  • Figure 96: South Asia Market Attractiveness Analysis By Product Type
  • Figure 97: South Asia Market Value Share and BPS Analysis By Material Type, 2025 and 2035
  • Figure 98: South Asia Market Y-o-Y Growth Comparison By Material Type, 2025-2035
  • Figure 99: South Asia Market Attractiveness Analysis By Material Type
  • Figure 100: South Asia Market Value Share and BPS Analysis By Adhesive Type, 2025 and 2035
  • Figure 101: South Asia Market Y-o-Y Growth Comparison By Adhesive Type, 2025-2035
  • Figure 102: South Asia Market Attractiveness Analysis By Adhesive Type
  • Figure 103: South Asia Market Value Share and BPS Analysis By Application, 2025 and 2035
  • Figure 104: South Asia Market Y-o-Y Growth Comparison By Application, 2025-2035
  • Figure 105: South Asia Market Attractiveness Analysis By Application
  • Figure 106: South Asia Market Value Share and BPS Analysis By End-Use Industry, 2025 and 2035
  • Figure 107: South Asia Market Y-o-Y Growth Comparison By End-Use Industry, 2025-2035
  • Figure 108: South Asia Market Attractiveness Analysis By End-Use Industry
  • Figure 109: Oceania Market Value Share and BPS Analysis by Country, 2025 and 2035
  • Figure 110: Oceania Market Value Share and BPS Analysis By Product Type, 2025 and 2035
  • Figure 111: Oceania Market Y-o-Y Growth Comparison By Product Type, 2025-2035
  • Figure 112: Oceania Market Attractiveness Analysis By Product Type
  • Figure 113: Oceania Market Value Share and BPS Analysis By Material Type, 2025 and 2035
  • Figure 114: Oceania Market Y-o-Y Growth Comparison By Material Type, 2025-2035
  • Figure 115: Oceania Market Attractiveness Analysis By Material Type
  • Figure 116: Oceania Market Value Share and BPS Analysis By Adhesive Type, 2025 and 2035
  • Figure 117: Oceania Market Y-o-Y Growth Comparison By Adhesive Type, 2025-2035
  • Figure 118: Oceania Market Attractiveness Analysis By Adhesive Type
  • Figure 119: Oceania Market Value Share and BPS Analysis By Application, 2025 and 2035
  • Figure 120: Oceania Market Y-o-Y Growth Comparison By Application, 2025-2035
  • Figure 121: Oceania Market Attractiveness Analysis By Application
  • Figure 122: Oceania Market Value Share and BPS Analysis By End-Use Industry, 2025 and 2035
  • Figure 123: Oceania Market Y-o-Y Growth Comparison By End-Use Industry, 2025-2035
  • Figure 124: Oceania Market Attractiveness Analysis By End-Use Industry
  • Figure 125: MEA Market Value Share and BPS Analysis by Country, 2025 and 2035
  • Figure 126: MEA Market Value Share and BPS Analysis By Product Type, 2025 and 2035
  • Figure 127: MEA Market Y-o-Y Growth Comparison By Product Type, 2025-2035
  • Figure 128: MEA Market Attractiveness Analysis By Product Type
  • Figure 129: MEA Market Value Share and BPS Analysis By Material Type, 2025 and 2035
  • Figure 130: MEA Market Y-o-Y Growth Comparison By Material Type, 2025-2035
  • Figure 131: MEA Market Attractiveness Analysis By Material Type
  • Figure 132: MEA Market Value Share and BPS Analysis By Adhesive Type, 2025 and 2035
  • Figure 133: MEA Market Y-o-Y Growth Comparison By Adhesive Type, 2025-2035
  • Figure 134: MEA Market Attractiveness Analysis By Adhesive Type
  • Figure 135: MEA Market Value Share and BPS Analysis By Application, 2025 and 2035
  • Figure 136: MEA Market Y-o-Y Growth Comparison By Application, 2025-2035
  • Figure 137: MEA Market Attractiveness Analysis By Application
  • Figure 138: MEA Market Value Share and BPS Analysis By End-Use Industry, 2025 and 2035
  • Figure 139: MEA Market Y-o-Y Growth Comparison By End-Use Industry, 2025-2035
  • Figure 140: MEA Market Attractiveness Analysis By End-Use Industry
  • Figure 141: Global Market - Tier Structure Analysis
  • Figure 142: Global Market - Company Share Analysis

Frequently Asked Questions

How big is the floor marking tape market in 2025?

The global floor marking tape market is estimated to be valued at USD 1.2 billion in 2025.

What will be the size of the floor marking tape market in 2035?

The market size for the floor marking tape market is projected to reach USD 2.1 billion by 2035.

How much will be the floor marking tape market growth between 2025 and 2035?

The floor marking tape market is expected to grow at a CAGR of 6.1% between 2025 and 2035.

What are the key product types in the floor marking tape market?

The key product types in the floor marking tape market include single-sided tape, double-sided tape, reflective tape, and anti-slip marking tape.

Which product segment is expected to contribute significant share in the floor marking tape market in 2025?

In terms of product type, the single-sided tape segment is expected to account for the highest share of 44.7% in the floor marking tape market in 2025.

Explore Similar Insights

Future Market Insights

Floor Marking Tape Market