Food Thickening Agents Market
Market Insights on Food Thickening Agents covering sales outlook, demand forecast & up-to-date key trends
Food Thickeners Agents Market by Source (Plant, Seaweed, Microbial, Animal, Synthetic) & Region - Forecast 2022 - 2032
Food Thickeners Agents Market - Overview
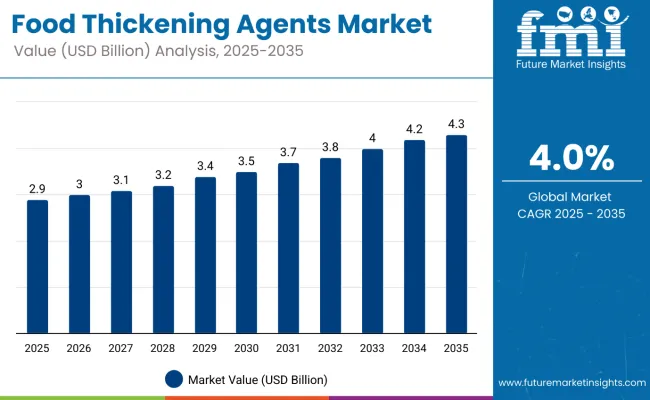
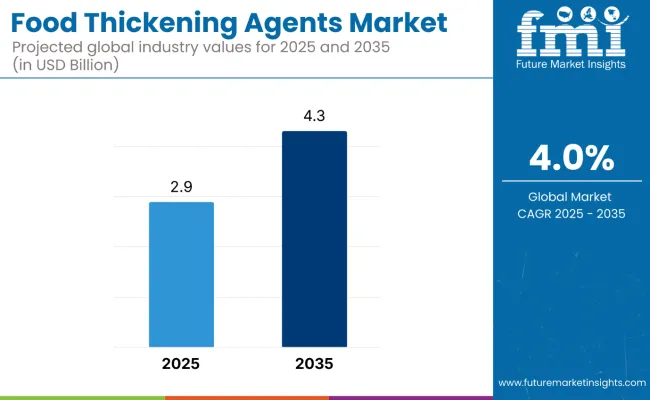
[350 Pages Report] The global food thickeners agents market size is estimated to be USD 2.6 Bn in 2022 and is expected to grow at a compounded annual growth rate (CAGR) of 3.8% from 2022 to 2032 and reach a valuation of USD 3.8 Bn by 2032 end.
Attribute |
Details |
Market Size Value in 2022 |
USD 2.6 Bn |
Market Forecast Value in 2032 |
USD 3.8 Bn |
Global Growth Rate |
3.8% |
Forecast Period |
2022-2032 |
Consumer preferences are constantly varying, and there is a continual shift toward convenience foods. Factors such as a busy lifestyle, the retail industry's increasing traction, introduction of new conveniently packaged food products along with added nutritional benefits, and high demand for ready-to-eat products are all driving market revenue growth for processed foods.
Market expansion is being fuelled by a rise in global exports and imports, as well as trade operations associated to processed foods, all of which are aimed at enhancing and maintaining food quality and cleanliness.
The ability of agar gels to survive extreme temps is boosting their appeal and choice in the confectionery and baking business as a stabiliser and thickening in pie icings and fillings. Agars developed from Gracilaria chilensis, in particular, are commonly employed in high-sugar confectionary, such as fruit sweets. Because agar has no flavour and has no effect on the taste of foods, its use in various food and beverage items is growing.
During the forecast period, rising demand for dressings and sauces is likely to fuel market expansion. Hydrocolloids are thickening agents used in sauces. Alginates, locust bean gum, and starches are widely used to replace synthetic waxes like sorbitan monostearate and polyoxyethylene. Alginates, locust bean gum, and xanthan gum are used to thicken dressings, whereas starch is used to thicken sauces. Various thickeners, including gum Arabic, are employed in sauces and dressings depending on thickener accessibility. Multi-functional flours are used as thickening ingredients in commercial sauces.
In the near future, rising demand for non-alcoholic beverages is likely to boost market revenue growth. In a variety of beverage applications, food thickeners such as xanthan gum, agar, alginate, and CMC are often used. Aside from that, thickeners like arabinogalactan are used by numerous beverage manufacturers (bio-polymer). The thickening process for beverages includes procedures such as suspended, clinging, mouthfeel, pour, pump, and sprays. Food thickeners are commonly used in fruit-based drinks around the world.
However, high R&D expenditures incurred by food thickener manufacture, as well as volatility in prices of hydrocolloid raw material, are likely to stifle revenue growth in the worldwide food thickeners agents market throughout the forecast period.
Let us know your requirement to get
100% FREE customization
Regional Analysis
Due to rising demand for food thickeners in countries like the United States, Canada, and Mexico, North America is likely to account for a greater revenue share among other markets during the forecast period. The highly developed food and beverage industries in these nations are projected to continue to drive revenue growth in the North American market.
Food thickeners are in high demand because to the strong presence of many worldwide food processing and production enterprises. Muffins, cakes, and pastries have seen an increase in popularity in North America in recent years. Companies in the baking and confectionery industries are introducing innovations into their offerings by using various thickeners, which is projected to enhance market growth.
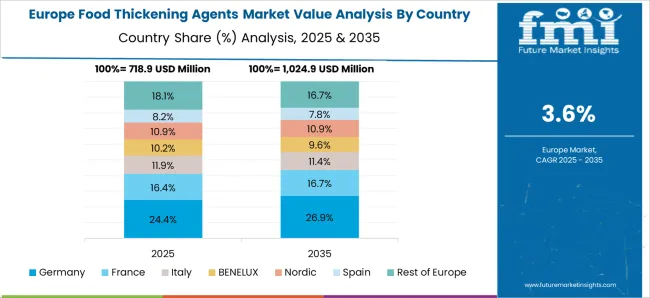
During the forecast period, Europe is anticipated to have a significantly consistent revenue growth rate. In Europe, demand for food thickeners is likely to be driven by a well-developed bakery and confectionery sector, as well as increased consumer demand for related products.
In the future, rising demand for energy drinks and packaged juice is likely to drive market revenue growth. Several food thickener companies in Europe export value-added goods such mixtures of various thickeners and flavour additives. The majority of exporters are based in Western Europe, whereas producers are expanding their footprint in Eastern Europe.
Category-Wise Insights
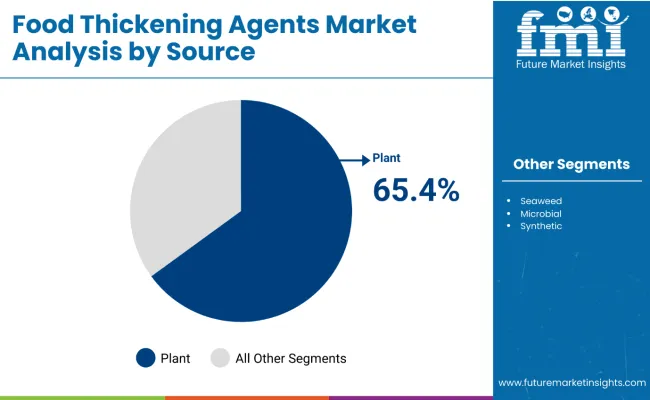
Plant-based Food Thickening Agents Exhibit High Growth
Due to the rising popularity of vegan foods, food thickeners made from plants are in great demand among customers, notably in the confectionery, bakery, and packaged food industries. The segment's revenue growth is predicted to be aided by the easy availability of raw materials for the development of food thickeners derived from plants.
Because of their great effectiveness and low cost, plant-based components are the most extensively used ingredients in most applications, including bakery, confectionery, and ready-to-eat meals. Corn-starch, agar, tapioca, pectin, xanthan gum, and rice flour are some of the most often used plant-based food thickeners
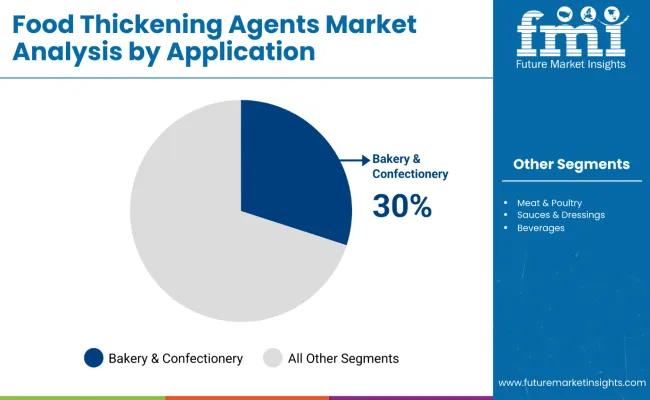
Bakery and Confectionery Segment to drive Food Thickeners Market
Bakery is predicted to lead the global market in terms of revenue contribution over the forecast period, based on application. This segment's sales is predicted to expand due to rising demand for organic baked goods and a quick shift toward healthier snacks. Cakes, pizzas, brownies, cookies and bread are just a few of the baked goods that contain food thickeners.
The most common use of hydrocolloid-based food thickeners is in bakery items. Food thickeners provide the appropriate viscosity without compromising nutritious content, and such products are frequently used in fruit pulps and energetic beverages, hence revenue in the beverages category is predicted to grow at a considerable CAGR throughout the forecast period.
The adoption of a healthy lifestyle by consumers has resulted in an increase in demand for healthy drinks, which will drive demand for food thickeners in beverages application.
Find your sweet spots for generating winning opportunities in this market.
Talk to AnalystCompetition Landscape: Top Food Thickener Manufacturers
Top manufacturers have been attempting to build a foothold in the industry by expanding regionally. In the food thickeners manufacturing business, key players are using numerous strategies, including strategic agreements, mergers and acquisitions, and contracts, adopting more advanced technologies, and creating, testing, and releasing new and more efficient food thickeners.
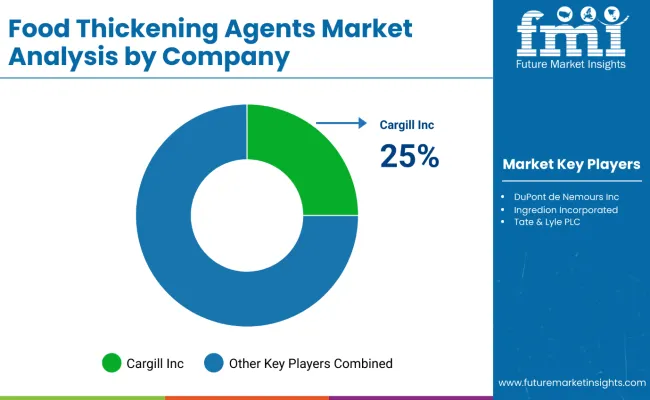
According to the market research Cargill Inc., Ingredion Incorporated., Archer Daniels Midland Company, Kerry Group plc, DuPont de Nemours Inc., Tate & Lyle PLC, TIC Gums, Inc., CP Kelco U.S., Medline Industries, Inc., Inc., Fuerst Day Lawson Limited, are among the key players in the Micronized Salt market.
Scope of Report
Attribute |
Details |
Market Size Value in 2022 |
USD 2.6 Bn |
Market Forecast Value in 2032 |
USD 3.8 Bn |
Global Growth Rate |
3.8% |
Forecast Period |
2022-2032 |
Historical Data Available for |
2017-2021 |
Market Analysis |
MT for Volume and USD Bn for Value. |
Key Regions Covered |
North America, Latin America, Europe, East Asia, South Asia, Oceania and Middle East and Africa |
Key Countries Covered |
United States, Canada, Brazil, Mexico, Germany, UK, France, Italy, Spain, Nordic, Russia, Poland, China, India, Thailand, Indonesia, Australia and New Zealand, Japan, GCC countries, North Africa, South Africa, others. |
Key Market Segments Covered |
Source, Application, and Region |
Key Companies Profiled |
|
Pricing |
Available upon Request |

A unified Market Research Subscription Platform, built for today's disparate research needs.
Key Segments Covered
By Source:
- Plant
- Guar Gum
- Gum Arabic
- Locust Bean Gum
- Pectin
- Starches
- Other Plant Sources
- Seaweed
- Carrageenan
- Agar
- Alginate
- Microbial
- Gellan Gum
- Curdlan
- Xanthan Gum
- Animal (Gelatin)
- Synthetic
- Carboxy Methyl Cellulose
- Methyl Cellulose
By Application:
- Bakery & Confectionery
- Meat & Poultry
- Sauces & Dressings
- Beverages
- Dairy Products
- Other Applications
By Region:
- North America
- Western Europe
- Eastern Europe
- Latin America
- Asia Pacific excluding Japan
- Japan
- Middle East & Africa
Frequently Asked Questions
Currently food thickening agents market is worth more than USD 2.5 Bn.
Food thickening agents’ consumption is expected to grow at a CAGR of around 3.8% during the period 2022-2032.
In terms of revenue, food thickening agents grew at a CAGR of around 2.5% during 2017-2021
The primary factor driving the growth of the food thickening agents market is the rising appeal in the processed food industry due to its consistency and purity.
Market players are opting for technological advancement, new product developments and production capacity expansion.
The top 5 producers of food thickening agents hold around 15-17% of the market share.
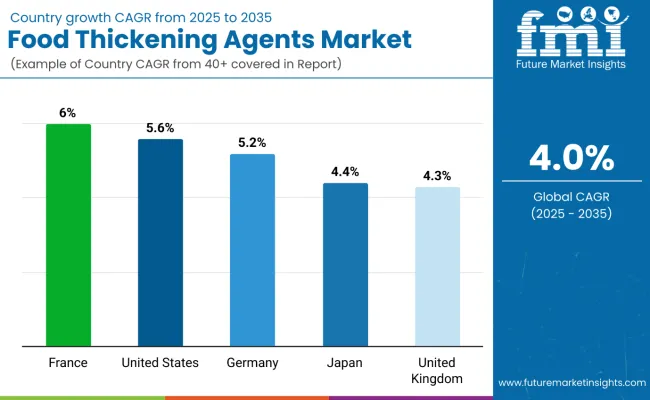
The US, and UK are the major countries driving demand for food thickening agents.
The major players involved in the food thickening agents market are Cargill Inc. , Ingredion Incorporated., Archer Daniels Midland Company , Kerry Group plc, DuPont de Nemours Inc., Tate & Lyle PLC, TIC Gums, Inc., CP Kelco U.S., Medline Industries, Inc. , Inc., Fuerst Day Lawson Limited.
North America holds around 36.5% of the total food thickening agents’ revenue share.
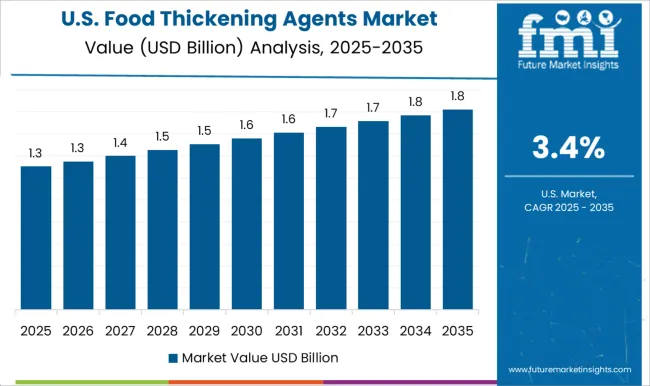
US food thickening agents market is projected to grow at a CAGR of around 3.5% over the next ten years.
Table of Content
1. Market Overview
1.1. Market Coverage / Taxonomy
1.2. Market Definition / Scope / Limitations
2. The Massive Impact of the Crisis
2.1. Global Food Thickening Agent Market Forecast Scenario Comparison of Annual Growth Rates for Short Term (2022-2025) and Long Term (2026-2032)
2.1.1. Optimistic Scenario
2.1.1.1. China
2.1.1.2. US
2.1.1.3. India
2.1.1.4. Euro Zone
2.1.1.5. Asia Pacific
2.1.1.6. Rest of the World
2.1.2. Likely Scenario
2.1.2.1. China
2.1.2.2. US
2.1.2.3. India
2.1.2.4. Euro Zone
2.1.2.5. Asia Pacific
2.1.2.6. Rest of the World
2.1.3. Pessimistic Scenario
2.1.3.1. China
2.1.3.2. US
2.1.3.3. India
2.1.3.4. Euro Zone
2.1.3.5. Asia Pacific
2.1.3.6. Rest of the World
2.2. Key Factors Impacting the Market
2.3. Note: Market Assessment shall be Provided for Likely Scenario
3. Market Background
3.1. Global Food Thickening Agent Production Outlook
3.2. Import and Export Overview: Food Thickening Agent Market
3.3. Application Opportunities of Food Thickening Agent
3.4. Product Claims & Nutritional Information Scan by Buyers
3.5. Macro-Economic Factors
3.6. Forecast Factors - Relevance & Impact
3.7. Consumers Survey Analysis
3.8. Market Dynamics
3.8.1. Supply Side Drivers
3.8.2. Demand Side drivers
3.8.3. Economic Side Drivers
3.8.4. Restraints
3.8.5. Opportunity
3.8.6. Trends
4. Key Regulations
4.1. FDA Regulations
4.2. EU Regulations
4.3. Packaging & Labelling Regulations
4.4. Certifications and Certifying Agency Overview
4.5. Import/Export Policies
5. Global Food Thickening Agent Market- Production and Trade Analysis
5.1. Total Production Volume (MT), (2022E)
5.1.1. North America
5.1.2. Latin America
5.1.3. Europe
5.1.4. East Asia
5.1.5. South Asia
5.1.6. Oceania
5.1.7. Middle East and Africa (MEA)
5.2. Food Thickening Agent Market- Exports to the World
5.2.1. Key Exporting Countries/Regions- Market Share Analysis (2022E)
5.2.2. Value (USD Bn) of Export/ Volume (MT) of Export
5.3. Food Thickening Agent Market- Imports to the World
5.3.1. Key importing Countries/Regions- Market Share Analysis (2022E)
5.3.2. Value (USD Bn) of Import/ Volume (MT) of Import
5.4. Comparative Analysis of Brands by Key Importing Countries
5.5. Global Food Thickening Agent Market- Supply Demand Scenario (Global Production, Sales, Import, Export)
6. Global Food Thickening Agent Market Demand Analysis 2017-2021 and Forecast, 2022-2032
6.1. Historical Market Volume (Metric Tons) Analysis, 2017-2021
6.2. Current and Future Market Volume (Metric Tons) Projections, 2022-2032
6.3. Y-o-Y Growth Trend Analysis 2022-2032
7. Global Food Thickening Agent Market - Pricing Analysis
7.1. Regional Pricing Analysis (USD/Metric Ton) By Application (2017,2022,2032)
7.1.1. Purity 98% - 99.5%
7.1.2. Purity Above 99.5%
7.2. Pricing Break-up (2017,2022,2032)
7.2.1. Producer Level Pricing
7.2.2. Distributor Level Pricing
7.2.3. Retailer Level Pricing
7.3. Global Average Pricing Analysis Benchmark
8. Global Food Thickening Agent Market Demand (Size in USD Bn) Analysis 2017-2021 and Forecast, 2022-2032
8.1. Historical Market Value (USD Bn) Analysis, 2017-2021
8.2. Current and Future Market Value (USD Bn) Projections, 2022-2032
8.2.1. Y-o-Y Growth Trend Analysis
8.2.2. Absolute $ Opportunity Analysis
9. Global Food Thickening Agent Market Analysis 2017-2021 and Forecast 2022-2032, By Application
9.1. Introduction / Key Findings
9.2. Historical Market Size (USD Bn) and Volume Analysis By Application, 2017-2021
9.3. Current and Future Market Size (USD Bn) and Volume Analysis and Forecast By Application, 2022-2032
9.3.1. Bakery & Confectionery
9.3.2. Meat & Poultry
9.3.3. Sauces & Dressings
9.3.4. Beverages
9.3.5. Dairy Products
9.3.6. Others
9.4. Market Attractiveness Analysis By Application
10. Global Food Thickening Agent Market Analysis 2017-2021 and Forecast 2022-2032, By Source
10.1. Introduction / Key Findings
10.2. Historical Market Size (USD Bn) and Volume Analysis By Source, 2017-2021
10.3. Current and Future Market Size (USD Bn) and Volume Analysis and Forecast By Source, 2022-2032
10.3.1. Plant
10.3.1.1. Guar Gum
10.3.1.2. Pectin
10.3.1.3. Gum Arabic
10.3.1.4. Locust Bean Gum
10.3.1.5. Starches
10.3.1.6. Others
10.3.2. Seaweed
10.3.2.1. Alginate
10.3.2.2. Agar
10.3.2.3. Carrageenan
10.3.3. Microbial
10.3.3.1. Curdlan
10.3.3.2. Gellan Gum
10.3.3.3. Xanthum Gum
10.3.4. Animal (Gelatin)
10.3.5. Synthetic
10.3.5.1. Methyl Cellulose
10.3.5.2. Carboxy Methyl Cellulose (CMC)
10.4. Market Attractiveness Analysis By Source
11. Global Food Thickening Agent Market Analysis 2017-2021 and Forecast 2022-2032, By Region
11.1. Introduction / Key Findings
11.2. Historical Market Size (USD Bn) and Volume Analysis By Region, 2017-2021
11.3. Current and Future Market Size (USD Bn) and Volume Analysis and Forecast By Region, 2022-2032
11.3.1. North America
11.3.2. South America
11.3.3. Europe
11.3.4. East Asia
11.3.5. South Asia
11.3.6. Oceania
11.3.7. MEA
11.4. Market Attractiveness Analysis By Region
12. North America Food Thickening Agent Market Analysis 2017-2021 and Forecast 2022-2032
12.1. Introduction
12.2. Pricing Analysis
12.3. Historical Market Size (USD Bn) and Volume Trend Analysis By Market Taxonomy, 2017-2021
12.4. Market Size (USD Bn) and Volume Forecast By Market Taxonomy, 2022 - 2032
12.4.1. By Country
12.4.1.1. U.S.
12.4.1.2. Canada
12.4.2. By Application
12.4.3. By Source
12.5. Market Attractiveness Analysis
12.5.1. By Application
12.5.2. By Source
12.6. Market Trends
12.7. Key Market Participants - Intensity Mapping
12.8. Drivers and Restraints - Impact Analysis
13. Latin America Food Thickening Agent Market Analysis 2017-2021 and Forecast 2022-2032
13.1. Introduction
13.2. Pricing Analysis
13.3. Historical Market Size (USD Bn) and Volume Trend Analysis By Market Taxonomy, 2017-2021
13.4. Market Size (USD Bn) and Volume Forecast By Market Taxonomy, 2022 - 2032
13.4.1. By Country
13.4.1.1. Brazil
13.4.1.2. Mexico
13.4.1.3. Argentina
13.4.1.4. Chile
13.4.1.5. Peru
13.4.1.6. Rest of Latin America
13.4.2. By Application
13.4.3. By Source
13.5. Market Attractiveness Analysis
13.5.1. By Application
13.5.2. By Source
13.6. Market Trends
13.7. Key Market Participants - Intensity Mapping
13.8. Drivers and Restraints - Impact Analysis
14. Europe Food Thickening Agent Market Analysis 2017-2021and Forecast 2022-2032
14.1. Introduction
14.2. Pricing Analysis
14.3. Historical Market Size (USD Bn) and Volume Trend Analysis By Market Taxonomy, 2017-2021
14.4. Market Size (USD Bn) and Volume Forecast By Market Taxonomy, 2022 - 2032
14.4.1. By Country
14.4.1.1. Germany
14.4.1.2. Italy
14.4.1.3. France
14.4.1.4. U.K
14.4.1.5. Spain
14.4.1.6. BENELUX
14.4.1.7. Nordic
14.4.1.8. Russia
14.4.1.9. Poland
14.4.1.10. Rest of Europe
14.4.2. By Application
14.4.3. By Source
14.5. Market Attractiveness Analysis
14.5.1. By Application
14.5.2. By Source
14.6. Market Trends
14.7. Key Market Participants - Intensity Mapping
14.8. Drivers and Restraints - Impact Analysis
15. East Asia Food Thickening Agent Market Analysis 2017-2021 and Forecast 2022-2032
15.1. Introduction
15.2. Pricing Analysis
15.3. Historical Market Size (USD Bn) and Volume Trend Analysis By Market Taxonomy, 2017-2021
15.4. Market Size (USD Bn) and Volume Forecast By Market Taxonomy, 2022 - 2032
15.4.1. By Country
15.4.1.1. China
15.4.1.2. Japan
15.4.1.3. South Korea
15.4.2. By Application
15.4.3. By Source
15.5. Market Attractiveness Analysis
15.5.1. By Application
15.5.2. By Source
15.6. Market Trends
15.7. Key Market Participants - Intensity Mapping
15.8. Drivers and Restraints - Impact Analysis
16. South Asia Food Thickening Agent Market Analysis 2017-2021 and Forecast 2022-2032
16.1. Introduction
16.2. Pricing Analysis
16.3. Historical Market Size (USD Bn) and Volume Trend Analysis By Market Taxonomy, 2017-2021
16.4. Market Size (USD Bn) and Volume Forecast By Market Taxonomy, 2022 - 2032
16.4.1. By Country
16.4.1.1. India
16.4.1.2. Indonesia
16.4.1.3. Malaysia
16.4.1.4. Thailand
16.4.1.5. Rest of South Asia
16.4.2. By Application
16.4.3. By Source
16.5. Market Attractiveness Analysis
16.5.1. By Application
16.5.2. By Source
16.6. Market Trends
16.7. Key Market Participants - Intensity Mapping
16.8. Drivers and Restraints - Impact Analysis
17. Oceania Food Thickening Agent Market Analysis 2017-2021 and Forecast 2022-2032
17.1. Introduction
17.2. Pricing Analysis
17.3. Historical Market Size (USD Bn) and Volume Trend Analysis By Market Taxonomy, 2017-2021
17.4. Market Size (USD Bn) and Volume Forecast By Market Taxonomy, 2022 - 2032
17.4.1. By Country
17.4.1.1. Australia
17.4.1.2. New-Zealand
17.4.2. By Application
17.4.3. By Source
17.5. Market Attractiveness Analysis
17.5.1. By Application
17.5.2. By Source
17.6. Market Trends
17.7. Key Market Participants - Intensity Mapping
17.8. Drivers and Restraints - Impact Analysis
18. Middle East and Africa Food Thickening Agent Market Analysis 2017-2021 and Forecast 2022-2032
18.1. Introduction
18.2. Pricing Analysis
18.3. Historical Market Size (USD Bn) and Volume Trend Analysis By Market Taxonomy, 2017-2021
18.4. Market Size (USD Bn) and Volume Forecast By Market Taxonomy, 2022 - 2032
18.4.1. By Country
18.4.1.1. GCC Countries
18.4.1.2. North Africa
18.4.1.3. South Africa
18.4.1.4. Turkey
18.4.1.5. Rest of MEA
18.4.2. By Application
18.4.3. By Source
18.5. Market Attractiveness Analysis
18.5.1. By Application
18.5.2. By Source
18.6. Market Trends
18.7. Key Market Participants - Intensity Mapping
18.8. Drivers and Restraints - Impact Analysis
19. Key Countries Food Thickening Agent Market Analysis 2017–2021 and Forecast 2022–2032
19.1. U.S.
19.1.1. Pricing Analysis (2017, 2022, 2032)
19.1.2. Market Value and Volume Analysis 2017–2021 and Forecast 2022–2032
19.1.2.1. By Application
19.1.2.2. By Source
19.2. Canada
19.2.1. Pricing Analysis (2017, 2022, 2032)
19.2.2. Market Value and Volume Analysis 2017–2021 and Forecast 2022–2032
19.2.2.1. By Application
19.2.2.2. By Source
19.3. Brazil
19.3.1. Pricing Analysis (2017, 2022, 2032)
19.3.2. Market Value and Volume Analysis 2017–2021 and Forecast 2022–2032
19.3.2.1. By Application
19.3.2.2. By Source
19.4. Mexico
19.4.1. Pricing Analysis (2017, 2022, 2032)
19.4.2. Market Value and Volume Analysis 2017–2021 and Forecast 2022–2032
19.4.2.1. By Application
19.4.2.2. By Source
19.5. Russia
19.5.1. Pricing Analysis (2017, 2022, 2032)
19.5.2. Market Value and Volume Analysis 2017–2021 and Forecast 2022–2032
19.5.2.1. By Application
19.5.2.2. By Source
19.6. Poland
19.6.1. Pricing Analysis (2017, 2022, 2032)
19.6.2. Market Value and Volume Analysis 2017–2021 and Forecast 2022–2032
19.6.2.1. By Application
19.6.2.2. By Source
19.7. Germany
19.7.1. Pricing Analysis (2017, 2022, 2032)
19.7.2. Market Value and Volume Analysis 2017–2021 and Forecast 2022–2032
19.7.2.1. By Application
19.7.2.2. By Source
19.8. United Kingdom
19.8.1. Pricing Analysis (2017, 2022, 2032)
19.8.2. Market Value and Volume Analysis 2017–2021 and Forecast 2022–2032
19.8.2.1. By Application
19.8.2.2. By Source
19.9. France
19.9.1. Pricing Analysis (2017, 2022, 2032)
19.9.2. Market Value and Volume Analysis 2017–2021 and Forecast 2022–2032
19.9.2.1. By Application
19.9.2.2. By Source
19.10. Italy
19.10.1. Pricing Analysis (2017, 2022, 2032)
19.10.2. Market Value and Volume Analysis 2017–2021 and Forecast 2022–2032
19.10.2.1. By Application
19.10.2.2. By Source
19.11. Spain
19.11.1. Pricing Analysis (2017, 2022, 2032)
19.11.2. Market Value and Volume Analysis 2017–2021 and Forecast 2022–2032
19.11.2.1. By Application
19.11.2.2. By Source
19.12. China
19.12.1. Pricing Analysis (2017, 2022, 2032)
19.12.2. Market Value and Volume Analysis 2017–2021 and Forecast 2022–2032
19.12.2.1. By Application
19.12.2.2. By Source
19.13. India
19.13.1. Pricing Analysis (2017, 2022, 2032)
19.13.2. Market Value and Volume Analysis 2017–2021 and Forecast 2022–2032
19.13.2.1. By Application
19.13.2.2. By Source
19.14. Australia and New Zealand
19.14.1. Pricing Analysis (2017, 2022, 2032)
19.14.2. Market Value and Volume Analysis 2017–2021 and Forecast 2022–2032
19.14.2.1. By Application
19.14.2.2. By Source
19.15. ASEAN
19.15.1. Pricing Analysis (2017, 2022, 2032)
19.15.2. Market Value and Volume Analysis 2017–2021 and Forecast 2022–2032
19.15.2.1. By Application
19.15.2.2. By Source
19.16. Japan
19.16.1. Pricing Analysis (2017, 2022, 2032)
19.16.2. Market Value and Volume Analysis 2017–2021 and Forecast 2022–2032
19.16.2.1. By Application
19.16.2.2. By Source
19.17. GCC Countries
19.17.1. Pricing Analysis (2017, 2022, 2032)
19.17.2. Market Value and Volume Analysis 2017–2021 and Forecast 2022–2032
19.17.2.1. By Application
19.17.2.2. By Source
19.18. South Africa
19.18.1. Pricing Analysis (2017, 2022, 2032)
19.18.2. Market Value and Volume Analysis 2017–2021 and Forecast 2022–2032
19.18.2.1. By Application
19.18.2.2. By Source
20. Market Structure Analysis
20.1. Market Analysis by Tier of Companies
20.2. Company Share Analysis of Top Players
20.2.1. By Application
20.2.2. By Region
20.3. Market Presence Analysis
20.3.1. By Regional Footprint of Players
20.3.2. Product Footprint by Players
20.3.3. Channel Footprint by Players
21. Competition Deep Dive (Tentative List)
21.1. Cargill Inc.
21.1.1.1. Overview
21.1.1.2. Product Portfolio
21.1.1.3. Profitability by Market Segments
21.1.1.4. Sales Footprint
21.1.1.5. SWOT Analysis
21.1.1.6. Strategy Overview
21.1.1.6.1. Product Strategy
21.1.1.6.2. Channel Strategy
21.2. ICL Group
21.2.1.1. Overview
21.2.1.2. Product Portfolio
21.2.1.3. Profitability by Market Segments
21.2.1.4. Sales Footprint
21.2.1.5. SWOT Analysis
21.2.1.6. Strategy Overview
21.2.1.6.1. Product Strategy
21.2.1.6.2. Channel Strategy
21.3. Ingredion Incorporated.
21.3.1.1. Overview
21.3.1.2. Product Portfolio
21.3.1.3. Profitability by Market Segments
21.3.1.4. Sales Footprint
21.3.1.5. SWOT Analysis
21.3.1.6. Strategy Overview
21.3.1.6.1. Product Strategy
21.3.1.6.2. Channel Strategy
21.4. Archer Daniels Midland Company
21.4.1.1. Overview
21.4.1.2. Product Portfolio
21.4.1.3. Profitability by Market Segments
21.4.1.4. Sales Footprint
21.4.1.5. SWOT Analysis
21.4.1.6. Strategy Overview
21.4.1.6.1. Product Strategy
21.4.1.6.2. Channel Strategy
21.5. Kerry Group plc
21.5.1.1. Overview
21.5.1.2. Product Portfolio
21.5.1.3. Profitability by Market Segments
21.5.1.4. Sales Footprint
21.5.1.5. SWOT Analysis
21.5.1.6. Strategy Overview
21.5.1.6.1. Product Strategy
21.5.1.6.2. Channel Strategy
21.6. DuPont de Nemours Inc.
21.6.1.1. Overview
21.6.1.2. Product Portfolio
21.6.1.3. Profitability by Market Segments
21.6.1.4. Sales Footprint
21.6.1.5. SWOT Analysis
21.6.1.6. Strategy Overview
21.6.1.6.1. Product Strategy
21.6.1.6.2. Channel Strategy
21.7. Tate & Lyle PLC
21.7.1.1. Overview
21.7.1.2. Product Portfolio
21.7.1.3. Profitability by Market Segments
21.7.1.4. Sales Footprint
21.7.1.5. SWOT Analysis
21.7.1.6. Strategy Overview
21.7.1.6.1. Product Strategy
21.7.1.6.2. Channel Strategy
21.8. TIC Gums, Inc.
21.8.1.1. Overview
21.8.1.2. Product Portfolio
21.8.1.3. Profitability by Market Segments
21.8.1.4. Sales Footprint
21.8.1.5. SWOT Analysis
21.8.1.6. Strategy Overview
21.8.1.6.1. Product Strategy
21.8.1.6.2. Channel Strategy
21.9. CP Kelco U.S.
21.9.1.1. Overview
21.9.1.2. Product Portfolio
21.9.1.3. Profitability by Market Segments
21.9.1.4. Sales Footprint
21.9.1.5. SWOT Analysis
21.9.1.6. Strategy Overview
21.9.1.6.1. Product Strategy
21.9.1.6.2. Channel Strategy
21.10. Medline Industries, Inc.
21.10.1.1. Overview
21.10.1.2. Product Portfolio
21.10.1.3. Profitability by Market Segments
21.10.1.4. Sales Footprint
21.10.1.5. SWOT Analysis
21.10.1.6. Strategy Overview
21.10.1.6.1. Product Strategy
21.10.1.6.2. Channel Strategy
21.11. Fuerst Day Lawson Limited
21.11.1.1. Overview
21.11.1.2. Product Portfolio
21.11.1.3. Profitability by Market Segments
21.11.1.4. Sales Footprint
21.11.1.5. SWOT Analysis
21.11.1.6. Strategy Overview
21.11.1.6.1. Product Strategy
21.11.1.6.2. Channel Strategy
Note: Above list is subjected to change during the course of study
22. Assumptions and Acronyms Used
23. Research Methodology
Let us know your requirement to get
100% FREE customization
List of Tables
Table 1: Global Food Thickening Agent Market Value (USD Bn) and Forecast by Region, 2017–2021
Table 2: Global Food Thickening Agent Market Value (USD Bn) and Forecast by Region,2022–2032
Table 3: Global Food Thickening Agent Market Volume (MT) and Forecast by Region, 2017–2021
Table 4: Global Food Thickening Agent Market Volume (MT) and Forecast by Region,2022–2032
Table 5: Global Food Thickening Agent Market Value (USD Bn) and Forecast By Application , 2017–2021
Table 6: Global Food Thickening Agent Market Value (USD Bn) and Forecast By Application , 2022–2032
Table 7: Global Food Thickening Agent Market Volume (MT) and Forecast By Application , 2017–2021
Table 8: Global Food Thickening Agent Market Volume (MT) and Forecast By Application , 2022–2032
Table 9: Global Food Thickening Agent Market Value (USD Bn) and Forecast By Source, 2017–2021
Table 10: Global Food Thickening Agent Market Value (USD Bn) and Forecast By Source,2022–2032
Table 11: Global Food Thickening Agent Market Volume (MT) and Forecast By Source, 2017–2021
Table 12: Global Food Thickening Agent Market Volume (MT) and Forecast By Source,2022–2032
Table 17: North America Food Thickening Agent Market Value (USD Bn) and Forecast by Country, 2017–2021
Table 18: North America Food Thickening Agent Market Value (USD Bn) and Forecast by Country, 2022–2032
Table 19: North America Food Thickening Agent Market Volume (MT) and Forecast by Country, 2017–2021
Table 20: North America Food Thickening Agent Market Volume (MT) and Forecast by Country, 2022–2032
Table 21: North America Food Thickening Agent Market Value (USD Bn) and Forecast By Application , 2017–2021
Table 22: North America Food Thickening Agent Market Value (USD Bn) and Forecast By Application , 2022–2032
Table 23: North America Food Thickening Agent Market Volume (MT) and Forecast By Application , 2017–2021
Table 24: North America Food Thickening Agent Market Volume (MT) and Forecast By Application ,2022–2032
Table 25: North America Food Thickening Agent Market Value (USD Bn) and Forecast By Source, 2017–2021
Table 26: North America Food Thickening Agent Market Value (USD Bn) and Forecast By Source,2022–2032
Table 27: North America Food Thickening Agent Market Volume (MT) and Forecast By Source, 2017–2021
Table 28: North America Food Thickening Agent Market Volume (MT) and Forecast By Source,2022–2032
Table 33: Latin America Food Thickening Agent Market Value (USD Bn) and Forecast by Country, 2017–2021
Table 34: Latin America Food Thickening Agent Market Value (USD Bn) and Forecast by Country, 2022–2032
Table 35: Latin America Food Thickening Agent Market Volume (MT) and Forecast by Country, 2017–2021
Table 36: Latin America Food Thickening Agent Market Volume (MT) and Forecast by Country, 2022–2032
Table 37: Latin America Food Thickening Agent Market Value (USD Bn) and Forecast By Application , 2017–2021
Table 38: Latin America Food Thickening Agent Market Value (USD Bn) and Forecast By Application , 2022–2032
Table 39: Latin America Food Thickening Agent Market Volume (MT) and Forecast By Application , 2017–2021
Table 40: Latin America Food Thickening Agent Market Volume (MT) and Forecast By Application ,2022–2032
Table 41: Latin America Food Thickening Agent Market Value (USD Bn) and Forecast By Source, 2017–2021
Table 42: Latin America Food Thickening Agent Market Value (USD Bn) and Forecast By Source,2022–2032
Table 43: Latin America Food Thickening Agent Market Volume (MT) and Forecast By Source, 2017–2021
Table 44: Latin America Food Thickening Agent Market Volume (MT) and Forecast By Source,2022–2032
Table 49: Europe Food Thickening Agent Market Value (USD Bn) and Forecast by Country, 2017–2021
Table 50: Europe Food Thickening Agent Market Value (USD Bn) and Forecast by Country, 2022–2032
Table 51: Europe Food Thickening Agent Market Volume (MT) and Forecast by Country, 2017–2021
Table 52: Europe Food Thickening Agent Market Volume (MT) and Forecast by Country, 2022–2032
Table 53: Europe Food Thickening Agent Market Value (USD Bn) and Forecast By Application , 2017–2021
Table 54: Europe Food Thickening Agent Market Value (USD Bn) and Forecast By Application , 2022–2032
Table 55: Europe Food Thickening Agent Market Volume (MT) and Forecast By Application , 2017–2021
Table 56: Europe Food Thickening Agent Market Volume (MT) and Forecast By Application ,2022–2032
Table 57: Europe Food Thickening Agent Market Value (USD Bn) and Forecast By Source, 2017–2021
Table 58: Europe Food Thickening Agent Market Value (USD Bn) and Forecast By Source,2022–2032
Table 59: Europe Food Thickening Agent Market Volume (MT) and Forecast By Source, 2017–2021
Table 60: Europe Food Thickening Agent Market Volume (MT) and Forecast By Source,2022–2032
Table 65: South Asia Food Thickening Agent Market Value (USD Bn) and Forecast by Country, 2017–2021
Table 66: South Asia Food Thickening Agent Market Value (USD Bn) and Forecast by Country, 2022–2032
Table 67: South Asia Food Thickening Agent Market Volume (MT) and Forecast by Country, 2017–2021
Table 68: South Asia Food Thickening Agent Market Volume (MT) and Forecast by Country, 2022–2032
Table 69: South Asia Food Thickening Agent Market Value (USD Bn) and Forecast By Application , 2017–2021
Table 70: South Asia Food Thickening Agent Market Value (USD Bn) and Forecast By Application , 2022–2032
Table 71: South Asia Food Thickening Agent Market Volume (MT) and Forecast By Application , 2017–2021
Table 72: South Asia Food Thickening Agent Market Volume (MT) and Forecast By Application ,2022–2032
Table 73: South Asia Food Thickening Agent Market Value (USD Bn) and Forecast By Source, 2017–2021
Table 74: South Asia Food Thickening Agent Market Value (USD Bn) and Forecast By Source,2022–2032
Table 75: South Asia Food Thickening Agent Market Volume (MT) and Forecast By Source, 2017–2021
Table 76: South Asia Food Thickening Agent Market Volume (MT) and Forecast By Source,2022–2032
Table 81: East Asia Food Thickening Agent Market Value (USD Bn) and Forecast by Country, 2017–2021
Table 82: East Asia Food Thickening Agent Market Value (USD Bn) and Forecast by Country, 2022–2032
Table 83: East Asia Food Thickening Agent Market Volume (MT) and Forecast by Country, 2017–2021
Table 84: East Asia Food Thickening Agent Market Volume (MT) and Forecast by Country, 2022–2032
Table 85: East Asia Food Thickening Agent Market Value (USD Bn) and Forecast By Application , 2017–2021
Table 86: East Asia Food Thickening Agent Market Value (USD Bn) and Forecast By Application , 2022–2032
Table 87: East Asia Food Thickening Agent Market Volume (MT) and Forecast By Application , 2017–2021
Table 88: East Asia Food Thickening Agent Market Volume (MT) and Forecast By Application ,2022–2032
Table 89: East Asia Food Thickening Agent Market Value (USD Bn) and Forecast By Source, 2017–2021
Table 90: East Asia Food Thickening Agent Market Value (USD Bn) and Forecast By Source,2022–2032
Table 91: East Asia Food Thickening Agent Market Volume (MT) and Forecast By Source, 2017–2021
Table 92: East Asia Food Thickening Agent Market Volume (MT) and Forecast By Source,2022–2032
Table 97: Oceania Food Thickening Agent Market Value (USD Bn) and Forecast by Country, 2017–2021
Table 98: Oceania Food Thickening Agent Market Value (USD Bn) and Forecast by Country, 2022–2032
Table 99: Oceania Food Thickening Agent Market Volume (MT) and Forecast by Country, 2017–2021
Table 100: Oceania Food Thickening Agent Market Volume (MT) and Forecast by Country, 2022–2032
Table 101: Oceania Food Thickening Agent Market Value (USD Bn) and Forecast By Application , 2017–2021
Table 102: Oceania Food Thickening Agent Market Value (USD Bn) and Forecast By Application , 2022–2032
Table 103: Oceania Food Thickening Agent Market Volume (MT) and Forecast By Application , 2017–2021
Table 104: Oceania Food Thickening Agent Market Volume (MT) and Forecast By Application ,2022–2032
Table 105: Oceania Food Thickening Agent Market Value (USD Bn) and Forecast By Source, 2017–2021
Table 106: Oceania Food Thickening Agent Market Value (USD Bn) and Forecast By Source,2022–2032
Table 107: Oceania Food Thickening Agent Market Volume (MT) and Forecast By Source, 2017–2021
Table 108: Oceania Food Thickening Agent Market Volume (MT) and Forecast By Source, 2022–2032
Table 113: MEA Food Thickening Agent Market Value (USD Bn) and Forecast by Country, 2017–2021
Table 114: MEA Food Thickening Agent Market Value (USD Bn) and Forecast by Country, 2022–2032
Table 115: MEA Food Thickening Agent Market Volume (MT) and Forecast by Country, 2017–2021
Table 116: MEA Food Thickening Agent Market Volume (MT) and Forecast by Country, 2022–2032
Table 117: MEA Food Thickening Agent Market Value (USD Bn) and Forecast By Application , 2017–2021
Table 118: MEA Food Thickening Agent Market Value (USD Bn) and Forecast By Application , 2022–2032
Table 119: MEA Food Thickening Agent Market Volume (MT) and Forecast By Application , 2017–2021
Table 120: MEA Food Thickening Agent Market Volume (MT) and Forecast By Application ,2022–2032
Table 121: MEA Food Thickening Agent Market Value (USD Bn) and Forecast By Source, 2017–2021
Table 122: MEA Food Thickening Agent Market Value (USD Bn) and Forecast By Source,2022–2032
Table 123: MEA Food Thickening Agent Market Volume (MT) and Forecast By Source, 2017–2021
Table 124: MEA Food Thickening Agent Market Volume (MT) and Forecast By Source,2022–2032
Find your sweet spots for generating winning opportunities in this market.
Talk to AnalystList of Charts
Figure 1: Global Food Thickening Agent Market Value Share (%) and BPS Analysis by Region, 2017 & 2022 & 2032
Figure 2: Global Food Thickening Agent Market Y-o-Y Analysis by Region, 2022 to 2032
Figure 3: Global Food Thickening Agent Market Attractiveness, by Region, 2022 to 2032
Figure 4: Global Food Thickening Agent Market Value Share (%) and BPS Analysis By Application, 2017 & 2022 & 2032
Figure 5: Global Food Thickening Agent Market Y-o-Y Analysis By Application, 2022 to 2032
Figure 6: Global Food Thickening Agent Market Attractiveness, By Application, 2022 to 2032
Figure 7: Global Food Thickening Agent Market Value Share (%) and BPS Analysis By Source, 2017 & 2022 & 2032
Figure 8: Global Food Thickening Agent Market Y-o-Y Analysis By Source, 2022 to 2032
Figure 9: Global Food Thickening Agent Market Attractiveness, By Source, 2022 to 2032
Figure 10: North America Food Thickening Agent Market Value Share (%) and BPS Analysis by Country, 2017 & 2022 & 2032
Figure 11: North America Food Thickening Agent Market Y-o-Y Analysis by Country, 2022 to 2032
Figure 12: North America Food Thickening Agent Market Attractiveness, by Country, 2022 to 2032
Figure 13: North America Food Thickening Agent Market Value Share (%) and BPS Analysis By Application, 2017 & 2022 & 2032
Figure 14: North America Food Thickening Agent Market Y-o-Y Analysis By Application, 2022 to 2032
Figure 15: North America Food Thickening Agent Market Attractiveness, By Application, 2022 to 2032
Figure 16: North America Food Thickening Agent Market Value Share (%) and BPS Analysis By Source, 2017 & 2022 & 2032
Figure 17: North America Food Thickening Agent Market Y-o-Y Analysis By Source, 2022 to 2032
Figure 18: North America Food Thickening Agent Market Attractiveness, By Source, 2022 to 2032
Figure 19: Latin America Food Thickening Agent Market Value Share (%) and BPS Analysis by Country, 2017 & 2022 & 2032
Figure 20: Latin America Food Thickening Agent Market Y-o-Y Analysis by Country, 2022 to 2032
Figure 21: Latin America Food Thickening Agent Market Attractiveness, by Country, 2022 to 2032
Figure 22: Latin America Food Thickening Agent Market Value Share (%) and BPS Analysis By Application, 2017 & 2022 & 2032
Figure 23: Latin America Food Thickening Agent Market Y-o-Y Analysis By Application, 2022 to 2032
Figure 24: Latin America Food Thickening Agent Market Attractiveness, By Application, 2022 to 2032
Figure 25: Latin America Food Thickening Agent Market Value Share (%) and BPS Analysis By Source, 2017 & 2022 & 2032
Figure 26: Latin America Food Thickening Agent Market Y-o-Y Analysis By Source, 2022 to 2032
Figure 27: Latin America Food Thickening Agent Market Attractiveness, By Source, 2022 to 2032
Figure 28: Europe Food Thickening Agent Market Value Share (%) and BPS Analysis by Country, 2017 & 2022 & 2032
Figure 29: Europe Food Thickening Agent Market Y-o-Y Analysis by Country, 2022 to 2032
Figure 30: Europe Food Thickening Agent Market Attractiveness, by Country, 2022 to 2032
Figure 31: Europe Food Thickening Agent Market Value Share (%) and BPS Analysis By Application, 2017 & 2022 & 2032
Figure 32: Europe Food Thickening Agent Market Y-o-Y Analysis By Application, 2022 to 2032
Figure 33: Europe Food Thickening Agent Market Attractiveness, By Application, 2022 to 2032
Figure 34: Europe Food Thickening Agent Market Value Share (%) and BPS Analysis By Source, 2017 & 2022 & 2032
Figure 35: Europe Food Thickening Agent Market Y-o-Y Analysis By Source, 2022 to 2032
Figure 36: Europe Food Thickening Agent Market Attractiveness, By Source, 2022 to 2032
Figure 37: South Asia Food Thickening Agent Market Value Share (%) and BPS Analysis by Country, 2017 & 2022 & 2032
Figure 38: South Asia Food Thickening Agent Market Y-o-Y Analysis by Country, 2022 to 2032
Figure 39: South Asia Food Thickening Agent Market Attractiveness, by Country, 2022 to 2032
Figure 40: South Asia Food Thickening Agent Market Value Share (%) and BPS Analysis By Application, 2017 & 2022 & 2032
Figure 41: South Asia Food Thickening Agent Market Y-o-Y Analysis By Application, 2022 to 2032
Figure 42: South Asia Food Thickening Agent Market Attractiveness, By Application, 2022 to 2032
Figure 43: South Asia Food Thickening Agent Market Value Share (%) and BPS Analysis By Source, 2017 & 2022 & 2032
Figure 44: South Asia Food Thickening Agent Market Y-o-Y Analysis By Source, 2022 to 2032
Figure 45: South Asia Food Thickening Agent Market Attractiveness, By Source, 2022 to 2032
Figure 46: East Asia Food Thickening Agent Market Value Share (%) and BPS Analysis by Country, 2017 & 2022 & 2032
Figure 47: East Asia Food Thickening Agent Market Y-o-Y Analysis by Country, 2022 to 2032
Figure 48: East Asia Food Thickening Agent Market Attractiveness, by Country, 2022 to 2032
Figure 49: East Asia Food Thickening Agent Market Value Share (%) and BPS Analysis By Application, 2017 & 2022 & 2032
Figure 50: East Asia Food Thickening Agent Market Y-o-Y Analysis By Application, 2022 to 2032
Figure 51: East Asia Food Thickening Agent Market Attractiveness, By Application, 2022 to 2032
Figure 52: East Asia Food Thickening Agent Market Value Share (%) and BPS Analysis By Source, 2017 & 2022 & 2032
Figure 53: East Asia Food Thickening Agent Market Y-o-Y Analysis By Source, 2022 to 2032
Figure 54: East Asia Food Thickening Agent Market Attractiveness, By Source, 2022 to 2032
Figure 55: Oceania Food Thickening Agent Market Value Share (%) and BPS Analysis by Country, 2017 & 2022 & 2032
Figure 56: Oceania Food Thickening Agent Market Y-o-Y Analysis by Country, 2022 to 2032
Figure 57: Oceania Food Thickening Agent Market Attractiveness, by Country, 2022 to 2032
Figure 58: Oceania Food Thickening Agent Market Value Share (%) and BPS Analysis By Application, 2017 & 2022 & 2032
Figure 59: Oceania Food Thickening Agent Market Y-o-Y Analysis By Application, 2022 to 2032
Figure 60: Oceania Food Thickening Agent Market Attractiveness, By Application, 2022 to 2032
Figure 61: Oceania Food Thickening Agent Market Value Share (%) and BPS Analysis By Source, 2017 & 2022 & 2032
Figure 62: Oceania Food Thickening Agent Market Y-o-Y Analysis By Source, 2022 to 2032
Figure 63: Oceania Food Thickening Agent Market Attractiveness, By Source, 2022 to 2032
Figure 64: MEA Food Thickening Agent Market Value Share (%) and BPS Analysis by Country, 2017 & 2022 & 2032
Figure 65: MEA Food Thickening Agent Market Y-o-Y Analysis by Country, 2022 to 2032
Figure 66: MEA Food Thickening Agent Market Attractiveness, by Country, 2022 to 2032
Figure 67: MEA Food Thickening Agent Market Value Share (%) and BPS Analysis By Application, 2017 & 2022 & 2032
Figure 68: MEA Food Thickening Agent Market Y-o-Y Analysis By Application, 2022 to 2032
Figure 69: MEA Food Thickening Agent Market Attractiveness, By Application, 2022 to 2032
Figure 70: MEA Food Thickening Agent Market Value Share (%) and BPS Analysis By Source, 2017 & 2022 & 2032
Figure 71: MEA Food Thickening Agent Market Y-o-Y Analysis By Source, 2022 to 2032
Figure 72: MEA Food Thickening Agent Market Attractiveness, By Source, 2022 to 2032
Need specific information?
Request CustomizationExplore Food and Beverage Insights
View Reports