Frac Manifold Market Size and Share Forecast Outlook 2025 to 2035

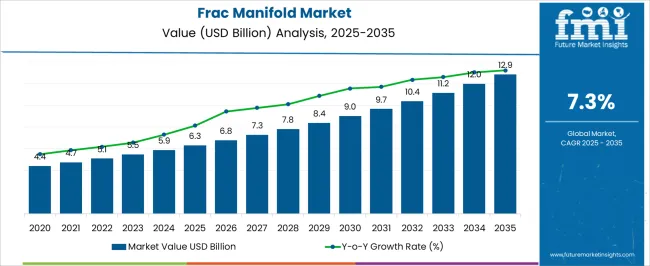
The Frac Manifold Market is estimated to be valued at USD 6.3 billion in 2025 and is projected to reach USD 12.9 billion by 2035, registering a compound annual growth rate (CAGR) of 7.3% over the forecast period.
Quick Stats for Frac Manifold Market

  • Frac Manifold Market Industry Value (2025): USD 6.3 billion
  • Frac Manifold Market Forecast Value (2035): USD 12.9 billion
  • Frac Manifold Market Forecast CAGR: 7.3%
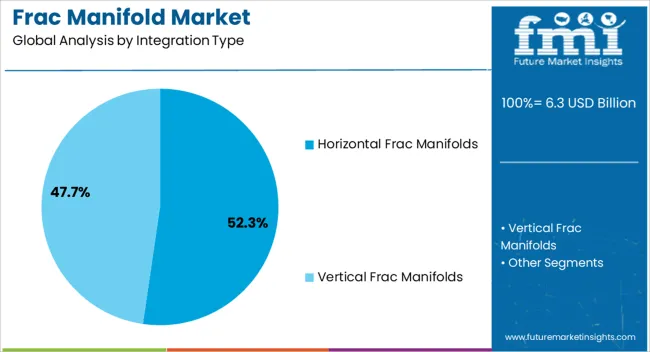
  • Leading Segment in Frac Manifold Market in 2025: Horizontal Frac Manifolds (52.3%)
  • Key Growth Region in Frac Manifold Market: North America, Asia-Pacific, Europe
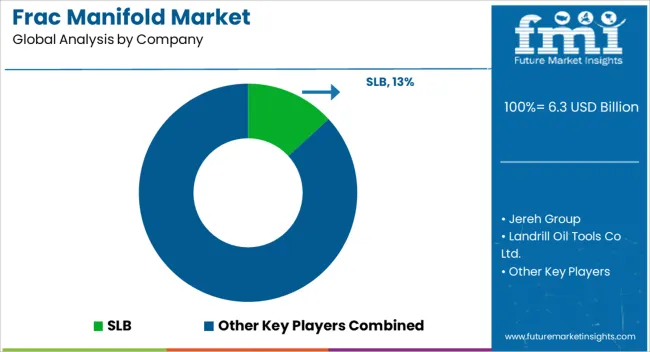
  • Top Key Players in Frac Manifold Market: SLB, Jereh Group, Landrill Oil Tools Co Ltd., NOV (National Oilwell Varco), Weatherford International, FMC Technologies, Yancheng Qihang Petroleum Machinery Co., Ltd, Neeco Industries, Worldwide Oilfield Machine (WOM), Halliburton, GOES GmbH, Dixon

Frac Manifold Market Market Value Analysis

Metric Value
Frac Manifold Market Estimated Value in (2025 E) USD 6.3 billion
Frac Manifold Market Forecast Value in (2035 F) USD 12.9 billion
Forecast CAGR (2025 to 2035) 7.3%

Rationale for Segmental Growth in the Frac Manifold Market

The frac manifold market is expanding steadily, driven by rising demand for efficient hydraulic fracturing operations in unconventional oil and gas fields. Industry reports, company press releases, and energy sector updates have emphasized the growing importance of reliable pressure control equipment to improve well completion efficiency and reduce downtime. The market has gained traction as shale exploration and production activities have increased globally, particularly in North America and parts of Asia.

Investments by upstream oilfield service providers in advanced manifold systems that enable faster rig-up and rig-down times have enhanced operational safety and cost-effectiveness. Furthermore, technological innovations in valve design, high-pressure containment, and automation are strengthening manifold reliability in complex fracturing environments.

Future growth is expected to be shaped by demand for scalable systems that can handle high-pressure, multi-stage fracking operations, alongside the industry’s gradual transition toward digital monitoring and predictive maintenance. Segmental expansion is being led by Horizontal Frac Manifolds, Carbon Steel material adoption, and Multiple Outlet configurations, reflecting efficiency, durability, and operational flexibility.
Segmental Analysis

Insights into the Integration Type Segment: Horizontal Frac Manifolds

Frac Manifold Market Analysis By Integration Type

The Horizontal Frac Manifolds segment is projected to account for 52.3% of the market revenue in 2025, establishing itself as the leading integration type. Growth has been supported by the operational advantages of horizontal designs, which simplify equipment alignment and streamline fluid flow during multi-well fracturing operations.

Field operators have preferred horizontal manifolds due to their ability to reduce rig-up time, minimize equipment footprint, and enhance worker safety during high-pressure pumping. Additionally, their modularity has allowed easier integration with advanced pumping units and digital monitoring systems.

Reports from oilfield equipment manufacturers have highlighted that horizontal manifolds provide consistent flow control while reducing wear and tear, thereby extending service life and lowering maintenance costs. These benefits, combined with the growing prevalence of large-scale shale operations, have reinforced the adoption of horizontal frac manifolds as the preferred integration type.
Insights into the Material Segment: Carbon Steel

Frac Manifold Market Analysis By Material

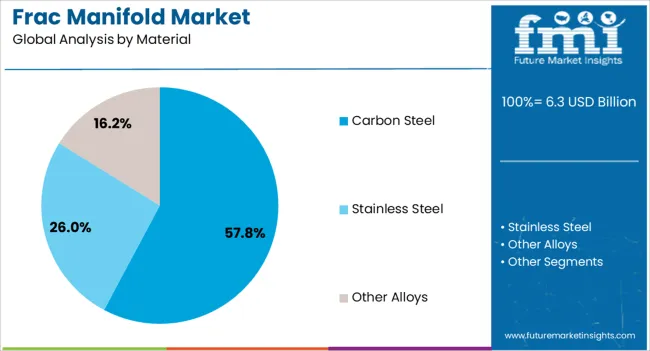
The Carbon Steel segment is projected to hold 57.8% of the frac manifold market revenue in 2025, maintaining its dominance as the preferred material. Its widespread use has been driven by high mechanical strength, durability, and cost-effectiveness under demanding pressure conditions.

Carbon steel manifolds have been valued for their ability to withstand abrasive fluids and high-pressure pumping cycles typical of hydraulic fracturing operations. Industry updates have noted that while alternative alloys and composites are being explored, carbon steel remains the most practical option due to its availability, machinability, and proven track record in oilfield environments.

The material’s favorable balance between performance and affordability has allowed operators to deploy carbon steel manifolds at scale without compromising safety or reliability. As hydraulic fracturing continues to intensify in key oil and gas regions, the Carbon Steel segment is expected to retain its leadership.
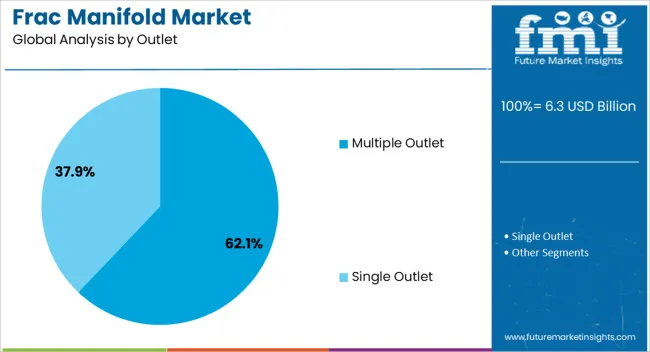
Insights into the Outlet Segment: Multiple Outlet

Frac Manifold Market Analysis By Outlet

The Multiple Outlet segment is projected to contribute 62.1% of the frac manifold market revenue in 2025, securing its position as the leading outlet configuration. This growth has been driven by the need for efficient management of complex, multi-stage fracturing operations that require simultaneous fluid distribution across several wellheads.

Multiple outlet manifolds have been preferred due to their ability to optimize flow paths, reduce pumping interruptions, and enable greater operational flexibility in pad drilling environments. Energy sector briefings have emphasized that the use of multiple outlet systems improves pumping efficiency, reduces equipment changeovers, and maximizes fracturing productivity.

Additionally, the configuration supports scalability, allowing operators to manage larger fracturing jobs with fewer interruptions. With increasing adoption of multi-well pad operations and the industry’s emphasis on maximizing well output, the Multiple Outlet segment is expected to continue driving market growth as the most operationally efficient outlet design.

Key Trends Influencing the Frac Manifold Market

  • Industry trends shift toward unconventional or modern energy storage systems. To foster environmental safety, various organizations are using alternative energy storage methods, driving the frac manifolds demand. Smooth pumping operations in the oil and gas reserve industries drive the demand for manifolds, fueling the growth of the frac manifold market.
  • Innovation and technology advancements in frac manifold elevate the production standards. IoT, AI, and machine learning are emerging technologies used to enhance the functioning of manifolds. Key players in the frac manifold industry benefit from this industry trend, helping them progress, which elevates the demand of the frac manifold market.
  • Key players in the frac manifold industry prefer emerging sectors to expand their functioning. Due to this, the industrial scope is enhanced, fueling the growth of the frac manifold market rate.

Energy Exploration as a Growth Driver for the Frac Manifold Market

With the rising shale gas exploration initiatives in different countries, the need for fracturing fluid controlling systems was increased during the historical era.

To achieve better hydraulic fracturing efficiency, hydrofracking manifolds were demanded more, driving the growth of the frac manifold market during the period.

Attributes Values
Historical CAGR 7.1%
Valuation in 2020 USD 4.17 billion
Valuation in 2025 USD 5.47 billion

The forecasted period is concerned with the growing energy demands due to the rising population and urbanization rate. These factors result in the increasing energy source exploration demands on a wider landscape, inflating the demand of the frac manifold market.
Market Trends and Demand Drivers in the Frac Manifold Industry

  • The spiking population and rising urbanization rate drive the demand for energy. To cater to these demands, energy procurement and distribution from different sources is necessary. This surges the demand for oil and natural gas. Pertaining to these demands, an efficient oil extraction and pumping system must be installed, which can be achieved using francs. This is a key driver fueling the growth of the frac manifold market.
  • The rising demand for cost-efficient operations spurs the demand for frac manifolds. Due to the reduction in downtime, their operational efficiency increases, reducing the losses during the operation. This spikes the demand of the frac manifold market.
  • With the growing independence, the oil imports have reduced. As a result, governments have been investing more in local energy alternatives. It drives the demand for frac manifolds, encouraging key players in the frac manifold industry to meet these demands through increased production. It drives the growth of the frac manifold market.
  • Heavy monetary investments in infrastructural projects drive the demand for efficient fracturing fluid flow. These government initiatives will likely spur the demand for frac manifolds, elevating the demand in the frac manifold market.

Factors Restricting Growth in the Frac Manifold Market

  • High volatility of the oil and gas industry will likely affect the pricing of frac manifolds. Moreover, it will reduce the investment prospects in the frac manifold industry, affecting the demand of the frac manifold market.
  • Stringent regulatory policies for wastewater management will likely affect key players in the frac manifold industry, forcing them to meet high standards of operations. This might affect the growth of the frac manifold market.

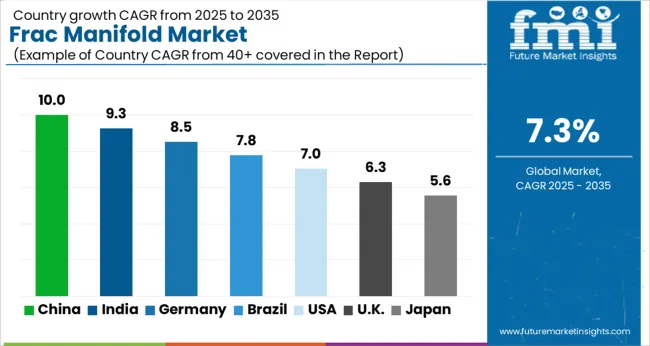
Country-wise Analysis of Frac Manifold Adoption and Usage

Frac Manifold Market Cagr Analysis By Country

Key players in the frac manifold industry can get better opportunities in developing countries. The Asia-Pacific region provides a wide landscape to them, raising the demand for the frac manifold market in the area.

Innovation and technological advancements in the frac manifold in North America can integrate cutting-edge solutions to traditional fluid flow-controlling systems. As a result, it is another key contributor to the industry.

The rising governmental efforts for sustainable production create prospects for the growth of the frac manifold market.

China’s Shale Gas Use to Drive the Growth of the Frac Manifold Market

China focuses on exploring different local energy resources to cater to the rising energy demands of the population. This can be achieved with the help of shale gas.

The government has been encouraging key players in the frac manifold industry by investing heavily to achieve the goal. With the growing government’s attention to the sector, the investment opportunities in the industries will likely spur.

Thus, demand for the frac manifold market in China will likely be pushed at a moderate CAGR of 5.9% from 2025 to 2035.
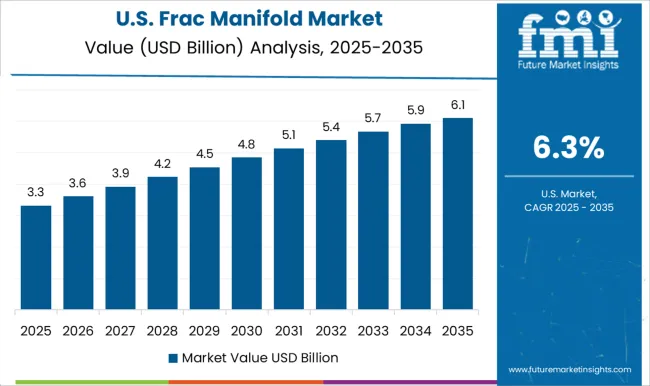
Technology to Inflate the Demand of the Frac Manifold Market in the United States

Frac Manifold Market Country Value Analysis

The United States of America projects the growth of the frac manifold market to occur at a moderate advancement rate of 6.3% during the forecasted period.

The growing technological infrastructure leverages local players to explore many fracking techniques, including horizontal drilling, multi-stage fracking, etc. This will likely spur the demand for cutting-edge systems, uplifting the popularity of these segments.

Innovations will also spike the efficiency of these systems. This will enhance the popularity of the industry, driving the sector.
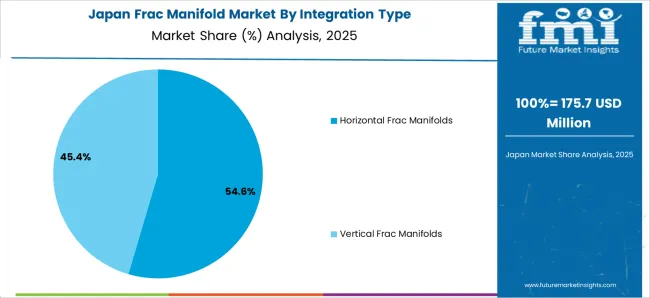
Energy Sector Investments Drive the Growth of the Frac Manifold Market in Japan

Frac Manifold Market Japan Market Share Analysis By Integration Type

Demand for the frac manifold market in Japan will likely inflate at a moderate CAGR of 6.5%.

Japan invests heavily in utilizing local alternative energy resources. Due to this, the diversification in the competitive landscape increases, creating demand for fracking solutions.

The country will likely invest to promote overseas energy procurement projects. This will generate more demand in the local market, elevating the industry's size.

Government to Fuel the Demand of the Frac Manifold Market in the United Kingdom

The United Kingdom’s new policy reforms emphasize reducing oil imports and fueling local businesses. This government initiative will likely spur the demand for fracking solutions in the local landscape.

Various government offerings, including subsidies, incentives, and tax relaxation on oil extraction, will help key players in the frac manifold industry. This will benefit the ecosystem.

Therefore, the United Kingdom’s growth of the frac manifold market will occur at 6.7% through the forecasted period.

Infrastructural Development Spurs the Growth of the Frac Manifold Market in India

India will likely heavily invest in infrastructural projects. Such projects will spur the demand for frac manifolds due to their ability to inject fracturing solutions.

The government and key players have been investing largely in the development of the oil and gas industry. This spurs the demand for fracking equipment and solutions, creating several industrial opportunities for key players.

These factors will inflate the demand of the frac manifold market at a CAGR of 7.7% through 2035.

Category-wise Insights into Frac Manifold Types and Applications

With the elevated safety standards and better operational efficiency, horizontal frac manifold systems gain traction in different sectors. However, the growing demand for oil and gas in day-to-day life governs the popularity of the segment in the industry.

Category By Integration- Horizontal
Industry Share in 2025 52.3%
Segment Drivers With the elevated efficiency and cost-effectiveness of the process, the segment gains popularity in the industry., Horizontal integration provides better alignment with environmental safety standards, driving the segment., Better operator safety enhances operational security, driving its demand and inflating the demand of the frac manifold market.
Category By Industry- Oil & Gas
Industry Share in 2025 31.4%
Segment Drivers With the extreme volatility of fracturing fluids in the sector, a safe operation is required. This can be provided by fracking equipment., The uniform distribution and less downtime of fracking manifold enhance their popularity., These factors fuel the demand in the oil and gas industry, elevating the demand of the frac manifold market.

Competitive Analysis of Key Players in the Frac Manifold Industry

Frac Manifold Market Analysis By Company

With the growing opportunities in developing countries, key players in the frac manifold industry can expand internationally, which can enhance their presence in foreign landscapes.

They also use different key strategies, including collaborations, acquisitions, partnerships, and mergers, to gain better strategic positions in the industry.

New entrants need more negotiating power against large-scale organizations, affecting their market share. However, innovation can uplift their functioning. It will provide them with a decent competitive edge.

Key Recent Developments

  • In May 2025, Jereh Group launched the JR7000QP Plunger Pump and innovative fracturing solutions. These product launches bolstered the organizational position in the competitive landscape, leveraging a decisive edge for the company.
  • In April 2025, SLB announced the launch of artificial lift systems in the industry. The firm aims to elevate performance and operational range. It will allow the organization to gain better space in the industry.

Scope of the Frac Manifold Market Report

Attributes Details
Estimated Industry Size in 2025 USD 5.87 billion
Projected Industry Valuation in 2035 USD 11.99 billion
Value-based CAGR 2025 to 2035 7.4%
Forecast Period 2025 to 2035
Historical Data Available for 2020 to 2025
Analysis in Value in USD billion
Key Regions Covered

North America; Latin America; Western Europe; Eastern Europe; South Asia and Pacific; East Asia; The Middle East and Africa

Key Segments Covered

Integration Type, Material, Outlet, Industry, Region

Key Countries Profiled

The United States, Canada, Brazil, Mexico, Germany, The United Kingdom, France, Spain, Italy, Poland, Russia, Czech Republic, Romania, India, Bangladesh, Australia, New Zealand, China, Japan, South Korea, GCC Countries, South Africa, Israel

Key Companies Profiled

SLB; Jereh Group; Landrill Oil Tools Co. Ltd.; NOV (National Oilwell Varco); Weatherford International; FMC Technologies; Yancheng Qihang Petroleum Machinery Co. Ltd.; Neeco Industries; Worldwide Oilfield Machine (WOM); Halliburton; GOES GmbH; Dixon

Segmentation of the Frac Manifold Market by Product Type, Application, and Region

By Integration Type:

Based on integration type, the industry is classified as Horizontal Frac Manifolds and Vertical Frac Manifolds.

By Material:

Carbon Steel, Stainless Steel, and Other Alloys are key materials used in the sector.

By Outlet:

The ecosystem is segmented into single-outlet and multiple-outlet systems.

By Industry:

Oil & Gas Industry, Shale Gas Industry, Coal Seam Gas Industry, and Other Energy Industries are key industrial segments of the landscape.

By Region:

The frac mani:fold industry analysis has been carried in key countries across North America, Latin America, Western Europe, Eastern Europe, South Asia and Pacific, East Asia and the Middle East and Africa

Frequently Asked Questions

How big is the frac manifold market in 2025?

The global frac manifold market is estimated to be valued at USD 6.3 billion in 2025.

What will be the size of frac manifold market in 2035?

The market size for the frac manifold market is projected to reach USD 12.9 billion by 2035.

How much will be the frac manifold market growth between 2025 and 2035?

The frac manifold market is expected to grow at a 7.3% CAGR between 2025 and 2035.

What are the key product types in the frac manifold market?

The key product types in frac manifold market are horizontal frac manifolds and vertical frac manifolds.

Which material segment to contribute significant share in the frac manifold market in 2025?

In terms of material, carbon steel segment to command 57.8% share in the frac manifold market in 2025.

Table of Content

  1. Executive Summary
    • Global Market Outlook
    • Demand-side Trends
    • Supply-side Trends
    • Technology Roadmap Analysis
    • Analysis and Recommendations
  2. Market Overview
    • Market Coverage / Taxonomy
    • Market Definition / Scope / Limitations
  3. Market Background
    • Market Dynamics
      • Drivers
      • Restraints
      • Opportunity
      • Trends
    • Scenario Forecast
      • Demand in Optimistic Scenario
      • Demand in Likely Scenario
      • Demand in Conservative Scenario
    • Opportunity Map Analysis
    • Product Life Cycle Analysis
    • Supply Chain Analysis
    • Investment Feasibility Matrix
    • Value Chain Analysis
    • PESTLE and Porter’s Analysis
    • Regulatory Landscape
    • Regional Parent Market Outlook
    • Production and Consumption Statistics
    • Import and Export Statistics
  4. Global Market Analysis 2020 to 2024 and Forecast, 2025 to 2035
    • Historical Market Size Value (USD Million) Analysis, 2020 to 2024
    • Current and Future Market Size Value (USD Million) Projections, 2025 to 2035
      • Y-o-Y Growth Trend Analysis
      • Absolute $ Opportunity Analysis
  5. Global Market Pricing Analysis 2020 to 2024 and Forecast 2025 to 2035
  6. Global Market Analysis 2020 to 2024 and Forecast 2025 to 2035, By Integration Type
    • Introduction / Key Findings
    • Historical Market Size Value (USD Million) Analysis By Integration Type , 2020 to 2024
    • Current and Future Market Size Value (USD Million) Analysis and Forecast By Integration Type , 2025 to 2035
      • Horizontal Frac Manifolds
      • Vertical Frac Manifolds
    • Y-o-Y Growth Trend Analysis By Integration Type , 2020 to 2024
    • Absolute $ Opportunity Analysis By Integration Type , 2025 to 2035
  7. Global Market Analysis 2020 to 2024 and Forecast 2025 to 2035, By Material
    • Introduction / Key Findings
    • Historical Market Size Value (USD Million) Analysis By Material, 2020 to 2024
    • Current and Future Market Size Value (USD Million) Analysis and Forecast By Material, 2025 to 2035
      • Carbon Steel
      • Stainless Steel
      • Other Alloys
    • Y-o-Y Growth Trend Analysis By Material, 2020 to 2024
    • Absolute $ Opportunity Analysis By Material, 2025 to 2035
  8. Global Market Analysis 2020 to 2024 and Forecast 2025 to 2035, By Outlet
    • Introduction / Key Findings
    • Historical Market Size Value (USD Million) Analysis By Outlet, 2020 to 2024
    • Current and Future Market Size Value (USD Million) Analysis and Forecast By Outlet, 2025 to 2035
      • Multiple Outlet
      • Single Outlet
    • Y-o-Y Growth Trend Analysis By Outlet, 2020 to 2024
    • Absolute $ Opportunity Analysis By Outlet, 2025 to 2035
  9. Global Market Analysis 2020 to 2024 and Forecast 2025 to 2035, By Industry
    • Introduction / Key Findings
    • Historical Market Size Value (USD Million) Analysis By Industry, 2020 to 2024
    • Current and Future Market Size Value (USD Million) Analysis and Forecast By Industry, 2025 to 2035
      • Oil & Gas Industry
      • Shale Gas Industry
      • Coal Seam Gas Industry
      • Other Energy Industries
    • Y-o-Y Growth Trend Analysis By Industry, 2020 to 2024
    • Absolute $ Opportunity Analysis By Industry, 2025 to 2035
  10. Global Market Analysis 2020 to 2024 and Forecast 2025 to 2035, By Region
    • Introduction
    • Historical Market Size Value (USD Million) Analysis By Region, 2020 to 2024
    • Current Market Size Value (USD Million) Analysis and Forecast By Region, 2025 to 2035
      • North America
      • Latin America
      • Western Europe
      • Eastern Europe
      • East Asia
      • South Asia and Pacific
      • Middle East & Africa
    • Market Attractiveness Analysis By Region
  11. North America Market Analysis 2020 to 2024 and Forecast 2025 to 2035, By Country
    • Historical Market Size Value (USD Million) Trend Analysis By Market Taxonomy, 2020 to 2024
    • Market Size Value (USD Million) Forecast By Market Taxonomy, 2025 to 2035
      • By Country
        • USA
        • Canada
        • Mexico
      • By Integration Type
      • By Material
      • By Outlet
      • By Industry
    • Market Attractiveness Analysis
      • By Country
      • By Integration Type
      • By Material
      • By Outlet
      • By Industry
    • Key Takeaways
  12. Latin America Market Analysis 2020 to 2024 and Forecast 2025 to 2035, By Country
    • Historical Market Size Value (USD Million) Trend Analysis By Market Taxonomy, 2020 to 2024
    • Market Size Value (USD Million) Forecast By Market Taxonomy, 2025 to 2035
      • By Country
        • Brazil
        • Chile
        • Rest of Latin America
      • By Integration Type
      • By Material
      • By Outlet
      • By Industry
    • Market Attractiveness Analysis
      • By Country
      • By Integration Type
      • By Material
      • By Outlet
      • By Industry
    • Key Takeaways
  13. Western Europe Market Analysis 2020 to 2024 and Forecast 2025 to 2035, By Country
    • Historical Market Size Value (USD Million) Trend Analysis By Market Taxonomy, 2020 to 2024
    • Market Size Value (USD Million) Forecast By Market Taxonomy, 2025 to 2035
      • By Country
        • Germany
        • UK
        • Italy
        • Spain
        • France
        • Nordic
        • BENELUX
        • Rest of Western Europe
      • By Integration Type
      • By Material
      • By Outlet
      • By Industry
    • Market Attractiveness Analysis
      • By Country
      • By Integration Type
      • By Material
      • By Outlet
      • By Industry
    • Key Takeaways
  14. Eastern Europe Market Analysis 2020 to 2024 and Forecast 2025 to 2035, By Country
    • Historical Market Size Value (USD Million) Trend Analysis By Market Taxonomy, 2020 to 2024
    • Market Size Value (USD Million) Forecast By Market Taxonomy, 2025 to 2035
      • By Country
        • Russia
        • Poland
        • Hungary
        • Balkan & Baltic
        • Rest of Eastern Europe
      • By Integration Type
      • By Material
      • By Outlet
      • By Industry
    • Market Attractiveness Analysis
      • By Country
      • By Integration Type
      • By Material
      • By Outlet
      • By Industry
    • Key Takeaways
  15. East Asia Market Analysis 2020 to 2024 and Forecast 2025 to 2035, By Country
    • Historical Market Size Value (USD Million) Trend Analysis By Market Taxonomy, 2020 to 2024
    • Market Size Value (USD Million) Forecast By Market Taxonomy, 2025 to 2035
      • By Country
        • China
        • Japan
        • South Korea
      • By Integration Type
      • By Material
      • By Outlet
      • By Industry
    • Market Attractiveness Analysis
      • By Country
      • By Integration Type
      • By Material
      • By Outlet
      • By Industry
    • Key Takeaways
  16. South Asia and Pacific Market Analysis 2020 to 2024 and Forecast 2025 to 2035, By Country
    • Historical Market Size Value (USD Million) Trend Analysis By Market Taxonomy, 2020 to 2024
    • Market Size Value (USD Million) Forecast By Market Taxonomy, 2025 to 2035
      • By Country
        • India
        • ASEAN
        • Australia & New Zealand
        • Rest of South Asia and Pacific
      • By Integration Type
      • By Material
      • By Outlet
      • By Industry
    • Market Attractiveness Analysis
      • By Country
      • By Integration Type
      • By Material
      • By Outlet
      • By Industry
    • Key Takeaways
  17. Middle East & Africa Market Analysis 2020 to 2024 and Forecast 2025 to 2035, By Country
    • Historical Market Size Value (USD Million) Trend Analysis By Market Taxonomy, 2020 to 2024
    • Market Size Value (USD Million) Forecast By Market Taxonomy, 2025 to 2035
      • By Country
        • Kingdom of Saudi Arabia
        • Other GCC Countries
        • Turkiye
        • South Africa
        • Other African Union
        • Rest of Middle East & Africa
      • By Integration Type
      • By Material
      • By Outlet
      • By Industry
    • Market Attractiveness Analysis
      • By Country
      • By Integration Type
      • By Material
      • By Outlet
      • By Industry
    • Key Takeaways
  18. Key Countries Market Analysis
    • USA
      • Pricing Analysis
      • Market Share Analysis, 2024
        • By Integration Type
        • By Material
        • By Outlet
        • By Industry
    • Canada
      • Pricing Analysis
      • Market Share Analysis, 2024
        • By Integration Type
        • By Material
        • By Outlet
        • By Industry
    • Mexico
      • Pricing Analysis
      • Market Share Analysis, 2024
        • By Integration Type
        • By Material
        • By Outlet
        • By Industry
    • Brazil
      • Pricing Analysis
      • Market Share Analysis, 2024
        • By Integration Type
        • By Material
        • By Outlet
        • By Industry
    • Chile
      • Pricing Analysis
      • Market Share Analysis, 2024
        • By Integration Type
        • By Material
        • By Outlet
        • By Industry
    • Germany
      • Pricing Analysis
      • Market Share Analysis, 2024
        • By Integration Type
        • By Material
        • By Outlet
        • By Industry
    • UK
      • Pricing Analysis
      • Market Share Analysis, 2024
        • By Integration Type
        • By Material
        • By Outlet
        • By Industry
    • Italy
      • Pricing Analysis
      • Market Share Analysis, 2024
        • By Integration Type
        • By Material
        • By Outlet
        • By Industry
    • Spain
      • Pricing Analysis
      • Market Share Analysis, 2024
        • By Integration Type
        • By Material
        • By Outlet
        • By Industry
    • France
      • Pricing Analysis
      • Market Share Analysis, 2024
        • By Integration Type
        • By Material
        • By Outlet
        • By Industry
    • India
      • Pricing Analysis
      • Market Share Analysis, 2024
        • By Integration Type
        • By Material
        • By Outlet
        • By Industry
    • ASEAN
      • Pricing Analysis
      • Market Share Analysis, 2024
        • By Integration Type
        • By Material
        • By Outlet
        • By Industry
    • Australia & New Zealand
      • Pricing Analysis
      • Market Share Analysis, 2024
        • By Integration Type
        • By Material
        • By Outlet
        • By Industry
    • China
      • Pricing Analysis
      • Market Share Analysis, 2024
        • By Integration Type
        • By Material
        • By Outlet
        • By Industry
    • Japan
      • Pricing Analysis
      • Market Share Analysis, 2024
        • By Integration Type
        • By Material
        • By Outlet
        • By Industry
    • South Korea
      • Pricing Analysis
      • Market Share Analysis, 2024
        • By Integration Type
        • By Material
        • By Outlet
        • By Industry
    • Russia
      • Pricing Analysis
      • Market Share Analysis, 2024
        • By Integration Type
        • By Material
        • By Outlet
        • By Industry
    • Poland
      • Pricing Analysis
      • Market Share Analysis, 2024
        • By Integration Type
        • By Material
        • By Outlet
        • By Industry
    • Hungary
      • Pricing Analysis
      • Market Share Analysis, 2024
        • By Integration Type
        • By Material
        • By Outlet
        • By Industry
    • Kingdom of Saudi Arabia
      • Pricing Analysis
      • Market Share Analysis, 2024
        • By Integration Type
        • By Material
        • By Outlet
        • By Industry
    • Turkiye
      • Pricing Analysis
      • Market Share Analysis, 2024
        • By Integration Type
        • By Material
        • By Outlet
        • By Industry
    • South Africa
      • Pricing Analysis
      • Market Share Analysis, 2024
        • By Integration Type
        • By Material
        • By Outlet
        • By Industry
  19. Market Structure Analysis
    • Competition Dashboard
    • Competition Benchmarking
    • Market Share Analysis of Top Players
      • By Regional
      • By Integration Type
      • By Material
      • By Outlet
      • By Industry
  20. Competition Analysis
    • Competition Deep Dive
      • SLB
        • Overview
        • Product Portfolio
        • Profitability by Market Segments (Product/Age /Sales Channel/Region)
        • Sales Footprint
        • Strategy Overview
          • Marketing Strategy
          • Product Strategy
          • Channel Strategy
      • Jereh Group
      • Landrill Oil Tools Co Ltd.
      • NOV (National Oilwell Varco)
      • Weatherford International
      • FMC Technologies
      • Yancheng Qihang Petroleum Machinery Co., Ltd
      • Neeco Industries
      • Worldwide Oilfield Machine (WOM)
      • Halliburton
      • GOES GmbH
      • Dixon
  21. Assumptions & Acronyms Used
  22. Research Methodology

List of Tables

  • Table 1: Global Market Value (USD Million) Forecast by Region, 2020 to 2035
  • Table 2: Global Market Value (USD Million) Forecast by Integration Type , 2020 to 2035
  • Table 3: Global Market Value (USD Million) Forecast by Material, 2020 to 2035
  • Table 4: Global Market Value (USD Million) Forecast by Outlet, 2020 to 2035
  • Table 5: Global Market Value (USD Million) Forecast by Industry, 2020 to 2035
  • Table 6: North America Market Value (USD Million) Forecast by Country, 2020 to 2035
  • Table 7: North America Market Value (USD Million) Forecast by Integration Type , 2020 to 2035
  • Table 8: North America Market Value (USD Million) Forecast by Material, 2020 to 2035
  • Table 9: North America Market Value (USD Million) Forecast by Outlet, 2020 to 2035
  • Table 10: North America Market Value (USD Million) Forecast by Industry, 2020 to 2035
  • Table 11: Latin America Market Value (USD Million) Forecast by Country, 2020 to 2035
  • Table 12: Latin America Market Value (USD Million) Forecast by Integration Type , 2020 to 2035
  • Table 13: Latin America Market Value (USD Million) Forecast by Material, 2020 to 2035
  • Table 14: Latin America Market Value (USD Million) Forecast by Outlet, 2020 to 2035
  • Table 15: Latin America Market Value (USD Million) Forecast by Industry, 2020 to 2035
  • Table 16: Western Europe Market Value (USD Million) Forecast by Country, 2020 to 2035
  • Table 17: Western Europe Market Value (USD Million) Forecast by Integration Type , 2020 to 2035
  • Table 18: Western Europe Market Value (USD Million) Forecast by Material, 2020 to 2035
  • Table 19: Western Europe Market Value (USD Million) Forecast by Outlet, 2020 to 2035
  • Table 20: Western Europe Market Value (USD Million) Forecast by Industry, 2020 to 2035
  • Table 21: Eastern Europe Market Value (USD Million) Forecast by Country, 2020 to 2035
  • Table 22: Eastern Europe Market Value (USD Million) Forecast by Integration Type , 2020 to 2035
  • Table 23: Eastern Europe Market Value (USD Million) Forecast by Material, 2020 to 2035
  • Table 24: Eastern Europe Market Value (USD Million) Forecast by Outlet, 2020 to 2035
  • Table 25: Eastern Europe Market Value (USD Million) Forecast by Industry, 2020 to 2035
  • Table 26: East Asia Market Value (USD Million) Forecast by Country, 2020 to 2035
  • Table 27: East Asia Market Value (USD Million) Forecast by Integration Type , 2020 to 2035
  • Table 28: East Asia Market Value (USD Million) Forecast by Material, 2020 to 2035
  • Table 29: East Asia Market Value (USD Million) Forecast by Outlet, 2020 to 2035
  • Table 30: East Asia Market Value (USD Million) Forecast by Industry, 2020 to 2035
  • Table 31: South Asia and Pacific Market Value (USD Million) Forecast by Country, 2020 to 2035
  • Table 32: South Asia and Pacific Market Value (USD Million) Forecast by Integration Type , 2020 to 2035
  • Table 33: South Asia and Pacific Market Value (USD Million) Forecast by Material, 2020 to 2035
  • Table 34: South Asia and Pacific Market Value (USD Million) Forecast by Outlet, 2020 to 2035
  • Table 35: South Asia and Pacific Market Value (USD Million) Forecast by Industry, 2020 to 2035
  • Table 36: Middle East & Africa Market Value (USD Million) Forecast by Country, 2020 to 2035
  • Table 37: Middle East & Africa Market Value (USD Million) Forecast by Integration Type , 2020 to 2035
  • Table 38: Middle East & Africa Market Value (USD Million) Forecast by Material, 2020 to 2035
  • Table 39: Middle East & Africa Market Value (USD Million) Forecast by Outlet, 2020 to 2035
  • Table 40: Middle East & Africa Market Value (USD Million) Forecast by Industry, 2020 to 2035

List of Figures

  • Figure 1: Global Market Pricing Analysis
  • Figure 2: Global Market Value (USD Million) Forecast 2020 to 2035
  • Figure 3: Global Market Value Share and BPS Analysis by Integration Type , 2025 and 2035
  • Figure 4: Global Market Y-o-Y Growth Comparison by Integration Type , 2025 to 2035
  • Figure 5: Global Market Attractiveness Analysis by Integration Type
  • Figure 6: Global Market Value Share and BPS Analysis by Material, 2025 and 2035
  • Figure 7: Global Market Y-o-Y Growth Comparison by Material, 2025 to 2035
  • Figure 8: Global Market Attractiveness Analysis by Material
  • Figure 9: Global Market Value Share and BPS Analysis by Outlet, 2025 and 2035
  • Figure 10: Global Market Y-o-Y Growth Comparison by Outlet, 2025 to 2035
  • Figure 11: Global Market Attractiveness Analysis by Outlet
  • Figure 12: Global Market Value Share and BPS Analysis by Industry, 2025 and 2035
  • Figure 13: Global Market Y-o-Y Growth Comparison by Industry, 2025 to 2035
  • Figure 14: Global Market Attractiveness Analysis by Industry
  • Figure 15: Global Market Value (USD Million) Share and BPS Analysis by Region, 2025 and 2035
  • Figure 16: Global Market Y-o-Y Growth Comparison by Region, 2025 to 2035
  • Figure 17: Global Market Attractiveness Analysis by Region
  • Figure 18: North America Market Incremental Dollar Opportunity, 2025 to 2035
  • Figure 19: Latin America Market Incremental Dollar Opportunity, 2025 to 2035
  • Figure 20: Western Europe Market Incremental Dollar Opportunity, 2025 to 2035
  • Figure 21: Eastern Europe Market Incremental Dollar Opportunity, 2025 to 2035
  • Figure 22: East Asia Market Incremental Dollar Opportunity, 2025 to 2035
  • Figure 23: South Asia and Pacific Market Incremental Dollar Opportunity, 2025 to 2035
  • Figure 24: Middle East & Africa Market Incremental Dollar Opportunity, 2025 to 2035
  • Figure 25: North America Market Value Share and BPS Analysis by Country, 2025 and 2035
  • Figure 26: North America Market Value Share and BPS Analysis by Integration Type , 2025 and 2035
  • Figure 27: North America Market Y-o-Y Growth Comparison by Integration Type , 2025 to 2035
  • Figure 28: North America Market Attractiveness Analysis by Integration Type
  • Figure 29: North America Market Value Share and BPS Analysis by Material, 2025 and 2035
  • Figure 30: North America Market Y-o-Y Growth Comparison by Material, 2025 to 2035
  • Figure 31: North America Market Attractiveness Analysis by Material
  • Figure 32: North America Market Value Share and BPS Analysis by Outlet, 2025 and 2035
  • Figure 33: North America Market Y-o-Y Growth Comparison by Outlet, 2025 to 2035
  • Figure 34: North America Market Attractiveness Analysis by Outlet
  • Figure 35: North America Market Value Share and BPS Analysis by Industry, 2025 and 2035
  • Figure 36: North America Market Y-o-Y Growth Comparison by Industry, 2025 to 2035
  • Figure 37: North America Market Attractiveness Analysis by Industry
  • Figure 38: Latin America Market Value Share and BPS Analysis by Country, 2025 and 2035
  • Figure 39: Latin America Market Value Share and BPS Analysis by Integration Type , 2025 and 2035
  • Figure 40: Latin America Market Y-o-Y Growth Comparison by Integration Type , 2025 to 2035
  • Figure 41: Latin America Market Attractiveness Analysis by Integration Type
  • Figure 42: Latin America Market Value Share and BPS Analysis by Material, 2025 and 2035
  • Figure 43: Latin America Market Y-o-Y Growth Comparison by Material, 2025 to 2035
  • Figure 44: Latin America Market Attractiveness Analysis by Material
  • Figure 45: Latin America Market Value Share and BPS Analysis by Outlet, 2025 and 2035
  • Figure 46: Latin America Market Y-o-Y Growth Comparison by Outlet, 2025 to 2035
  • Figure 47: Latin America Market Attractiveness Analysis by Outlet
  • Figure 48: Latin America Market Value Share and BPS Analysis by Industry, 2025 and 2035
  • Figure 49: Latin America Market Y-o-Y Growth Comparison by Industry, 2025 to 2035
  • Figure 50: Latin America Market Attractiveness Analysis by Industry
  • Figure 51: Western Europe Market Value Share and BPS Analysis by Country, 2025 and 2035
  • Figure 52: Western Europe Market Value Share and BPS Analysis by Integration Type , 2025 and 2035
  • Figure 53: Western Europe Market Y-o-Y Growth Comparison by Integration Type , 2025 to 2035
  • Figure 54: Western Europe Market Attractiveness Analysis by Integration Type
  • Figure 55: Western Europe Market Value Share and BPS Analysis by Material, 2025 and 2035
  • Figure 56: Western Europe Market Y-o-Y Growth Comparison by Material, 2025 to 2035
  • Figure 57: Western Europe Market Attractiveness Analysis by Material
  • Figure 58: Western Europe Market Value Share and BPS Analysis by Outlet, 2025 and 2035
  • Figure 59: Western Europe Market Y-o-Y Growth Comparison by Outlet, 2025 to 2035
  • Figure 60: Western Europe Market Attractiveness Analysis by Outlet
  • Figure 61: Western Europe Market Value Share and BPS Analysis by Industry, 2025 and 2035
  • Figure 62: Western Europe Market Y-o-Y Growth Comparison by Industry, 2025 to 2035
  • Figure 63: Western Europe Market Attractiveness Analysis by Industry
  • Figure 64: Eastern Europe Market Value Share and BPS Analysis by Country, 2025 and 2035
  • Figure 65: Eastern Europe Market Value Share and BPS Analysis by Integration Type , 2025 and 2035
  • Figure 66: Eastern Europe Market Y-o-Y Growth Comparison by Integration Type , 2025 to 2035
  • Figure 67: Eastern Europe Market Attractiveness Analysis by Integration Type
  • Figure 68: Eastern Europe Market Value Share and BPS Analysis by Material, 2025 and 2035
  • Figure 69: Eastern Europe Market Y-o-Y Growth Comparison by Material, 2025 to 2035
  • Figure 70: Eastern Europe Market Attractiveness Analysis by Material
  • Figure 71: Eastern Europe Market Value Share and BPS Analysis by Outlet, 2025 and 2035
  • Figure 72: Eastern Europe Market Y-o-Y Growth Comparison by Outlet, 2025 to 2035
  • Figure 73: Eastern Europe Market Attractiveness Analysis by Outlet
  • Figure 74: Eastern Europe Market Value Share and BPS Analysis by Industry, 2025 and 2035
  • Figure 75: Eastern Europe Market Y-o-Y Growth Comparison by Industry, 2025 to 2035
  • Figure 76: Eastern Europe Market Attractiveness Analysis by Industry
  • Figure 77: East Asia Market Value Share and BPS Analysis by Country, 2025 and 2035
  • Figure 78: East Asia Market Value Share and BPS Analysis by Integration Type , 2025 and 2035
  • Figure 79: East Asia Market Y-o-Y Growth Comparison by Integration Type , 2025 to 2035
  • Figure 80: East Asia Market Attractiveness Analysis by Integration Type
  • Figure 81: East Asia Market Value Share and BPS Analysis by Material, 2025 and 2035
  • Figure 82: East Asia Market Y-o-Y Growth Comparison by Material, 2025 to 2035
  • Figure 83: East Asia Market Attractiveness Analysis by Material
  • Figure 84: East Asia Market Value Share and BPS Analysis by Outlet, 2025 and 2035
  • Figure 85: East Asia Market Y-o-Y Growth Comparison by Outlet, 2025 to 2035
  • Figure 86: East Asia Market Attractiveness Analysis by Outlet
  • Figure 87: East Asia Market Value Share and BPS Analysis by Industry, 2025 and 2035
  • Figure 88: East Asia Market Y-o-Y Growth Comparison by Industry, 2025 to 2035
  • Figure 89: East Asia Market Attractiveness Analysis by Industry
  • Figure 90: South Asia and Pacific Market Value Share and BPS Analysis by Country, 2025 and 2035
  • Figure 91: South Asia and Pacific Market Value Share and BPS Analysis by Integration Type , 2025 and 2035
  • Figure 92: South Asia and Pacific Market Y-o-Y Growth Comparison by Integration Type , 2025 to 2035
  • Figure 93: South Asia and Pacific Market Attractiveness Analysis by Integration Type
  • Figure 94: South Asia and Pacific Market Value Share and BPS Analysis by Material, 2025 and 2035
  • Figure 95: South Asia and Pacific Market Y-o-Y Growth Comparison by Material, 2025 to 2035
  • Figure 96: South Asia and Pacific Market Attractiveness Analysis by Material
  • Figure 97: South Asia and Pacific Market Value Share and BPS Analysis by Outlet, 2025 and 2035
  • Figure 98: South Asia and Pacific Market Y-o-Y Growth Comparison by Outlet, 2025 to 2035
  • Figure 99: South Asia and Pacific Market Attractiveness Analysis by Outlet
  • Figure 100: South Asia and Pacific Market Value Share and BPS Analysis by Industry, 2025 and 2035
  • Figure 101: South Asia and Pacific Market Y-o-Y Growth Comparison by Industry, 2025 to 2035
  • Figure 102: South Asia and Pacific Market Attractiveness Analysis by Industry
  • Figure 103: Middle East & Africa Market Value Share and BPS Analysis by Country, 2025 and 2035
  • Figure 104: Middle East & Africa Market Value Share and BPS Analysis by Integration Type , 2025 and 2035
  • Figure 105: Middle East & Africa Market Y-o-Y Growth Comparison by Integration Type , 2025 to 2035
  • Figure 106: Middle East & Africa Market Attractiveness Analysis by Integration Type
  • Figure 107: Middle East & Africa Market Value Share and BPS Analysis by Material, 2025 and 2035
  • Figure 108: Middle East & Africa Market Y-o-Y Growth Comparison by Material, 2025 to 2035
  • Figure 109: Middle East & Africa Market Attractiveness Analysis by Material
  • Figure 110: Middle East & Africa Market Value Share and BPS Analysis by Outlet, 2025 and 2035
  • Figure 111: Middle East & Africa Market Y-o-Y Growth Comparison by Outlet, 2025 to 2035
  • Figure 112: Middle East & Africa Market Attractiveness Analysis by Outlet
  • Figure 113: Middle East & Africa Market Value Share and BPS Analysis by Industry, 2025 and 2035
  • Figure 114: Middle East & Africa Market Y-o-Y Growth Comparison by Industry, 2025 to 2035
  • Figure 115: Middle East & Africa Market Attractiveness Analysis by Industry
  • Figure 116: Global Market – Tier Structure Analysis
  • Figure 117: Global Market – Company Share Analysis
Dashboard
Dashboard
Dashboard
Dashboard
Dashboard
Dashboard

Full Research Suite comprises of:

Market outlook & trends analysis

Market outlook & trends analysis

Interviews & case studies

Interviews & case studies

Strategic recommendations

Strategic recommendations

Vendor profiles & capabilities analysis

Vendor profiles & capabilities analysis

5-year forecasts

5-year forecasts

8 regions and 60+ country-level data splits

8 regions and 60+ country-level data splits

Market segment data splits

Market segment data splits

12 months of continuous data updates

12 months of continuous data updates

DELIVERED AS:

PDF EXCEL ONLINE

Full Research Suite


$5000

$7500

$10000

Buy Report Now
Similar Industry Reports

Similar Industry Reports

Fracking Fluids And Chemicals Market

Fracking Fluids And Chemicals Market Size and Share Forecast Outlook 2025 to 2035

Fractionated Fatty Acid Market

Fractionated Fatty Acid Market Size, Growth, and Forecast for 2025 to 2035

Fractionated Lecithin Market

Fractionated Lecithin Market Growth - Source & Industry Trends

Refractor Type Telephoto Lens Market

Refractor Type Telephoto Lens Market Size and Share Forecast Outlook 2025 to 2035

Refractor Type Optical Telephoto Lens Market

Refractor Type Optical Telephoto Lens Market Size and Share Forecast Outlook 2025 to 2035

Refractories Market
Refractories Market

Refractories Market Size and Share Forecast Outlook 2025 to 2035

Refractory Cement Market

Refractory Cement Market Growth – Trends & Forecast 2024-2034

Refractive Surgery Device Market

Refractive Surgery Device Market Insights – Growth & Forecast 2024-2034

Refractometers Market

Refractometers Market Growth – Trends & Forecast 2018-2027

Rib Fracture Repair Systems Market

Rib Fracture Repair Systems Market Size and Share Forecast Outlook 2025 to 2035

Abbe Refractometers Market

Abbe Refractometers Market Size and Share Forecast Outlook 2025 to 2035

Palm Mid-Fraction Market

Palm Mid-Fraction Market Size, Growth, and Forecast for 2025 to 2035

Milk Fat Fractions Market

Milk Fat Fractions Market

Hydraulic Fracturing Market

Hydraulic Fracturing Market Size and Share Forecast Outlook 2025 to 2035

Chronic Refractory Cough Treatment Market

Chronic Refractory Cough Treatment Market – Growth & Innovations 2025 to 2035

Clinical Refractometer Market

Clinical Refractometer Market Size and Share Forecast Outlook 2025 to 2035

Industrial Fractional Horsepower Motors Market

Industrial Fractional Horsepower Motors Market Analysis by End-user and Region: Forecast for 2025 to 2035

Butylene-divinyl Fraction Market

Butylene-divinyl Fraction Market Growth – Trends & Forecast 2024-2034

Anti-Osteoporosis Fracture Healing Market

Anti-Osteoporosis Fracture Healing Market Trends – Size & Forecast 2025-2035

Anti-Osteoporosis Fracture Healing Market Share Analysis

Examining Market Share Trends in Anti-Osteoporosis Fracture Healing

Future Market Insights

Frac Manifold Market

Chat With MaRIA

Chat With

MaRIA

Hi There, I am MaRIA, Your Market Research Intelligence Assistant. How may I help you?