

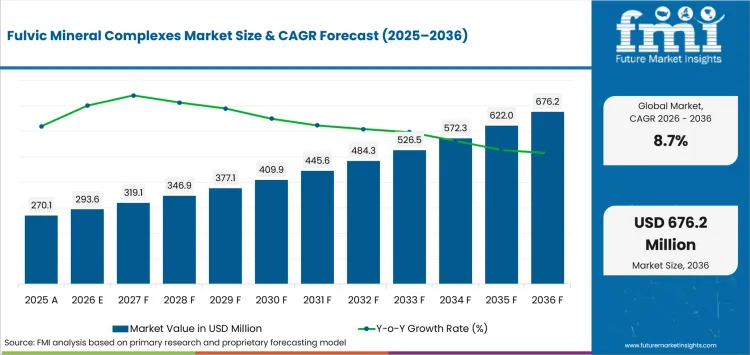
- Market Size (2026)
- USD 293.6 Mn
- Forecast (2036)
- USD 676.2 Mn
- CAGR (2026 to 2036)
- 8.7%
How big is Fulvic Mineral Complexes Market in 2026?
USD 293.6 million in 2026 and USD 676.2 million by 2036 at an 8.7% CAGR.
Demand for fulvic mineral complexes is projected to expand at 8.7% CAGR between 2026 and 2036, increasing valuation from USD 293.6 million in 2026 to USD 676.2 million by 2036. Crop programs pay for complexing chemistry where pH or fixation reduces usable iron and other trace minerals. In November 2025, USDA Economic Research Service noted that nutrient-management practices can improve nutrient accessibility and plant uptake. That operating need directs spending toward soluble complexes that correct a measured deficiency instead of increasing bulk fertilizer use.
Country adoption diverges because agronomic planning and product qualification change the route from technical fit to repeat orders. Defra found in June 2026 that 78% of farmers in England regularly tested soil nutrient indices and 79% regularly tested pH. A strong testing base makes chemistry selection easier because advisers can tie a premium complex to a measured soil condition. Markets with heavier documentation require more technical support before the same product earns repeat use.
Key Takeaways
- Demand rises when crop advisers can tie complexing chemistry to a diagnosed micronutrient shortage and a defined application route.
- By chelating - complexing agent, EDTA - synthetic chelates are estimated to hold 43.8% in 2026 owing to familiar ligand specifications and formulation practice.
- In 2026, iron is expected to lead nutrient demand with 42.7% share because high-pH conditions can sharply restrict untreated iron availability.
- Cereals & grains are set to lead crop type with 43.9% share in 2026 due to micronutrient correction fitting scheduled seasonal field passes.
- Premium complexes lose economic appeal where soil tests show adequate nutrient supply or a lower-cost mineral salt performs reliably.
- Some of the key players in this market include BASF, Nouryon, Yara International, ICL Group, Haifa Group, Valagro (Syngenta Biologicals), Compo Expert, and Van Iperen International.
Analyst Perspective
"Chelate price belongs late in the buying decision because stability at the target pH must be proved first. A diagnosed deficiency then determines whether the added formulation cost can produce a faster or more dependable correction."
- Nandini Roy Choudhury, Principal Consultant, Future Market Insights
How is the fulvic mineral complexes market segmented?
The fulvic mineral complexes market is segmented by chelating - complexing agent, nutrient, crop type, application method and sales channel.
Chelating - complexing agent covers EDTA - synthetic chelates, amino acid complexes, organic acid complexes and lignosulfonates & others. Nutrient covers iron, zinc, manganese & copper, boron - moly & multi-nutrient and others. Crop type covers cereals & grains, fruits & vegetables, oilseeds & pulses, turf & ornamentals and others. Application method covers fertigation, foliar, soil and others. Sales channel covers agri-input distributors, cooperatives, agri-retail chains, online - direct-to-farm and others.
What supports fertigation as the leading application method?
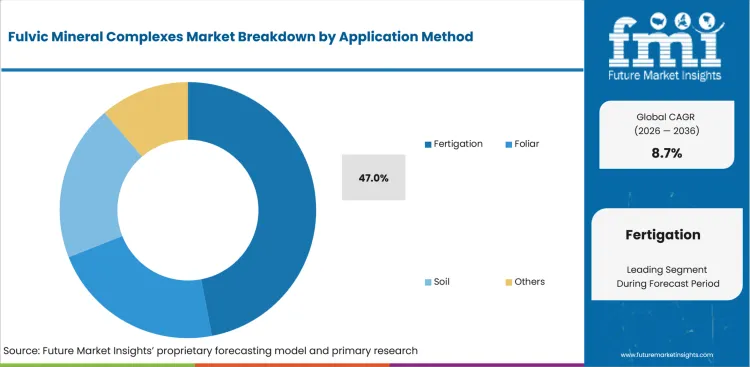
Fertigation puts soluble complexes into an irrigation schedule, so formulation quality is tested through dissolution and water compatibility before crop response. Water-soluble fertilizers reduce the need for a separate field pass where injection equipment already serves the root zone.
- By application method, fertigation is forecast to represent 47.0% in 2026 driven by soluble complexes fitting irrigation equipment already used for crop nutrition.
- ICL opened a water-soluble fertilizer facility in Maharashtra in March 2026 to increase local specialty-nutrition supply. The plant expands production for precise nutrient delivery.
What makes EDTA - synthetic chelates central to the chelating - complexing agent category?
EDTA - synthetic chelates remain the reference chemistry for formulators that need soluble metal nutrients to survive mixing and application. Agricultural chelates enter qualification through ligand stability and handling records. Newer ligands still need equivalent crop-response evidence before they displace familiar chelation routes.
- Based on chelating - complexing agent, EDTA - synthetic chelates are projected to account for 43.8% in 2026 due to familiar ligand specifications and handling.
- Nouryon documented in October 2025 that HBED keeps iron soluble under high-pH and high-carbonate conditions. Its field evidence keeps stability central to chelate qualification.
Why does iron hold the leading position in the nutrient category?
Iron purchases begin with an availability problem instead of total mineral content. High-pH root zones can precipitate soluble iron before uptake. Crop micronutrients therefore need chemistry and application guidance that keep the applied metal available long enough to reach the plant.
- In 2026, iron is expected to lead the nutrient category with 42.7% share because visible deficiency makes failed iron delivery commercially costly in responsive crops.
- BASF launched its Japanese Humus soil-improvement service in October 2025 with field diagnosis and prescribed nutrients including micronutrients. The service ties nutrient choice to measured soil condition.
How do cereals & grains sustain leadership in the crop type category?
Cereal programs give micronutrient formulators large treated acreages and scheduled fertilizer passes. Premium chemistry still needs a diagnosed response before the added cost is accepted. Specialty fertilizers fit best when agronomists can insert correction into field work already planned for the crop.
- Cereals & grains are set to lead the crop type category with 43.9% share in 2026 due to correction fitting field operations already scheduled for major crops.
- USDA NASS estimated 95.2 million acres of corn planted in the United States for 2025. That field base gives dealer agronomy substantial scope for diagnosed micronutrient correction.
Why do agri-input distributors lead the sales channel category?
Agri-input distributors turn soil tests and crop advice into product choice because mineral complexes are specification-sensitive. Chelated micronutrient blends sell more readily through local agronomy that explains ligand stability and water chemistry before a grower repeats the order.
- Agri-input distributors are projected to hold 37.1% of sales channel demand in 2026 owing to local stock and technical recommendation being available near the farm decision.
- Haifa Group opened its eighteenth international subsidiary in India in January 2025 to expand access to specialty fertilizers and crop-nutrition support. The move puts technical service closer to local distribution.
What are the drivers, restraints and opportunities in the Fulvic Mineral Complexes Market?
Diagnosed micronutrient need increases demand, premium formulation economics limit routine use and biodegradable chelating chemistry offers a differentiated crop-nutrition route.
- Driver: Nutrient planning turns a measured deficiency into a specific need for soluble or protected mineral delivery.
- Restraint: Premium chemistry is harder to justify if a simpler mineral salt meets the crop requirement at lower cost.
- Opportunity: Biodegradable chelating systems can win formulation programs after field trials prove nutrient availability and application compatibility.
Complexed micronutrients sell more readily after nutrient planning identifies a specific shortage and an application window. AHDB released RB209 2026 in March after more than 900 people contributed to its review. Nutrient-use efficiency ranked as the highest research priority. That planning discipline narrows demand toward products that solve a measured nutrient problem and fit the farm fertilizer schedule.
Premium chemistry faces a harder sell if fertilizer budgets are already under pressure and a simpler mineral source meets the field need. Destatis reported in June 2026 that German single-nutrient fertilizer prices rose 8.9% from January to April. Higher input costs sharpen cost-per-hectare comparisons. A fulvic or chelated product therefore needs field evidence that its stability or application fit justifies the extra formulation expense.
Biodegradable complexing systems can win development budgets where manufacturers need lower persistence without losing measurable nutrient availability. Nouryon disclosed in May 2026 that 76% of its R&D product pipeline targeted sustainability benefits including biodegradability or improved environmental profiles. Crop-nutrition formulators can commercialize that chemistry after trials establish pH stability and nutrient release for the intended application route.
Which country CAGRs are profiled in the Fulvic Mineral Complexes Market?
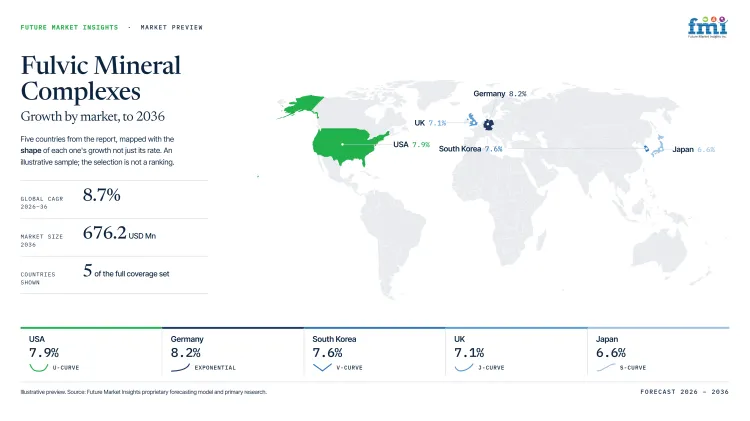
| Country | CAGR |
|---|---|
| Germany | 8.2% |
| USA | 7.9% |
| South Korea | 7.6% |
| UK | 7.1% |
| Japan | 6.6% |
How do country-level CAGRs compare in the Fulvic Mineral Complexes Market?
Germany, USA and South Korea form the upper growth group within a 1.6-point spread. The UK and Japan follow at slower rates. The gap is narrow enough that service cost and qualification work can matter more than CAGR alone when companies sequence technical investment.
- Germany offers concentrated cereal and horticulture programs that can support larger field-validation programs.
- USA distributors work inside large row-crop seasons where dealer coverage can accelerate commercial trials.
- South Korea gives specialty nutrition a route through protected and higher-value crop channels with tighter specification control.
- UK advisers test specialty additions against structured fertilizer budgets and formal nutrient plans.
- Japan gives distributors a slower qualification path because unfamiliar formulations usually enter through smaller crop-specific trials.
Similar CAGRs can therefore produce different service costs and qualification timelines. The full report provides country-level CAGR analysis for North America, Latin America, Western Europe, Eastern Europe, East Asia, South Asia and Pacific, and Middle East and Africa.
Country-wise Analysis
- Germany’s large cereal base gives agronomists a practical setting to test complexed micronutrients against soil condition and application timing. Trials of humic acid inputs can also clarify whether organic complexing adds enough response to justify a premium. In May 2026, Destatis estimated 6.03 million hectares of cereals for the 2026 harvest and a 1.8% increase from 2025. Germany is projected to record 8.2% CAGR for fulvic mineral complexes during the assessment period, attributable to technically managed crop programs and strict fertilizer documentation. The market still has a structural entry cost because unfamiliar ligand claims require more documentation than established mineral salts.
- In USA, large row-crop programs place micronutrient decisions within dealer agronomy and fertilizer passes that already cover very large acreages. Biofertilizer programs can use the same adviser network for trials that compare biological and mineral nutrition. The USA is forecast to post 7.9% CAGR for fulvic mineral complexes over the forecast period, driven by large seasonal crop programs and adviser-led input decisions. USDA NASS estimated 95.3 million corn acres and 85.4 million soybean acres in June 2026. Scale lowers distribution friction. The remaining commercial test is whether each complex delivers enough added response to move spending away from simpler nutrient salts.
- In South Korea, specialty-fertilizer programs typically move through formal product specifications and guaranteed nutrient information before wider distribution. Biostimulant products can gain trial access in greenhouse and higher-value crop programs. The 2025 barley and wheat area reached 34,314 hectares and rose 4.5% from the prior year according to the Ministry of Data and Statistics. Documentation changes can still delay reformulation or re-registration. South Korea is predicted to advance at 7.6% CAGR for fulvic mineral complexes through 2036, tied to specialty nutrition programs that value specification control. Importers therefore need local regulatory support before a new complexing chemistry can move from technical interest to a broader distributor listing.
- For UK arable advisers, fertilizer choices sit within formal nutrient plans, so new micronutrient products compete for a defined farm budget. Fulvic mineral complexes sales in the UK are forecast to expand at 7.1% CAGR by 2036, aided by diagnostic planning and adviser-led input decisions. Defra launched NMPT-GB in February 2026 to match nutrient inputs with crop and soil need. That planning route gives micro irrigation systems and soluble nutrition a clear point of entry. It also exposes products that lack a measured deficiency case. Commercial progress depends on field evidence that a complexed form improves the planned treatment without merely raising product cost.
- Japan’s fertilizer qualification process gives consistent specification and crop-specific evidence substantial weight before distributors broaden a recommendation. Protected production gives humic and fulvic biostimulants a controlled setting for local trials. Repeat orders still depend on stable nutrient guarantees and technical support. Adoption of fulvic mineral complexes in Japan is estimated to expand at 6.6% CAGR through 2036, helped by specialized crop programs and cautious product qualification. MAFF recorded 229,500 hectares of wheat planted for the 2025 crop and output of 1.022 million tonnes. The slower forecast points to a deliberate route from technical trial to routine sale even with a meaningful commercial crop base.
Who are the notable companies in the Fulvic Mineral Complexes Market?
BASF, Nouryon, Yara International, ICL Group, Haifa Group, Valagro (Syngenta Biologicals), Compo Expert, and Van Iperen International are the notable companies serving this market.
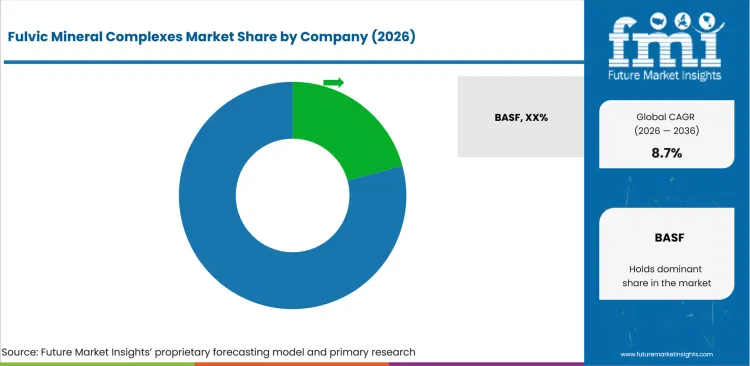
Competition separates direct chelate chemistry from crop-nutrition groups that control agronomy and distribution. Nouryon has the clearest current evidence of a named iron-chelate route. Yara, ICL and Haifa bring specialty nutrition into broader crop programs. BASF and Syngenta add research and digital agronomy. Compo Expert and Van Iperen compete closer to application support. Entry depends on ligand performance and local service more than corporate scale alone.
- Chelate chemistry and formulation: BASF and Nouryon hold the first two positions in the profiled company register.
- Integrated crop nutrition: Yara International, ICL Group and Haifa Group place micronutrients inside wider crop programs with agronomic support.
- Specialty formulation and biological platforms: Valagro (Syngenta Biologicals), Compo Expert and Van Iperen International serve crop-specific formulation or nutrient-efficiency routes.
Competitive Benchmarking: Fulvic Mineral Complexes Market
| Company | Direct Market Evidence | Application Integration | Recent Evidence Depth | Geographic Reach |
|---|---|---|---|---|
| BASF | Medium | High | High | Global |
| Nouryon | High | Medium | High | Global |
| Yara International | Medium | High | High | Global |
| ICL Group | High | High | High | Global |
| Haifa Group | Medium | High | High | More than 100 countries |
| Valagro (Syngenta Biologicals) | Low | Medium | High | Global via Syngenta |
| Compo Expert | Medium | High | Medium | International specialty-fertilizer markets |
| Van Iperen International | Low | Medium | Medium | International partner network |
Scoring basis: High direct-market evidence requires a 2025-2026 official source that explicitly names chelated or complexed micronutrients. Medium covers current micronutrient or specialty plant-nutrition evidence, while Low marks an adjacent fertilizer or biological route. High application integration requires diagnostics, field support or several delivery routes. Medium covers one documented route. Recent evidence depth is High with two or more qualifying current sources, Medium with one and Low with adjacent evidence only.
Key Developments in the Fulvic Mineral Complexes Market
- ICL Group launched Bioz Kellus in April 2026 with manganese plus zinc and copper formulations using a biodegradable chelating system for foliar crop nutrition.
- Compo Expert introduced the Basfoliar Premium SL line in April 2025 with Leaf Care Technology for pH buffering plus low osmotic pressure and tank-mix compatibility.
- In March 2026, Yara International expanded its Hanninghof Research Centre to develop and validate biological crop solutions alongside specialty nutrition and micronutrients.
Key Players in the Fulvic Mineral Complexes Market
Chelate Chemistry and Formulation
- BASF
- Nouryon
Integrated Crop Nutrition
- Yara International
- ICL Group
- Haifa Group
Specialty Formulation and Biological Platforms
- Valagro (Syngenta Biologicals)
- Compo Expert
- Van Iperen International
Fulvic Mineral Complexes Market - Report Scope
| Coverage field | Report scope |
|---|---|
| Market breakdown | By chelating - complexing agent, nutrient, crop type, application method, sales channel and region. |
| Quantitative Units | USD million. |
| Market Definition | Revenue from agricultural fulvic mineral complexes and mineral micronutrient products sold within the stated chelating or complexing agent, nutrient, crop, application and sales-channel universe. Downstream finished-product revenue and adjacent or substitute product revenue are excluded. |
| Regions Covered | North America, Latin America, Western Europe, Eastern Europe, East Asia, South Asia and Pacific, and Middle East and Africa. |
| Countries Covered | Germany, USA, South Korea, UK, Japan, and 20+ countries included in the full report. |
| Key Companies Profiled | BASF, Nouryon, Yara International, ICL Group, Haifa Group, Valagro (Syngenta Biologicals), Compo Expert, Van Iperen International. |
| Forecast Period | 2026 to 2036. |
| Approach | Primary and secondary research with market triangulation. |
Fulvic Mineral Complexes Market - Research Methodology
| Method | Approach |
|---|---|
| Primary Research | FMI analysts gathered input from manufacturers, service providers, technology developers, distributors, end users, procurement teams, and subject-matter experts. Interviews examined purchasing decisions, product or service evaluation, adoption barriers, approval requirements, pricing considerations, and expectations for technical or commercial support. Respondents were also asked what evidence is required before a trial, pilot, or initial order develops into regular purchasing. |
| Desk Research | Desk research covered government statistics, regulatory publications, trade data, industry associations, technical literature, standards, company filings, product information, and official corporate announcements. Sources were reviewed for relevance, publication date, geographic coverage, and consistency with the defined market scope. Claims relating to performance, applications, approvals, capacity, investment, and commercial activity were retained only when supported by credible public evidence. |
| Market Sizing and Forecasting | The market model combined the baseline value with historical performance, segment structure, pricing and volume indicators, adoption levels, company participation, and country-level demand conditions. Forecast assumptions considered economic activity, investment trends, regulatory developments, technology adoption, purchasing cycles, supply availability, and barriers to wider market use. Segment and regional estimates were reconciled before the final market total was calculated. |
| Data Validation | Estimates were checked against multiple independent indicators, including public data, company activity, trade patterns, industry developments, and findings from primary interviews. Validation also tested whether products, services, applications, and company revenues fell within the defined market boundaries. Adjacent categories, unsupported claims, overlapping revenues, and activities without direct market relevance were excluded to reduce double counting and maintain consistency across segments and countries. |
Fulvic Mineral Complexes Market by Segments
Fulvic Mineral Complexes Market segmented by Chelating - Complexing Agent:
- EDTA - Synthetic Chelates
- Amino Acid Complexes
- Organic Acid Complexes
- Lignosulfonates & Others
Fulvic Mineral Complexes Market segmented by Nutrient:
- Iron
- Zinc
- Manganese & Copper
- Boron - Moly & Multi-Nutrient
- Others
Fulvic Mineral Complexes Market segmented by Crop Type:
- Cereals & Grains
- Fruits & Vegetables
- Oilseeds & Pulses
- Turf & Ornamentals
- Others
Fulvic Mineral Complexes Market segmented by Application Method:
- Fertigation
- Foliar
- Soil
- Others
Fulvic Mineral Complexes Market segmented by Sales Channel:
- Agri-Input Distributors
- Cooperatives
- Agri-Retail Chains
- Online - Direct-to-Farm
- Others
Fulvic Mineral Complexes Market by Region:
- North America
- United States
- Canada
- Latin America
- Brazil
- Mexico
- Chile
- Rest of Latin America
- Western Europe
- Germany
- United Kingdom
- Italy
- Spain
- France
- Nordics
- Benelux
- Rest of Western Europe
- Eastern Europe
- Russia
- Poland
- Hungary
- Balkan and Baltic States
- Rest of Eastern Europe
- East Asia
- China
- Japan
- South Korea
- South Asia and Pacific
- India
- ASEAN
- Australia and New Zealand
- Rest of South Asia and Pacific
- Middle East and Africa
- Kingdom of Saudi Arabia
- Other GCC Countries
- Türkiye
- South Africa
- Other African Union Countries
- Rest of Middle East and Africa
Research Sources and Bibliography
- USA Department of Agriculture, Economic Research Service. (2025, November 13). Fertilizers & Pesticides.
- Department for Environment, Food & Rural Affairs. (2026, June 11). Nutrient management.
- Nouryon. (2025, October). Celebrating World Fertilizer Day with Innovation: HBED, the world’s strongest iron chelate.
- BASF. (2025, October 2). BASF launches first rice yield guarantee via xarvio® HEALTHY FIELDS with AI-powered “Humus” soil improvement service.
- USA Department of Agriculture, National Agricultural Statistics Service. (2025, June 30). Corn planted acreage up 5% from 2024, soybean acreage down 4% from last year.
- ICL Growing Solutions. (2026, March 19). ICL Group Opens Specialty Fertilizer Manufacturing Facility in India.
- Haifa Group. (2025, January 23). Haifa Group Launches its 18th International Subsidiary in India.
- Agriculture and Horticulture Development Board. (2026, March 27). Order your copy of RB209 2026.
- Statistisches Bundesamt. (2026, June 11). Einkaufspreise landwirtschaftlicher Betriebsmittel April 2026: +1,9 % gegenüber April 2025.
- Nouryon. (2026, May 7). Nouryon publishes 2025 sustainability report highlighting further innovation, responsible operations and stakeholder engagement progress.
- Statistisches Bundesamt. (2026, May 19). Getreideanbaufläche 2026 hat sich nach Tiefststand von 2024 weiter stabilisiert.
- USA Department of Agriculture, National Agricultural Statistics Service. (2026, June 30). Corn planted acreage down 3% from 2025, soybean acreage up 5% from last year.
- Ministry of Data and Statistics, Republic of Korea. (2025, June 27). Preliminary Results of the Cultivated Area of Barley, Wheat, Spring Potatoes, Apples and Pears in 2025.
- Department for Environment, Food & Rural Affairs. (2026, February 4). Farmer productivity boost with new nutrient planning tool.
- Ministry of Agriculture, Forestry and Fisheries, Japan. (2025, November 28).
- ICL Growing Solutions. (2026, April 12). ICL launches Bioz Kellus.
- COMPO EXPERT. (2025, April 2). Introducing the Basfoliar® Premium SL Line: Powered by Leaf Care Technology.
- Yara International. (2026, March 23). Yara expands research capabilities in biological crop solutions.
- Syngenta. (2026, March 17). Syngenta builds world-leading research center for agricultural bioscience - powered by advanced technology and AI.
- Van Iperen International. (2025, October 10). IPE® Technology is Now CE Biostimulant Certified.
- Syngenta. (2025, February 26). Syngenta strengthens global leadership in agricultural biologicals.
- BASF. (2026, February 4). BASF and Yuntianhua extend Limus® partnership through 2030.
- ICL Growing Solutions. (2026, January 26). ICL Unveils NutroScan for Real-Time Diagnostics.
- Yara International. (2025, May 12). PepsiCo-Yara partnership expands to Latin America.
- ICL Growing Solutions. (2026, April 23). ICL and ofi Partner for Sustainable Coffee Farming.
- ICL Growing Solutions. (2025, August 5). ICL’s eqo.x Wins Gold Globee for Sustainable Agriculture Innovation.
- Haifa Group. (2025, February 2). Haifa Group Expands in Brazil: New Multicote™ Blending Facility Opens in Uberlândia.
- BASF. (2025, March 4). BASF launches xarvio® FIELD MANAGER For Fruits & Veggies.
This bibliography is provided for reader reference and is not exhaustive. The full report contains the complete reference list and detailed citations.
This Report Answers
- How large is the fulvic mineral complexes market in 2026 and what value is forecast by 2036?
- Which crop-nutrition conditions make complexing chemistry commercially useful instead of optional?
- Why do EDTA - synthetic chelates hold the leading position in the chelating - complexing agent category?
- Why does iron account for the largest approved nutrient share in 2026?
- How do cereals & grains convert micronutrient correction into scheduled field applications?
- Why do fertigation and agri-input distributors hold leading positions in their respective categories?
- How do the five approved country CAGRs change technical-service and qualification priorities?
- Which companies compete through chelate chemistry, integrated crop nutrition and specialty formulation?
Frequently Asked Questions
How big is the fulvic mineral complexes market in 2026?
The fulvic mineral complexes market is valued at USD 293.6 million in 2026 and is projected to reach USD 676.2 million by 2036. Growth depends on diagnosed micronutrient need and complexing chemistry that keeps trace minerals available under restrictive soil conditions.
What is the CAGR of the fulvic mineral complexes market from 2026 to 2036?
The fulvic mineral complexes market is projected to grow at a CAGR of 8.7% between 2026 and 2036. Expansion depends on soil diagnosis, nutrient-use efficiency and formulations that stay soluble at the intended pH and application route.
Which chelating - complexing agent leads the fulvic mineral complexes market?
The EDTA - synthetic chelates segment is expected to hold 43.8% of the fulvic mineral complexes market in 2026, attributable to familiar ligand specifications and formulation practice. Competing chemistries must match that stability during product qualification.
Which application method leads the fulvic mineral complexes market?
The fertigation segment is expected to hold 47.0% of the fulvic mineral complexes market in 2026, supported by dosing soluble complexes through irrigation equipment. Commercial use depends on dissolution and water compatibility before repeat application.
Which countries are projected to record the highest growth in the fulvic mineral complexes market?
Germany is projected to grow at 8.2% CAGR, followed by USA at 7.9% and South Korea at 7.6% through 2036. Each market converts specialty nutrition into repeat orders through a different mix of agronomy, documentation and local technical support.
Which companies are active in the fulvic mineral complexes market?
Key companies operating in the market include BASF, Nouryon, Yara International, ICL Group, Haifa Group, Valagro (Syngenta Biologicals), Compo Expert, and Van Iperen International. Their positions differ through chelate chemistry, crop-nutrition integration, diagnostics, application support and regional distribution.
Preview the report firsthand - request a free sample
Get SampleGet the brochure for pricing and purchase details.
Get PDFTable of Content
- Key Takeaways
- Market Size and CAGR
- Top Growth Driver
- Fastest Growing Segment
- Leading Region
- Key Companies
- Emerging Opportunities
- Executive Summary
- Global Market Outlook
- Demand-side Trends
- Supply-side Trends
- Technology Roadmap Analysis
- Analysis and Recommendations
- Analyst Perspective (What is happening? Why now? What should investors know?)
- Key Questions Answered
- How large is the market?
- What is the CAGR?
- What are key trends?
- Which region dominates?
- Who are the leaders?
- Market Overview
- Market Coverage / Taxonomy
- Market Definition / Scope / Limitations
- Research Methodology
- Chapter Orientation
- Analytical Lens and Working Hypotheses
- Market Structure, Signals, and Trend Drivers
- Benchmarking and Cross-market Comparability
- Market Sizing, Forecasting, and Opportunity Mapping
- Research Design and Evidence Framework
- Desk Research Programme (Secondary Evidence)
- Expert Input and Fieldwork (Primary Evidence)
- Tooling, Models, and Reference Databases
- Data Engineering and Model Build
- Quality Assurance and Audit Trail
- Market Background
- Market Dynamics (Drivers, Restraints, Opportunity, Trends)
- Scenario Forecast (Optimistic, Likely, Conservative)
- Impact Analysis
- AI Impact
- Sustainability Impact
- Regulatory Impact
- Technology Impact
- Consumer / Buyer Analysis
- Purchase Drivers
- Adoption Barriers
- Buyer Journey
- Opportunity Map Analysis
- Product Life Cycle Analysis
- Supply Chain Analysis
- Investment Feasibility Matrix
- Value Chain Analysis
- PESTLE and Porter's Analysis
- Regulatory Landscape
- Regional Parent Market Outlook
- Production and Consumption Statistics
- Import and Export Statistics
- Global Market Analysis and Forecast, 2021 to 2036
- Historical Market Size Value (USD Million) Analysis, 2021 to 2025
- Current and Future Market Size Value (USD Million) Projections, 2026 to 2036
- Y-o-Y Growth Trend Analysis
- Absolute $ Opportunity Analysis
- Global Market Pricing Analysis, 2021 to 2036
- Global Market Analysis and Forecast, By Chelating / Complexing Agent, 2021 to 2036
- Introduction / Key Findings
- Historical Market Size Value (USD Million) Analysis By Chelating / Complexing Agent, 2021 to 2025
- Current and Future Market Size Value (USD Million) Analysis and Forecast By Chelating / Complexing Agent, 2026 to 2036
- EDTA / Synthetic Chelates
- Amino Acid Complexes
- Organic Acid Complexes
- Lignosulfonates & Others
- EDTA / Synthetic Chelates
- Y-o-Y Growth Trend Analysis By Chelating / Complexing Agent, 2021 to 2025
- Absolute $ Opportunity Analysis By Chelating / Complexing Agent, 2026 to 2036
- Global Market Analysis and Forecast, By Nutrient, 2021 to 2036
- Introduction / Key Findings
- Historical Market Size Value (USD Million) Analysis By Nutrient, 2021 to 2025
- Current and Future Market Size Value (USD Million) Analysis and Forecast By Nutrient, 2026 to 2036
- Iron
- Zinc
- Manganese & Copper
- Boron / Moly & Multi-Nutrient
- Others
- Iron
- Y-o-Y Growth Trend Analysis By Nutrient, 2021 to 2025
- Absolute $ Opportunity Analysis By Nutrient, 2026 to 2036
- Global Market Analysis and Forecast, By Crop Type, 2021 to 2036
- Introduction / Key Findings
- Historical Market Size Value (USD Million) Analysis By Crop Type, 2021 to 2025
- Current and Future Market Size Value (USD Million) Analysis and Forecast By Crop Type, 2026 to 2036
- Cereals & Grains
- Fruits & Vegetables
- Oilseeds & Pulses
- Turf & Ornamentals
- Others
- Cereals & Grains
- Y-o-Y Growth Trend Analysis By Crop Type, 2021 to 2025
- Absolute $ Opportunity Analysis By Crop Type, 2026 to 2036
- Global Market Analysis and Forecast, By Application Method, 2021 to 2036
- Introduction / Key Findings
- Historical Market Size Value (USD Million) Analysis By Application Method, 2021 to 2025
- Current and Future Market Size Value (USD Million) Analysis and Forecast By Application Method, 2026 to 2036
- Fertigation
- Foliar
- Soil
- Others
- Fertigation
- Y-o-Y Growth Trend Analysis By Application Method, 2021 to 2025
- Absolute $ Opportunity Analysis By Application Method, 2026 to 2036
- Global Market Analysis and Forecast, By Sales Channel, 2021 to 2036
- Introduction / Key Findings
- Historical Market Size Value (USD Million) Analysis By Sales Channel, 2021 to 2025
- Current and Future Market Size Value (USD Million) Analysis and Forecast By Sales Channel, 2026 to 2036
- Agri-Input Distributors
- Cooperatives
- Agri-Retail Chains
- Online / Direct-to-Farm
- Others
- Agri-Input Distributors
- Y-o-Y Growth Trend Analysis By Sales Channel, 2021 to 2025
- Absolute $ Opportunity Analysis By Sales Channel, 2026 to 2036
- Global Market Analysis and Forecast, By Region, 2021 to 2036
- Introduction
- Historical Market Size Value (USD Million) Analysis By Region, 2021 to 2025
- Current Market Size Value (USD Million) Analysis and Forecast By Region, 2026 to 2036
- North America
- Latin America
- Western Europe
- Eastern Europe
- East Asia
- South Asia and Pacific
- Middle East & Africa
- Market Attractiveness Analysis By Region
- North America Market Analysis and Forecast, By Country, 2021 to 2036
- Historical Market Size Value (USD Million) Trend Analysis By Market Taxonomy, 2021 to 2025
- Market Size Value (USD Million) Forecast By Market Taxonomy, 2026 to 2036
- By Country
- USA
- Canada
- By Chelating / Complexing Agent
- By Nutrient
- By Crop Type
- By Application Method
- By Sales Channel
- By Country
- Market Attractiveness Analysis
- By Country
- By Chelating / Complexing Agent
- By Nutrient
- By Crop Type
- By Application Method
- By Sales Channel
- Key Takeaways
- Latin America Market Analysis and Forecast, By Country
- Historical Market Size Value (USD Million) Trend Analysis By Market Taxonomy, 2021 to 2025
- Market Size Value (USD Million) Forecast By Market Taxonomy, 2026 to 2036
- By Country
- Brazil
- Mexico
- Chile
- Rest of Latin America
- By Chelating / Complexing Agent
- By Nutrient
- By Crop Type
- By Application Method
- By Sales Channel
- By Country
- Market Attractiveness Analysis
- By Country
- By Chelating / Complexing Agent
- By Nutrient
- By Crop Type
- By Application Method
- By Sales Channel
- Key Takeaways
- Western Europe Market Analysis and Forecast, By Country
- Historical Market Size Value (USD Million) Trend Analysis By Market Taxonomy, 2021 to 2025
- Market Size Value (USD Million) Forecast By Market Taxonomy, 2026 to 2036
- By Country
- Germany
- UK
- Italy
- Spain
- France
- Nordic
- BENELUX
- Rest of Western Europe
- By Chelating / Complexing Agent
- By Nutrient
- By Crop Type
- By Application Method
- By Sales Channel
- By Country
- Market Attractiveness Analysis
- By Country
- By Chelating / Complexing Agent
- By Nutrient
- By Crop Type
- By Application Method
- By Sales Channel
- Key Takeaways
- Eastern Europe Market Analysis and Forecast, By Country
- Historical Market Size Value (USD Million) Trend Analysis By Market Taxonomy, 2021 to 2025
- Market Size Value (USD Million) Forecast By Market Taxonomy, 2026 to 2036
- By Country
- Russia
- Poland
- Hungary
- Balkan & Baltic
- Rest of Eastern Europe
- By Chelating / Complexing Agent
- By Nutrient
- By Crop Type
- By Application Method
- By Sales Channel
- By Country
- Market Attractiveness Analysis
- By Country
- By Chelating / Complexing Agent
- By Nutrient
- By Crop Type
- By Application Method
- By Sales Channel
- Key Takeaways
- East Asia Market Analysis and Forecast, By Country
- Historical Market Size Value (USD Million) Trend Analysis By Market Taxonomy, 2021 to 2025
- Market Size Value (USD Million) Forecast By Market Taxonomy, 2026 to 2036
- By Country
- China
- Japan
- South Korea
- By Chelating / Complexing Agent
- By Nutrient
- By Crop Type
- By Application Method
- By Sales Channel
- By Country
- Market Attractiveness Analysis
- By Country
- By Chelating / Complexing Agent
- By Nutrient
- By Crop Type
- By Application Method
- By Sales Channel
- Key Takeaways
- South Asia and Pacific Market Analysis and Forecast, By Country
- Historical Market Size Value (USD Million) Trend Analysis By Market Taxonomy, 2021 to 2025
- Market Size Value (USD Million) Forecast By Market Taxonomy, 2026 to 2036
- By Country
- India
- ASEAN
- Australia & New Zealand
- Rest of South Asia and Pacific
- By Chelating / Complexing Agent
- By Nutrient
- By Crop Type
- By Application Method
- By Sales Channel
- By Country
- Market Attractiveness Analysis
- By Country
- By Chelating / Complexing Agent
- By Nutrient
- By Crop Type
- By Application Method
- By Sales Channel
- Key Takeaways
- Middle East & Africa Market Analysis and Forecast, By Country
- Historical Market Size Value (USD Million) Trend Analysis By Market Taxonomy, 2021 to 2025
- Market Size Value (USD Million) Forecast By Market Taxonomy, 2026 to 2036
- By Country
- Kingdom of Saudi Arabia
- Other GCC Countries
- Türkiye
- South Africa
- Other African Union
- Rest of Middle East & Africa
- By Chelating / Complexing Agent
- By Nutrient
- By Crop Type
- By Application Method
- By Sales Channel
- By Country
- Market Attractiveness Analysis
- By Country
- By Chelating / Complexing Agent
- By Nutrient
- By Crop Type
- By Application Method
- By Sales Channel
- Key Takeaways
- Key Countries Market Analysis
- USA
- Pricing Analysis
- Market Share Analysis, 2025
- By Chelating / Complexing Agent
- By Nutrient
- By Crop Type
- By Application Method
- By Sales Channel
- Canada
- Pricing Analysis
- Market Share Analysis, 2025
- By Chelating / Complexing Agent
- By Nutrient
- By Crop Type
- By Application Method
- By Sales Channel
- Mexico
- Pricing Analysis
- Market Share Analysis, 2025
- By Chelating / Complexing Agent
- By Nutrient
- By Crop Type
- By Application Method
- By Sales Channel
- Brazil
- Pricing Analysis
- Market Share Analysis, 2025
- By Chelating / Complexing Agent
- By Nutrient
- By Crop Type
- By Application Method
- By Sales Channel
- Chile
- Pricing Analysis
- Market Share Analysis, 2025
- By Chelating / Complexing Agent
- By Nutrient
- By Crop Type
- By Application Method
- By Sales Channel
- Germany
- Pricing Analysis
- Market Share Analysis, 2025
- By Chelating / Complexing Agent
- By Nutrient
- By Crop Type
- By Application Method
- By Sales Channel
- UK
- Pricing Analysis
- Market Share Analysis, 2025
- By Chelating / Complexing Agent
- By Nutrient
- By Crop Type
- By Application Method
- By Sales Channel
- Italy
- Pricing Analysis
- Market Share Analysis, 2025
- By Chelating / Complexing Agent
- By Nutrient
- By Crop Type
- By Application Method
- By Sales Channel
- Spain
- Pricing Analysis
- Market Share Analysis, 2025
- By Chelating / Complexing Agent
- By Nutrient
- By Crop Type
- By Application Method
- By Sales Channel
- France
- Pricing Analysis
- Market Share Analysis, 2025
- By Chelating / Complexing Agent
- By Nutrient
- By Crop Type
- By Application Method
- By Sales Channel
- India
- Pricing Analysis
- Market Share Analysis, 2025
- By Chelating / Complexing Agent
- By Nutrient
- By Crop Type
- By Application Method
- By Sales Channel
- ASEAN
- Pricing Analysis
- Market Share Analysis, 2025
- By Chelating / Complexing Agent
- By Nutrient
- By Crop Type
- By Application Method
- By Sales Channel
- Australia & New Zealand
- Pricing Analysis
- Market Share Analysis, 2025
- By Chelating / Complexing Agent
- By Nutrient
- By Crop Type
- By Application Method
- By Sales Channel
- China
- Pricing Analysis
- Market Share Analysis, 2025
- By Chelating / Complexing Agent
- By Nutrient
- By Crop Type
- By Application Method
- By Sales Channel
- Japan
- Pricing Analysis
- Market Share Analysis, 2025
- By Chelating / Complexing Agent
- By Nutrient
- By Crop Type
- By Application Method
- By Sales Channel
- South Korea
- Pricing Analysis
- Market Share Analysis, 2025
- By Chelating / Complexing Agent
- By Nutrient
- By Crop Type
- By Application Method
- By Sales Channel
- Russia
- Pricing Analysis
- Market Share Analysis, 2025
- By Chelating / Complexing Agent
- By Nutrient
- By Crop Type
- By Application Method
- By Sales Channel
- Poland
- Pricing Analysis
- Market Share Analysis, 2025
- By Chelating / Complexing Agent
- By Nutrient
- By Crop Type
- By Application Method
- By Sales Channel
- Hungary
- Pricing Analysis
- Market Share Analysis, 2025
- By Chelating / Complexing Agent
- By Nutrient
- By Crop Type
- By Application Method
- By Sales Channel
- Kingdom of Saudi Arabia
- Pricing Analysis
- Market Share Analysis, 2025
- By Chelating / Complexing Agent
- By Nutrient
- By Crop Type
- By Application Method
- By Sales Channel
- Türkiye
- Pricing Analysis
- Market Share Analysis, 2025
- By Chelating / Complexing Agent
- By Nutrient
- By Crop Type
- By Application Method
- By Sales Channel
- South Africa
- Pricing Analysis
- Market Share Analysis, 2025
- By Chelating / Complexing Agent
- By Nutrient
- By Crop Type
- By Application Method
- By Sales Channel
- USA
- Market Structure Analysis
- Competition Dashboard
- Competition Benchmarking
- Market Share Analysis of Top Players
- By Regional
- By Chelating / Complexing Agent
- By Nutrient
- By Crop Type
- By Application Method
- By Sales Channel
- Emerging Startups
- Innovation Benchmarking
- Competition Analysis
- Competition Deep Dive
- BASF
- Overview
- Product Portfolio
- Profitability by Market Segments
- Sales Footprint
- Strategy Overview
- Marketing Strategy
- Product Strategy
- Channel Strategy
- Nouryon
- Yara International
- ICL Group
- Haifa Group
- Valagro (Syngenta Biologicals)
- Compo Expert
- Van Iperen International
- BASF
- Case Studies
- Success Stories
- Recent Developments
- Competition Deep Dive
- Assumptions & Acronyms Used


