Reports

- Global Locations -

Headquarters

Future Market Insights, Inc.

Christiana Corporate, 200
Continental Drive, Suite 401,
Newark, Delaware - 19713,
United States

T: +1-845-579-5705

Americas

Future Market Insights, Inc.

616 Corporate Way, Suite 2-9018,
Valley Cottage, NY 10989, United States

T: +1-347-918-3531

MEA

Future Market Insights

1602-6 Jumeirah Bay X2 Tower, Plot No: JLT-PH2-X2A,
Jumeirah Lakes Towers, Dubai,
United Arab Emirates

Europe

Future Market Insights

3rd Floor, 207 Regent Street,
W1B 3HH London
United Kingdom

T: + 44 (0) 20 8123 9659
D: +44 (0) 20 3287 4268

Asia Pacific

Future Market Insights

IndiaLand Global Tech Park, Unit UG-1, Behind Grand HighStreet, Phase 1, Hinjawadi, MH, Pune – 411057, India

Head Band Ophthalmoscopes Market Outlook (2022 to 2032)

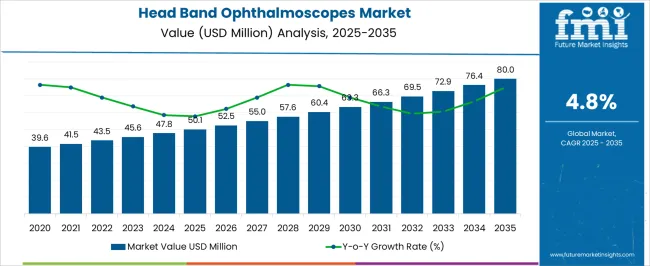
The global headband ophthalmoscopes market possesses a market value of US$ 43.5 million in 2022 and is anticipated to grow at a CAGR of 4.8% during the forecast period (2022 to 2032) to reach US$ 72.9 million. Earlier, a CAGR of 4.2% was observed in the headband ophthalmoscope market from 2017 to 2021.

Report Attribute Details
Head Band Ophthalmoscopes Market Historical Growth Rate (2017 to 2021) 4.2%
Head Band Ophthalmoscopes Market Value (2022) US$ 43.5 million
Head Band Ophthalmoscopes Market Anticipated Forecast Value (2032) US$ 72.9 million
Head Band Ophthalmoscopes Market Projected Growth Rate (2022 to 2032) 4.8%

Optometrists deploy headband ophthalmoscopes as medical devices to constrict both the entry and exit pupils. Headband ophthalmoscopes are useful because they enable the physician to walk around the patient and offer a field of vision that is approximately 40 degrees in total, illumination, and scleral indentation.

Headband ophthalmoscopes are based on indirect technology, which creates an inverted and direct picture that is amplified by two to five times. The portable lens on headband ophthalmoscopes gives a wide view of the eye for a routine inspection. Furthermore, headband ophthalmoscopes are mostly used to observe the peripheral retinal area. The majority of the time, headband ophthalmoscopes are used to check for changes in the color of the fundus of the eye that may be brought on by tumors or cancer. Headband ophthalmoscopes are employed in co-management programs for assessments following postoperative detachment procedures as well as for the diagnosis of peripheral lesions that could be predisposed.

Don't pay for what you don't need

Customize your report by selecting specific countries or regions and save 30%!

The Head Band Ophthalmoscopes Market is Expanding due to the Rising Occurrence of Eye-related Disorders.

The prevalence of eye-related conditions such as age-related macular degeneration, cataracts, refractive error, and diabetic retinopathy is a major factor in the growth of the global headband ophthalmoscope market. In the United States alone, 7.7 million people have diabetic retinopathy, and 24 million people have cataracts, according to estimates from the National Eye Institute. By the end of 2030, it is predicted that nearly 11.3 million people will have diabetic retinopathy and 38.7 million people will be affected by cataracts. In addition, the development of the worldwide headband ophthalmoscopes market is also fueled by other factors including technological development and improved healthcare infrastructure.

Since its inception for the purpose of producing a novelty product on the market, a steady improvement in technology has been observed. The market for headband ophthalmoscopes will develop due to the increase in eye-related ailments on the rise, along with greater penetration of IT. The expansion of the global market for headband ophthalmoscopes is also being fueled by other factors including technological development and improved healthcare infrastructure.

High Research and Development Cost of Head Band Ophthalmoscopes is Restraining the Market from Spreading out

The expansion of the market is expected to be constrained by generic competition and severe requirements for product approval. Other significant market limitations are the high costs of research and development associated with the manufacture and development of headband ophthalmoscopes. In addition, there are several factors that are impeding the market expansion of headband ophthalmoscopes, including their usability complexity and a lack of qualified professionals.

Sabyasachi Ghosh
Sabyasachi Ghosh

Principal Consultant

Talk to Analyst

Find your sweet spots for generating winning opportunities in this market.

Laser Indirect Head Band Ophthalmoscopes are in Trend & Provide Market Opportunities to the Manufacturers

The most effective and practical variation of the conventional ophthalmoscope is the binocular indirect headband ophthalmoscope (laser indirect ophthalmoscope). To improve demand in the worldwide market, manufacturers are adding lasers to headband ophthalmoscopes.

Eye-Related Disorders are becoming Extremely Common Scenario in North America Expanding the Headband Ophthalmoscopes Market

The market for headband ophthalmoscopes is dominated by North America because of the rising incidence of eye-related ailments and the presence of highly competent physicians. The market for headband ophthalmoscopes is also expanding due to additional factors including the availability of high-tech healthcare facilities and a suitable reimbursement environment. Due to the aforementioned factors, North America is anticipated to have a 34.1% market share for headband ophthalmoscopes in 2022.

Get the data you need at a Fraction of the cost

Personalize your report by choosing insights you need
and save 40%!

The Head Band Ophthalmoscopes Market is Emerging in Europe Owing to Growing Research and Development Activities

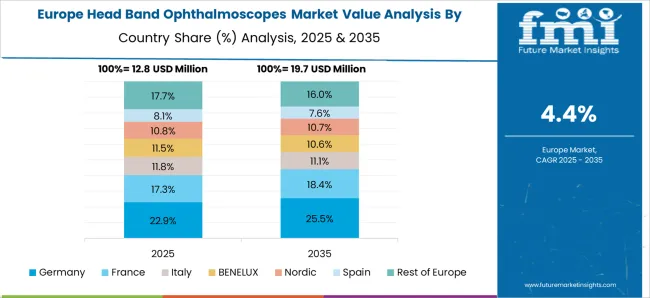
Owing to the increasing research and development initiatives, Europe is now the second-largest market for headband ophthalmoscopes. Furthermore, a number of important businesses are concentrating on bolstering their position in Europe through acquisitions, expansions, product launches, and approvals. As investment prospects for industry participants active in the headband ophthalmoscopes market increase, the demand for headband ophthalmoscopes in Europe is anticipated to rise. As a result, in 2022, Europe is anticipated to have a 27.6% market share for headband ophthalmoscopes.

Fresh Invention to Drive Demand for Head Band Ophthalmoscopes in Asia Pacific

Asia Pacific is predicted to account for a significant portion of the global headband ophthalmoscopes market due to its enormous population and rising governmental and private investment in research and development. As a result, it is anticipated that Asia Pacific will account for 25% of the market for headband ophthalmoscopes in 2022.

To Transform the Head Band Ophthalmoscopes Industry, Startups are Adding New Technologies to the Current Offerings.

As a result of the extremely competitive environment, several new firms are entering the market with unique technologies.

Example:

  • In May 2021, EarlySight, which employs a cutting-edge method to offer single-cell level imaging of the retina in the back of the eye, announced the first closure of around €2 million in its about €2.7 million seed funding round. Its technology combines hardware and software to offer a novel medical device that can spot the affected cells in the earliest stages of the most common retinal diseases, including age-related macular degeneration, glaucoma, and diabetic retinopathy, in order to treat them more quickly and effectively.
  • In February 2020, C. Light Technologies announced its plans to use artificial intelligence and machine learning methods to assess changes in eye movement as subtle as one-hundredth the size of a human hair with the aid of a new tracking scanning laser ophthalmoscope device. The startup hoped to use the patterns it uncovers as a novel method of screening people for illnesses including amyotrophic lateral sclerosis, Alzheimer's, or Parkinson's as well as perhaps even diagnosing concussions. This firm aims to provide fresh insights into someone's neurological health by detecting the minute movements of the human eye and monitoring the retina's movements at the cellular level.

Major Market Players are Employing Unique Business Strategies to Stay Ahead of New Entrants

Businesses involved in the Head Band Ophthalmoscopes industry are now more engaged with launching strategies like targeted marketing, CSR initiatives, etc along with new inventions as a way to increase their global prominence. The fact that these businesses are now aiming to handle a certain business-related activity in a nation that offers advantageous legislation is a clearly discernible trend that is being noted across the board.

Example:

  • In May 2021, the OMEGA 600, the newest indirect ophthalmoscope from HEINE, was introduced. The OMEGA 600 stands out in its category because of a number of advances, including a completely redesigned design that makes it the lightest high-end watch on the market thanks to a new lightweight battery. The OMEGA 600 is therefore perfect for both the patient and the clinician. HEINE provides a five-year warranty on the calibre of its components, labor, and design.
  • In April 2021, the new VisionBOOST technology from HEINE has been introduced, and it considerably enhances retina examinations for cataract patients and has a clever surface design for simple cleaning and sanitization. This innovative feature, which can be progressively adjusted, improves retinal vision by up to 20% while also making the examination's light intensity more bearable for both the patient and the doctor.

Key Players

  • US Ophthalmic
  • Heine USA Ltd.
  • Iridex Corporation
  • Alltion (Wuzhou) Co., Ltd.
  • Keeler Ltd.
  • Propper Manufacturing
  • Welch Allyn
  • Oak Tree Group

Report Scope

Report Attribute Details
Growth Rate CAGR of 4.8% from 2022 to 2032
Base Year for Estimation 2021
Historical Data 2017 to 2021
Forecast Period 2022 to 2032
Quantitative Units Revenue in USD Billion, Volume in Kilotons, and CAGR from 2022 to 2032
Report Coverage Revenue Forecast, Volume Forecast, Company Ranking, Competitive Landscape, Growth Factors, Trends, and Pricing Analysis
Segments Covered
  • Product Type
  • End-use
  • Region
Regions Covered
  • North America
  • Latin America
  • The Asia Pacific
  • Middle East and Africa
  • Europe
Key Countries Profiled
  • United States of America
  • Canada
  • Brazil
  • Argentina
  • Germany
  • United Kingdom
  • France
  • Spain
  • Italy
  • Nordics
  • BENELUX
  • Australia & New Zealand
  • China
  • India
  • ASEAN
  • GCC Countries
  • South Africa
Key Companies Profiled
  • US Ophthalmic
  • Heine USA Ltd.
  • Iridex Corporation
  • Alltion (Wuzhou) Co., Ltd.
  • Keeler Ltd.
  • Propper Manufacturing
  • Welch Allyn
  • Oak Tree Group
Customization Available Upon Request

Head Band Ophthalmoscopes: Market Segmentation

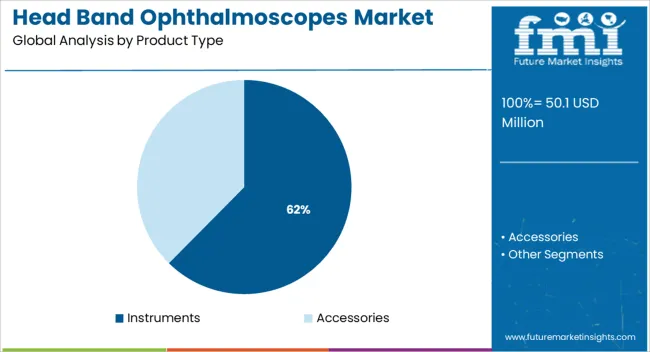
Head Band Ophthalmoscopes Market by Product Type:

  • Head Band Ophthalmoscope Instruments
  • Head Band Ophthalmoscope Accessories

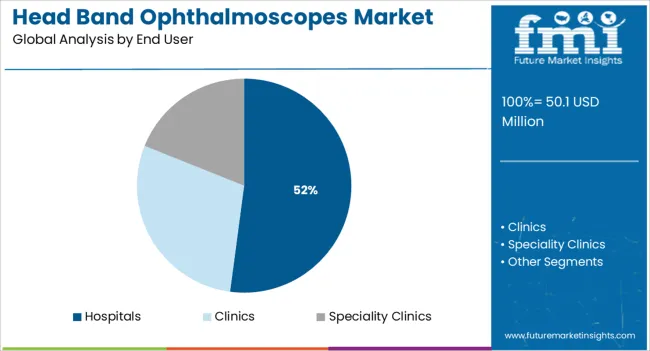
Head Band Ophthalmoscopes Market by End Use:

  • Head Band Ophthalmoscopes for Hospitals
  • Head Band Ophthalmoscopes for Clinics
  • Head Band Ophthalmoscopes for Specialty Clinics

Head Band Ophthalmoscopes Market by Region:

  • North America Head Band Ophthalmoscopes Market
  • Latin America Head Band Ophthalmoscopes Market
  • Europe Head Band Ophthalmoscopes Market
  • Asia Pacific Head Band Ophthalmoscopes Market
  • Middle East & Africa Head Band Ophthalmoscopes Market

Frequently Asked Questions

What is the Growth Outlook for the Head Band Ophthalmoscopes Market?

The global headband ophthalmoscopes market is expected to progress at a CAGR of 4.8% (2022 to 2032).

Which Region is Anticipated to Embrace the Maximum Share in the Global Head Band Ophthalmoscopes Market?

North America is expected to hold the highest share in the head band ophthalmoscopes market with 34.1% market share.

What is the Future of the Head Band Ophthalmoscopes Market?

Global head band ophthalmoscopes market is predicted to account for US$ 72.9 million by 2032.

Table of Content

1. Executive Summary | Head Band Ophthalmoscopes Market

    1.1. Global Market Outlook

    1.2. Demand-side Trends

    1.3. Supply-side Trends

    1.4. Technology Roadmap Analysis

    1.5. Analysis and Recommendations

2. Market Overview

    2.1. Market Coverage / Taxonomy

    2.2. Market Definition / Scope / Limitations

3. Market Background

    3.1. Market Dynamics

        3.1.1. Drivers

        3.1.2. Restraints

        3.1.3. Opportunity

        3.1.4. Trends

    3.2. Scenario Forecast

        3.2.1. Demand in Optimistic Scenario

        3.2.2. Demand in Likely Scenario

        3.2.3. Demand in Conservative Scenario

    3.3. Opportunity Map Analysis

    3.4. Investment Feasibility Matrix

    3.5. PESTLE and Porter’s Analysis

    3.6. Regulatory Landscape

        3.6.1. By Key Regions

        3.6.2. By Key Countries

    3.7. Regional Parent Market Outlook

4. Global Market Analysis 2016 to 2021 and Forecast, 2022 to 2032

    4.1. Historical Market Size Value (US$ Million) Analysis, 2016 to 2021

    4.2. Current and Future Market Size Value (US$ Million) Projections, 2022 to 2032

        4.2.1. Y-o-Y Growth Trend Analysis

        4.2.2. Absolute $ Opportunity Analysis

5. Global Market Analysis 2016 to 2021 and Forecast 2022 to 2032, By Product Type

    5.1. Introduction / Key Findings

    5.2. Historical Market Size Value (US$ Million) Analysis By Product Type, 2016 to 2021

    5.3. Current and Future Market Size Value (US$ Million) Analysis and Forecast By Product Type, 2022 to 2032

        5.3.1. Instruments

        5.3.2. Accessories

    5.4. Y-o-Y Growth Trend Analysis By Product Type, 2016 to 2021

    5.5. Absolute $ Opportunity Analysis By Product Type, 2022 to 2032

6. Global Market Analysis 2016 to 2021 and Forecast 2022 to 2032, By End User

    6.1. Introduction / Key Findings

    6.2. Historical Market Size Value (US$ Million) Analysis By End User, 2016 to 2021

    6.3. Current and Future Market Size Value (US$ Million) Analysis and Forecast By End User, 2022 to 2032

        6.3.1. Hospitals

        6.3.2. Clinics

        6.3.3. Speciality Clinics

    6.4. Y-o-Y Growth Trend Analysis By End User, 2016 to 2021

    6.5. Absolute $ Opportunity Analysis By End User, 2022 to 2032

7. Global Market Analysis 2016 to 2021 and Forecast 2022 to 2032, By Region

    7.1. Introduction

    7.2. Historical Market Size Value (US$ Million) Analysis By Region, 2016 to 2021

    7.3. Current Market Size Value (US$ Million) Analysis and Forecast By Region, 2022 to 2032

        7.3.1. North America

        7.3.2. Latin America

        7.3.3. Europe

        7.3.4. Asia Pacific

        7.3.5. Middle East and Africa

    7.4. Market Attractiveness Analysis By Region

8. North America Market Analysis 2016 to 2021 and Forecast 2022 to 2032, By Country

    8.1. Historical Market Size Value (US$ Million) Trend Analysis By Market Taxonomy, 2016 to 2021

    8.2. Market Size Value (US$ Million) Forecast By Market Taxonomy, 2022 to 2032

        8.2.1. By Country

            8.2.1.1. United States of America

            8.2.1.2. Canada

        8.2.2. By Product Type

        8.2.3. By End User

    8.3. Market Attractiveness Analysis

        8.3.1. By Country

        8.3.2. By Product Type

        8.3.3. By End User

    8.4. Key Takeaways

9. Latin America Market Analysis 2016 to 2021 and Forecast 2022 to 2032, By Country

    9.1. Historical Market Size Value (US$ Million) Trend Analysis By Market Taxonomy, 2016 to 2021

    9.2. Market Size Value (US$ Million) Forecast By Market Taxonomy, 2022 to 2032

        9.2.1. By Country

            9.2.1.1. Brazil

            9.2.1.2. Mexico

            9.2.1.3. Rest of Latin America

        9.2.2. By Product Type

        9.2.3. By End User

    9.3. Market Attractiveness Analysis

        9.3.1. By Country

        9.3.2. By Product Type

        9.3.3. By End User

    9.4. Key Takeaways

10. Europe Market Analysis 2016 to 2021 and Forecast 2022 to 2032, By Country

    10.1. Historical Market Size Value (US$ Million) Trend Analysis By Market Taxonomy, 2016 to 2021

    10.2. Market Size Value (US$ Million) Forecast By Market Taxonomy, 2022 to 2032

        10.2.1. By Country

            10.2.1.1. Germany

            10.2.1.2. United Kingdom

            10.2.1.3. France

            10.2.1.4. Spain

            10.2.1.5. Italy

            10.2.1.6. Rest of Europe

        10.2.2. By Product Type

        10.2.3. By End User

    10.3. Market Attractiveness Analysis

        10.3.1. By Country

        10.3.2. By Product Type

        10.3.3. By End User

    10.4. Key Takeaways

11. Asia Pacific Market Analysis 2016 to 2021 and Forecast 2022 to 2032, By Country

    11.1. Historical Market Size Value (US$ Million) Trend Analysis By Market Taxonomy, 2016 to 2021

    11.2. Market Size Value (US$ Million) Forecast By Market Taxonomy, 2022 to 2032

        11.2.1. By Country

            11.2.1.1. China

            11.2.1.2. Japan

            11.2.1.3. South Korea

            11.2.1.4. Malaysia

            11.2.1.5. Singapore

            11.2.1.6. Australia

            11.2.1.7. Rest of Asia Pacific

        11.2.2. By Product Type

        11.2.3. By End User

    11.3. Market Attractiveness Analysis

        11.3.1. By Country

        11.3.2. By Product Type

        11.3.3. By End User

    11.4. Key Takeaways

12. Middle East and Africa Market Analysis 2016 to 2021 and Forecast 2022 to 2032, By Country

    12.1. Historical Market Size Value (US$ Million) Trend Analysis By Market Taxonomy, 2016 to 2021

    12.2. Market Size Value (US$ Million) Forecast By Market Taxonomy, 2022 to 2032

        12.2.1. By Country

            12.2.1.1. GCC Countries

            12.2.1.2. South Africa

            12.2.1.3. Israel

            12.2.1.4. Rest of Middle East and Africa

        12.2.2. By Product Type

        12.2.3. By End User

    12.3. Market Attractiveness Analysis

        12.3.1. By Country

        12.3.2. By Product Type

        12.3.3. By End User

    12.4. Key Takeaways

13. Key Countries Market Analysis

    13.1. United Kingdom

        13.1.1. Pricing Analysis

        13.1.2. Market Share Analysis, 2021

            13.1.2.1. By Product Type

            13.1.2.2. By End User

    13.2. Canada

        13.2.1. Pricing Analysis

        13.2.2. Market Share Analysis, 2021

            13.2.2.1. By Product Type

            13.2.2.2. By End User

    13.3. Brazil

        13.3.1. Pricing Analysis

        13.3.2. Market Share Analysis, 2021

            13.3.2.1. By Product Type

            13.3.2.2. By End User

    13.4. Mexico

        13.4.1. Pricing Analysis

        13.4.2. Market Share Analysis, 2021

            13.4.2.1. By Product Type

            13.4.2.2. By End User

    13.5. Rest of Latin America

        13.5.1. Pricing Analysis

        13.5.2. Market Share Analysis, 2021

            13.5.2.1. By Product Type

            13.5.2.2. By End User

    13.6. Germany

        13.6.1. Pricing Analysis

        13.6.2. Market Share Analysis, 2021

            13.6.2.1. By Product Type

            13.6.2.2. By End User

    13.7. United Kingdom

        13.7.1. Pricing Analysis

        13.7.2. Market Share Analysis, 2021

            13.7.2.1. By Product Type

            13.7.2.2. By End User

    13.8. France

        13.8.1. Pricing Analysis

        13.8.2. Market Share Analysis, 2021

            13.8.2.1. By Product Type

            13.8.2.2. By End User

    13.9. Spain

        13.9.1. Pricing Analysis

        13.9.2. Market Share Analysis, 2021

            13.9.2.1. By Product Type

            13.9.2.2. By End User

    13.10. Italy

        13.10.1. Pricing Analysis

        13.10.2. Market Share Analysis, 2021

            13.10.2.1. By Product Type

            13.10.2.2. By End User

    13.11. Rest of Europe

        13.11.1. Pricing Analysis

        13.11.2. Market Share Analysis, 2021

            13.11.2.1. By Product Type

            13.11.2.2. By End User

    13.12. China

        13.12.1. Pricing Analysis

        13.12.2. Market Share Analysis, 2021

            13.12.2.1. By Product Type

            13.12.2.2. By End User

    13.13. Japan

        13.13.1. Pricing Analysis

        13.13.2. Market Share Analysis, 2021

            13.13.2.1. By Product Type

            13.13.2.2. By End User

    13.14. South Korea

        13.14.1. Pricing Analysis

        13.14.2. Market Share Analysis, 2021

            13.14.2.1. By Product Type

            13.14.2.2. By End User

    13.15. Malaysia

        13.15.1. Pricing Analysis

        13.15.2. Market Share Analysis, 2021

            13.15.2.1. By Product Type

            13.15.2.2. By End User

    13.16. Singapore

        13.16.1. Pricing Analysis

        13.16.2. Market Share Analysis, 2021

            13.16.2.1. By Product Type

            13.16.2.2. By End User

    13.17. Australia

        13.17.1. Pricing Analysis

        13.17.2. Market Share Analysis, 2021

            13.17.2.1. By Product Type

            13.17.2.2. By End User

    13.18. Rest of Asia Pacific

        13.18.1. Pricing Analysis

        13.18.2. Market Share Analysis, 2021

            13.18.2.1. By Product Type

            13.18.2.2. By End User

    13.19. GCC Countries

        13.19.1. Pricing Analysis

        13.19.2. Market Share Analysis, 2021

            13.19.2.1. By Product Type

            13.19.2.2. By End User

    13.20. South Africa

        13.20.1. Pricing Analysis

        13.20.2. Market Share Analysis, 2021

            13.20.2.1. By Product Type

            13.20.2.2. By End User

    13.21. Israel

        13.21.1. Pricing Analysis

        13.21.2. Market Share Analysis, 2021

            13.21.2.1. By Product Type

            13.21.2.2. By End User

    13.22. Rest of the Middle East and Africa

        13.22.1. Pricing Analysis

        13.22.2. Market Share Analysis, 2021

            13.22.2.1. By Product Type

            13.22.2.2. By End User

14. Market Structure Analysis

    14.1. Competition Dashboard

    14.2. Competition Benchmarking

    14.3. Market Share Analysis of Top Players

        14.3.1. By Regional

        14.3.2. By Product Type

        14.3.3. By End User

15. Competition Analysis

    15.1. Competition Deep Dive

        15.1.1. US Ophthalmic

            15.1.1.1. Overview

            15.1.1.2. Product Portfolio

            15.1.1.3. Profitability by Market Segments

            15.1.1.4. Sales Footprint

            15.1.1.5. Strategy Overview

                15.1.1.5.1. Marketing Strategy

        15.1.2. Heine USA Ltd.

            15.1.2.1. Overview

            15.1.2.2. Product Portfolio

            15.1.2.3. Profitability by Market Segments

            15.1.2.4. Sales Footprint

            15.1.2.5. Strategy Overview

                15.1.2.5.1. Marketing Strategy

        15.1.3. Iridex Corporation

            15.1.3.1. Overview

            15.1.3.2. Product Portfolio

            15.1.3.3. Profitability by Market Segments

            15.1.3.4. Sales Footprint

            15.1.3.5. Strategy Overview

                15.1.3.5.1. Marketing Strategy

        15.1.4. Alltion (Wuzhou) Co., Ltd.

            15.1.4.1. Overview

            15.1.4.2. Product Portfolio

            15.1.4.3. Profitability by Market Segments

            15.1.4.4. Sales Footprint

            15.1.4.5. Strategy Overview

                15.1.4.5.1. Marketing Strategy

        15.1.5. Keeler Ltd.

            15.1.5.1. Overview

            15.1.5.2. Product Portfolio

            15.1.5.3. Profitability by Market Segments

            15.1.5.4. Sales Footprint

            15.1.5.5. Strategy Overview

                15.1.5.5.1. Marketing Strategy

        15.1.6. Propper Manufacturing

            15.1.6.1. Overview

            15.1.6.2. Product Portfolio

            15.1.6.3. Profitability by Market Segments

            15.1.6.4. Sales Footprint

            15.1.6.5. Strategy Overview

                15.1.6.5.1. Marketing Strategy

        15.1.7. Welch Allyn

            15.1.7.1. Overview

            15.1.7.2. Product Portfolio

            15.1.7.3. Profitability by Market Segments

            15.1.7.4. Sales Footprint

            15.1.7.5. Strategy Overview

                15.1.7.5.1. Marketing Strategy

        15.1.8. Oak Tree Group

            15.1.8.1. Overview

            15.1.8.2. Product Portfolio

            15.1.8.3. Profitability by Market Segments

            15.1.8.4. Sales Footprint

            15.1.8.5. Strategy Overview

                15.1.8.5.1. Marketing Strategy

        15.1.9. Carl Zeiss Meditec AG

            15.1.9.1. Overview

            15.1.9.2. Product Portfolio

            15.1.9.3. Profitability by Market Segments

            15.1.9.4. Sales Footprint

            15.1.9.5. Strategy Overview

                15.1.9.5.1. Marketing Strategy

        15.1.10. Heine Optotechnik

            15.1.10.1. Overview

            15.1.10.2. Product Portfolio

            15.1.10.3. Profitability by Market Segments

            15.1.10.4. Sales Footprint

            15.1.10.5. Strategy Overview

                15.1.10.5.1. Marketing Strategy

16. Assumptions & Acronyms Used

17. Research Methodology

List of Tables

Table 1: Global Market Value (US$ Million) Forecast by Region, 2016 to 2032

Table 2: Global Market Value (US$ Million) Forecast by Product Type, 2016 to 2032

Table 3: Global Market Value (US$ Million) Forecast by End User, 2016 to 2032

Table 4: North America Market Value (US$ Million) Forecast by Country, 2016 to 2032

Table 5: North America Market Value (US$ Million) Forecast by Product Type, 2016 to 2032

Table 6: North America Market Value (US$ Million) Forecast by End User, 2016 to 2032

Table 7: Latin America Market Value (US$ Million) Forecast by Country, 2016 to 2032

Table 8: Latin America Market Value (US$ Million) Forecast by Product Type, 2016 to 2032

Table 9: Latin America Market Value (US$ Million) Forecast by End User, 2016 to 2032

Table 10: Europe Market Value (US$ Million) Forecast by Country, 2016 to 2032

Table 11: Europe Market Value (US$ Million) Forecast by Product Type, 2016 to 2032

Table 12: Europe Market Value (US$ Million) Forecast by End User, 2016 to 2032

Table 13: Asia Pacific Market Value (US$ Million) Forecast by Country, 2016 to 2032

Table 14: Asia Pacific Market Value (US$ Million) Forecast by Product Type, 2016 to 2032

Table 15: Asia Pacific Market Value (US$ Million) Forecast by End User, 2016 to 2032

Table 16: Middle East and Africa Market Value (US$ Million) Forecast by Country, 2016 to 2032

Table 17: Middle East and Africa Market Value (US$ Million) Forecast by Product Type, 2016 to 2032

Table 18: Middle East and Africa Market Value (US$ Million) Forecast by End User, 2016 to 2032

List of Charts

Figure 1: Global Market Value (US$ Million) by Product Type, 2022 to 2032

Figure 2: Global Market Value (US$ Million) by End User, 2022 to 2032

Figure 3: Global Market Value (US$ Million) by Region, 2022 to 2032

Figure 4: Global Market Value (US$ Million) Analysis by Region, 2016 to 2032

Figure 5: Global Market Value Share (%) and BPS Analysis by Region, 2022 to 2032

Figure 6: Global Market Y-o-Y Growth (%) Projections by Region, 2022 to 2032

Figure 7: Global Market Value (US$ Million) Analysis by Product Type, 2016 to 2032

Figure 8: Global Market Value Share (%) and BPS Analysis by Product Type, 2022 to 2032

Figure 9: Global Market Y-o-Y Growth (%) Projections by Product Type, 2022 to 2032

Figure 10: Global Market Value (US$ Million) Analysis by End User, 2016 to 2032

Figure 11: Global Market Value Share (%) and BPS Analysis by End User, 2022 to 2032

Figure 12: Global Market Y-o-Y Growth (%) Projections by End User, 2022 to 2032

Figure 13: Global Market Attractiveness by Product Type, 2022 to 2032

Figure 14: Global Market Attractiveness by End User, 2022 to 2032

Figure 15: Global Market Attractiveness by Region, 2022 to 2032

Figure 16: North America Market Value (US$ Million) by Product Type, 2022 to 2032

Figure 17: North America Market Value (US$ Million) by End User, 2022 to 2032

Figure 18: North America Market Value (US$ Million) by Country, 2022 to 2032

Figure 19: North America Market Value (US$ Million) Analysis by Country, 2016 to 2032

Figure 20: North America Market Value Share (%) and BPS Analysis by Country, 2022 to 2032

Figure 21: North America Market Y-o-Y Growth (%) Projections by Country, 2022 to 2032

Figure 22: North America Market Value (US$ Million) Analysis by Product Type, 2016 to 2032

Figure 23: North America Market Value Share (%) and BPS Analysis by Product Type, 2022 to 2032

Figure 24: North America Market Y-o-Y Growth (%) Projections by Product Type, 2022 to 2032

Figure 25: North America Market Value (US$ Million) Analysis by End User, 2016 to 2032

Figure 26: North America Market Value Share (%) and BPS Analysis by End User, 2022 to 2032

Figure 27: North America Market Y-o-Y Growth (%) Projections by End User, 2022 to 2032

Figure 28: North America Market Attractiveness by Product Type, 2022 to 2032

Figure 29: North America Market Attractiveness by End User, 2022 to 2032

Figure 30: North America Market Attractiveness by Country, 2022 to 2032

Figure 31: Latin America Market Value (US$ Million) by Product Type, 2022 to 2032

Figure 32: Latin America Market Value (US$ Million) by End User, 2022 to 2032

Figure 33: Latin America Market Value (US$ Million) by Country, 2022 to 2032

Figure 34: Latin America Market Value (US$ Million) Analysis by Country, 2016 to 2032

Figure 35: Latin America Market Value Share (%) and BPS Analysis by Country, 2022 to 2032

Figure 36: Latin America Market Y-o-Y Growth (%) Projections by Country, 2022 to 2032

Figure 37: Latin America Market Value (US$ Million) Analysis by Product Type, 2016 to 2032

Figure 38: Latin America Market Value Share (%) and BPS Analysis by Product Type, 2022 to 2032

Figure 39: Latin America Market Y-o-Y Growth (%) Projections by Product Type, 2022 to 2032

Figure 40: Latin America Market Value (US$ Million) Analysis by End User, 2016 to 2032

Figure 41: Latin America Market Value Share (%) and BPS Analysis by End User, 2022 to 2032

Figure 42: Latin America Market Y-o-Y Growth (%) Projections by End User, 2022 to 2032

Figure 43: Latin America Market Attractiveness by Product Type, 2022 to 2032

Figure 44: Latin America Market Attractiveness by End User, 2022 to 2032

Figure 45: Latin America Market Attractiveness by Country, 2022 to 2032

Figure 46: Europe Market Value (US$ Million) by Product Type, 2022 to 2032

Figure 47: Europe Market Value (US$ Million) by End User, 2022 to 2032

Figure 48: Europe Market Value (US$ Million) by Country, 2022 to 2032

Figure 49: Europe Market Value (US$ Million) Analysis by Country, 2016 to 2032

Figure 50: Europe Market Value Share (%) and BPS Analysis by Country, 2022 to 2032

Figure 51: Europe Market Y-o-Y Growth (%) Projections by Country, 2022 to 2032

Figure 52: Europe Market Value (US$ Million) Analysis by Product Type, 2016 to 2032

Figure 53: Europe Market Value Share (%) and BPS Analysis by Product Type, 2022 to 2032

Figure 54: Europe Market Y-o-Y Growth (%) Projections by Product Type, 2022 to 2032

Figure 55: Europe Market Value (US$ Million) Analysis by End User, 2016 to 2032

Figure 56: Europe Market Value Share (%) and BPS Analysis by End User, 2022 to 2032

Figure 57: Europe Market Y-o-Y Growth (%) Projections by End User, 2022 to 2032

Figure 58: Europe Market Attractiveness by Product Type, 2022 to 2032

Figure 59: Europe Market Attractiveness by End User, 2022 to 2032

Figure 60: Europe Market Attractiveness by Country, 2022 to 2032

Figure 61: Asia Pacific Market Value (US$ Million) by Product Type, 2022 to 2032

Figure 62: Asia Pacific Market Value (US$ Million) by End User, 2022 to 2032

Figure 63: Asia Pacific Market Value (US$ Million) by Country, 2022 to 2032

Figure 64: Asia Pacific Market Value (US$ Million) Analysis by Country, 2016 to 2032

Figure 65: Asia Pacific Market Value Share (%) and BPS Analysis by Country, 2022 to 2032

Figure 66: Asia Pacific Market Y-o-Y Growth (%) Projections by Country, 2022 to 2032

Figure 67: Asia Pacific Market Value (US$ Million) Analysis by Product Type, 2016 to 2032

Figure 68: Asia Pacific Market Value Share (%) and BPS Analysis by Product Type, 2022 to 2032

Figure 69: Asia Pacific Market Y-o-Y Growth (%) Projections by Product Type, 2022 to 2032

Figure 70: Asia Pacific Market Value (US$ Million) Analysis by End User, 2016 to 2032

Figure 71: Asia Pacific Market Value Share (%) and BPS Analysis by End User, 2022 to 2032

Figure 72: Asia Pacific Market Y-o-Y Growth (%) Projections by End User, 2022 to 2032

Figure 73: Asia Pacific Market Attractiveness by Product Type, 2022 to 2032

Figure 74: Asia Pacific Market Attractiveness by End User, 2022 to 2032

Figure 75: Asia Pacific Market Attractiveness by Country, 2022 to 2032

Figure 76: Middle East and Africa Market Value (US$ Million) by Product Type, 2022 to 2032

Figure 77: Middle East and Africa Market Value (US$ Million) by End User, 2022 to 2032

Figure 78: Middle East and Africa Market Value (US$ Million) by Country, 2022 to 2032

Figure 79: Middle East and Africa Market Value (US$ Million) Analysis by Country, 2016 to 2032

Figure 80: Middle East and Africa Market Value Share (%) and BPS Analysis by Country, 2022 to 2032

Figure 81: Middle East and Africa Market Y-o-Y Growth (%) Projections by Country, 2022 to 2032

Figure 82: Middle East and Africa Market Value (US$ Million) Analysis by Product Type, 2016 to 2032

Figure 83: Middle East and Africa Market Value Share (%) and BPS Analysis by Product Type, 2022 to 2032

Figure 84: Middle East and Africa Market Y-o-Y Growth (%) Projections by Product Type, 2022 to 2032

Figure 85: Middle East and Africa Market Value (US$ Million) Analysis by End User, 2016 to 2032

Figure 86: Middle East and Africa Market Value Share (%) and BPS Analysis by End User, 2022 to 2032

Figure 87: Middle East and Africa Market Y-o-Y Growth (%) Projections by End User, 2022 to 2032

Figure 88: Middle East and Africa Market Attractiveness by Product Type, 2022 to 2032

Figure 89: Middle East and Africa Market Attractiveness by End User, 2022 to 2032

Figure 90: Middle East and Africa Market Attractiveness by Country, 2022 to 2032

Recommendations

Healthcare

Ophthalmic Diagnostic Equipment Market

Published : March 2024

Healthcare

Ophthalmic Lasers Market

Published : June 2022

Explore Healthcare Insights

View Reports

Head Band Ophthalmoscopes Market