Reports

- Global Locations -

Headquarters

Future Market Insights, Inc.

Christiana Corporate, 200
Continental Drive, Suite 401,
Newark, Delaware - 19713,
United States

T: +1-845-579-5705

Americas

Future Market Insights, Inc.

616 Corporate Way, Suite 2-9018,
Valley Cottage, NY 10989, United States

T: +1-347-918-3531

MEA

Future Market Insights

1602-6 Jumeirah Bay X2 Tower, Plot No: JLT-PH2-X2A,
Jumeirah Lakes Towers, Dubai,
United Arab Emirates

Europe

Future Market Insights

3rd Floor, 207 Regent Street,
W1B 3HH London
United Kingdom

T: + 44 (0) 20 8123 9659
D: +44 (0) 20 3287 4268

Asia Pacific

Future Market Insights

IndiaLand Global Tech Park, Unit UG-1, Behind Grand HighStreet, Phase 1, Hinjawadi, MH, Pune – 411057, India

Health and Fitness Club Market Outlook for 2024 to 2034

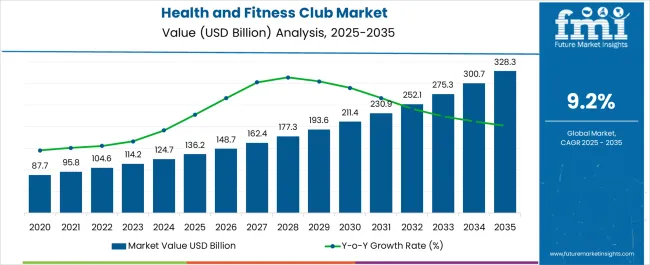
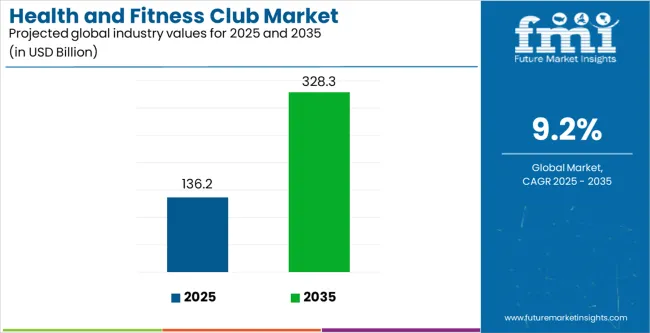
The health and fitness club market size is envisioned to have a transformative uplift of US$ 302.0 billion by 2034, up from US$ 124.7 billion in 2024. Likely to grow at 9.2% CAGR through 2034, the market is foreseen to broaden extensively.

Attributes Key Statistics
Health and Fitness Club Market Value (2024) US$ 124.7 billion
Forecast Market Value (2034) US$ 302.0 billion
Estimated Growth (2024 to 2034) 9.2% CAGR

Don't pay for what you don't need

Customize your report by selecting specific countries or regions and save 30%!

Key Market Drivers

Boutique Fitness Studio

Demand for Boutique fitness centers has risen, particularly among millennials and Gen-Z. These fitness centers cater to individuals ready to pay a premium price for a curated workout experience. Rise of social media and influencer culture is making fitness a more attractive lifestyle choice.

With people spending half their time on social media, the craze to keep themselves in shape and look more attractive has added to these centers. This trend of bodybuilding, zero-figure, and fresh skin has added weight to the growth of the gym and health clubs market.

Corporatization of Jobs

The modern way of life is characterized by long working hours, which makes people stagnant with no body movements. Due to this increasing urbanization and a sedentary lifestyle, people are now more focused on their health to stay active. This, in turn, is also boosting the growth of corporate well-being programs and employee wellness initiatives, contributing to the overall demand for fitness clubs.

Health Concerns

Awareness about the importance of physical fitness and healthy lifestyle choices is a key factor driving the market of gyms and health fitness clubs. With the western lifestyle, the emergence of a snacking culture has heightened obesity and health issues.

Considering the rising incidence of chronic diseases in developed and developing economies, health and fitness chains in the market are introducing awareness campaigns and free trial periods for more entries. This attracts a substantial consumer base to the market.

Rising disposable income and changing consumer preferences contribute to increased health and wellness spending.

Conveniently Located Fitness Clubs

Thriving construction industry is giving rise to a greater number of apartments offering perks like fitness clubs and yoga centers. The availability of free or concessional fitness centers induces people to visit them more. This has upsurged the workout club market overall.

Technological Advancements

Advancements in technology have led to the development of new fitness equipment and wearable technology, attracting more consumers to fitness clubs. Wearables and mobile tracking trends have escalated the sense of fitness from the young to the older generation. The subconscious behavior of fulfilling this health target adds to the gym industry crowd.

Factors Muzzling the Health and Fitness Club Market

Lack of awareness among the target audience regarding the benefits of health and fitness clubs is stymying the market growth of gyms or fitness clubs. Easy accessibility to a plethora of information on social media and short video platforms is forcing the general public to work out from their homes instead of joining expensive fitness clubs.

Limited accessibility of the club, specifically in areas with no proper transportation facilities, and thus high membership fees discourage potential clients from joining the club. Thus, the availability of low-cost alternative fitness options such as homework out of outdoor activities deters the health and fitness club market.

Shortage of skilled fitness trainers and instructors leads to poor quality of service, which upsets the clients on moving forward to fitness goals. Shortcomings of innovation and creativity in terms of fitness programs and classes offered by clubs demotivate the younger and older generations to go off track.

Fitness clubs are no longer relegated to being construed as halls for the wealthy. Affordable plans and a focus on fitness among consumers with tight purses is seeing the consumer base for fitness clubs widen.

Ronak Shah
Ronak Shah

Principal Consultant

Talk to Analyst

Find your sweet spots for generating winning opportunities in this market.

Comparative View of Adjacent Industries

Addressing the shifting climatic changes and kick-lifting move toward physical and mental health, the population is more aware of daily fitness goals. Embracing a more comprehensive definition of health and actively working to address the drivers of health throughout life, one has to be more dedicated to personal and work-life balance. This activeness in lifting weights and breathing out unhealthy gases to stand upright is the need of the hour.

These findings, consonant with research conducted by Future Market Insights, have analyzed data and analytics to harness the competitive market and scatter the boundaries in adjacent markets; we have arranged the insights on the market that could pose stiff competition with the health and fitness club market—the yoga and meditation market and the personal fitness trainer market.

Health and Fitness Club Market:

Attributes Health and Fitness Club Market
CAGR (2024 to 2034) 9.2%
Market Value (2034) US$ 302.0 billion
Growth Factor Growing concern about obesity and related health issues
Key Challenges High cost of maintaining and upgrading fitness equipment can result in high membership fees

Yoga and Meditation Market:

Attributes Yoga and Meditation Market
CAGR (2023 to 2033) 18.10%
Market Value (2033) US$ 32.41 billion
Growth Factor Growing awareness towards mental peace and improving body posture
Key Challenges Ensuring the quality and authenticity of instructors and practices remains a concern

Personal Fitness Trainer Market:

Attributes Personal Fitness Trainer Market
CAGR (2023 to 2033) 4.6%
Market Value (2033) US$ 65.5 billion
Growth Factor Increasing demand for proper exercises with techniques
Key Challenges Do-it-yourself fitness trends are impeding the market

Category-wise Insights

Growing Importance of Personalized Training Experience

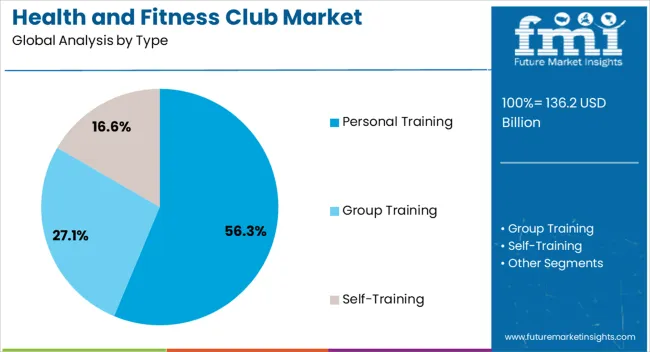
Technology has played a vital role in the shift of personalized workout plans, nutrition guidance, and progress tracking. With a 9.0% CAGR, personal training is skyrocketing in the health and fitness club market through 2034.

Attributes Details
Top Type Personal Training
CAGR (2024 to 2034) 9.0%

Celebrities play a significant role in shaping fitness trends and popularizing exercise routines. These celebrities often opt for personal trainers and thus personal training. This tendency among the affluent population is setting bars for personal training.

The trend of boutique fitness studios with smaller class sizes and high-quality personal trainers is catering to individuals who seek a tailored fitness experience. Personalization has become a key trend in the fitness industry as people are now more focused on goals and preferences and are seeking prioritized attention. The market of personal training in the health and fitness industry has been uplifted by promoting engagement and adherence to fitness regimes.

Focus on Personal Physique and Socialization in 20 and 40 years Age Groups

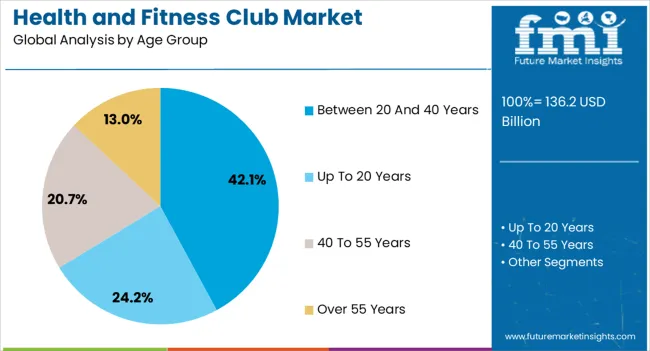
Age groups between 20 and 40 years are drawing the market statistics with an 8.8% CAGR for 2024 to 2034.

Attributes Details
Age Group Between 20 and 40 Years
CAGR (2024 to 2034) 8.8%

Age group of 20 and 40 years desire a healthy lifestyle and are more health conscious. They are more likely to prioritize fitness and seek to connect with more people. Cities are a hub of opportunity to realize this potential of fitness, and younger are mostly shifting to cities for the betterment of their future. With this, the rising disposable income and lifestyle changes caused the growth of the gymnasium industry in these age groups.

The age group of 20 to 40 years is most likely to be connected with their appearance and seek out ways to improve their physique. Health and fitness clubs offer access to equipment and facilities that can help them achieve their aesthetic goals.

Convenience of location and flexible hours for workouts are other factors that make it easier for this age group to fit gym schedules into their busy lives.

Get the data you need at a Fraction of the cost

Personalize your report by choosing insights you need
and save 40%!

Country-wise Insights

In parallel with the above information, countries must adopt ongoing trends and expand their boundaries with innovative approaches. The fashion of staying in shape has infected people of all age groups. Personal appearance and health concerns are key factors emerging as social causes with benefits for people by people.

The countries mentioned reflect their consumers' preferences, age groups, climatic variations, and thus beauty scales, acquiring companies to increase market share. We are subjecting India, China, Japan, the United States, and South Korea here.

Countries CAGR through 2034
South Korea 11.1%
Japan 10.9%
United Kingdom 10.3%
China 9.9%
United States 9.6%

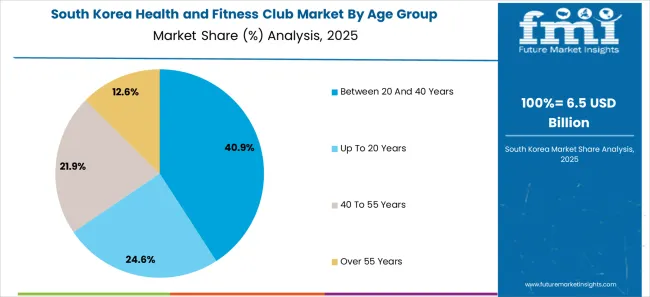
Growing Beauty and Health Trends in South Korea

South Korean virtual reality workouts have become a rage, allowing users a more immersive fitness experience. This technological advancement in South Korea has boosted the sweating experience with an 11.1% CAGR through 2034.

Versatility in fitness programs and offerings suggests the breadth of South Korean gym culture. The fashion industry, models, and influencers of South Korea have given a tough fight to the world, sparking results in fitness.

From yoga to CrossFit to aqua aerobics, the diversity shows the country's adaptability and willingness to participate in various fitness and wellness sectors. The health and fitness club market in South Korea is upsurging, with many new investors and companies contributing to this sector.
Calisthenics Tradition in Japan

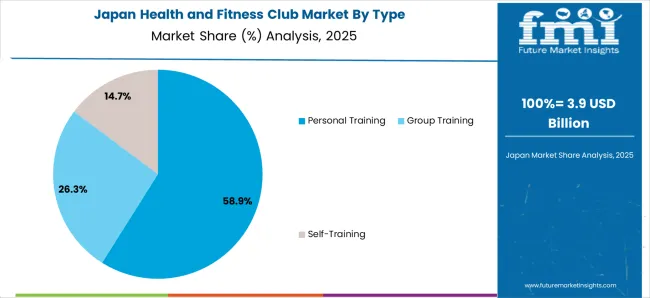
The emphasis of Japanese people on public awareness and fitness education reveals its depth in the health and fitness sector. The hectic lifestyle and lack of work-life balance have influenced the fitness center market in Japan. With a 10.9% CAGR, Japan is a prominent player in the fitness club market. Corporates in Japan provide incentives to their employees in the form of fitness club subscriptions and memberships, lifting the market growth

Japan, with its morning radio calisthenics tradition, radiates the embedding of fitness in daily life. With an adapted culture that educates its people about fitness, ensuring its longevity and growth, Japan has broadened its interest in fitness and gym industries.

Fusion of technology with Traditional Exercises in the United Kingdom

The fusion of technology with fitness is a running trend in the United Kingdom. The country embraces this merger, offering smart equipment and virtual fitness solutions. This highlights the progressive gym culture in the countries, with a CAGR of 10.3% from 2024 to 2034.

The United Kingdom's population is one of the most sports-loving communities in the world, with an affinity to different sports like football, cricket, rugby, etc. This has invoked a kind of fitness in the running generation, aiding the popularity of fitness clubs and health centers.

The rise of boutique fitness studios, offering everything from spinning to HIIT to yoga, testifies to the country’s evolving gym culture. Events like the London Marathon draw international attention, while local initiatives promote community fitness and well-being.

Obesity Concerns in China

Rising urbanization, which leads to a sizeable middle-class population, keeps the fitness club market on the right track in China. With a CAGR of 9.9% through 2034, the country is upticking the list in emerging markets.

Obesity and healthcare concerns among Chinese are key actors driving the fitness culture and uplifting the fitness club market in China. Trends like functional fitness, mental wellness, and holistic health have found their way into the gym culture. Gyms now integrate services like meditation, nutrition workshops, and recovery zones, evolving into wellness hubs in China.
The United States Rich Culture of Fitness

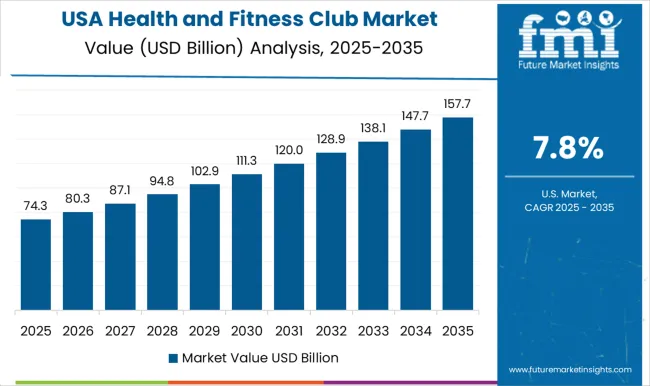
Fitness has a rich history in the United States, making it a prominent player in the industry. According to IHRSA Data, more than 71.5 million individuals in the USA made use of health clubs in 2018, and the graph has green-flagged the market in the coming years with a 9.6% CAGR through 2034. Judging by these numbers, the United States leads the way, with the most gyms and the highest gym attendance rates.

Athletic lifestyle is bolstered by the continuing popularity of sports, especially due to recent sporting successes such as winning the cricket World Cup in 2023, which ensures that fitness clubs remain as popular as ever.
Competitive Landscape

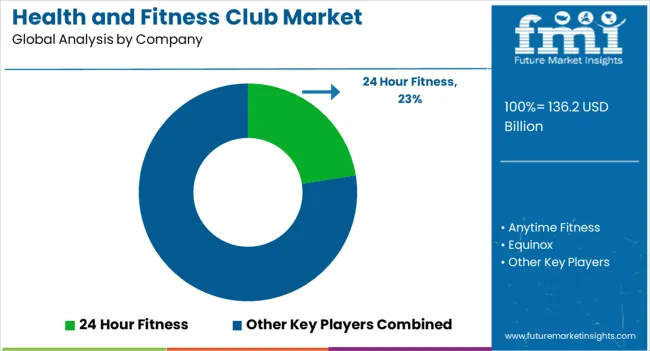
The health and fitness club market is a highly competitive industry, with many key players vying for a market share. Some of the biggest companies in this space include 24 Hour Fitness, Gold's Gym, Anytime Fitness, Equinox, LA Fitness, and Planet Fitness. These companies offer a range of services and amenities, from advanced equipment and personalized training to group classes and spa treatments.

Each company has its plethora of offerings with the thought of expansion. This, with the ever-lasting spirit of physical health care, is opening doors for many companies to compete despite the presence of big players. As the concerns are going to rise with changing times, the expansion of the health and fitness club market has big grounds to cover.

Recent Advancements

  • In February 2024, Pompey Health and Fitness Club saw a surge in memberships after completing a £3m renovation project. The gym, now under Portsmouth FC's management, underwent extensive upgrades, including new facilities like a steam room, sauna, and fitness studios, enhancing the experience for fitness enthusiasts.
  • In March 2024, Keepme announced a partnership with Empowered Brands, a key player in UK fitness franchising. Empowered Brands, with 18 years of experience, focused on fostering growth in health and fitness. Their portfolio included énergie Fitness, with over 80 clubs, and UBX, a rapidly expanding boxing and strength provider.

Key Companies in the Market

  • 24 Hour Fitness
  • Anytime Fitness
  • Equinox
  • LA Fitness
  • Gold's Gym International, Inc
  • Life Time, Inc.
  • Planet Fitness Franchising
  • LLC
  • The Bay Club Company

Key Coverage in the Health and Fitness Club Market Report

  • What is The Difference Between A Health Club and a Gym
  • Market Dynamics of the Bodybuilding Center Market
  • Market Growth Opportunity in United States Health and Fitness Club Market
  • Market Analysis of Gym Industry
  • Fitness Centers & Health Clubs Market Research
  • Emerging Trends in the Wellness Center Market

Market Segmentation

By Type:

  • Personal Training
  • Group Training
  • Self-Training

By Age Group:

  • Up to 20 Years
  • Between 20 and 40 Years
  • 40 to 55 Years
  • Over 55 Years

By Region:

  • North America
  • Latin America
  • Asia Pacific
  • Middle East and Africa (MEA)
  • Europe

Frequently Asked Questions

What is the Health and Fitness Club Market Worth in 2024?

The health and fitness club market is set to reach US$ 124.7 billion in 2024.

What is the Forecast for the Health and Fitness Club Market by 2034?

The health and fitness club market is expected to reach US$ 302.0 billion by 2034.

At What Rate is the Health and Fitness Club Market Expected to Grow?

The health and fitness club market is expected to grow at a CAGR of 9.2% from 2024 to 2034.

Which is the Top Type in the Health and Fitness Club Market?

Personal health and fitness club training increased at a CAGR of 9.0% through 2034.

How will the Health and Fitness Club Market Progress in South Korea?

The market in South Korea is expected to progress at a CAGR of 11.1% through 2034.

Table of Content

1. Executive Summary

    1.1. Global Market Outlook

    1.2. Demand-side Trends

    1.3. Supply-side Trends

    1.4. Technology Roadmap Analysis

    1.5. Analysis and Recommendations

2. Market Overview

    2.1. Market Coverage / Taxonomy

    2.2. Market Definition / Scope / Limitations

3. Market Background

    3.1. Market Dynamics

        3.1.1. Drivers

        3.1.2. Restraints

        3.1.3. Opportunity

        3.1.4. Trends

    3.2. Scenario Forecast

        3.2.1. Demand in Optimistic Scenario

        3.2.2. Demand in Likely Scenario

        3.2.3. Demand in Conservative Scenario

    3.3. Opportunity Map Analysis

    3.4. Investment Feasibility Matrix

    3.5. PESTLE and Porter’s Analysis

    3.6. Regulatory Landscape

        3.6.1. By Key Regions

        3.6.2. By Key Countries

    3.7. Regional Parent Market Outlook

4. Global Market Analysis 2019 to 2023 and Forecast, 2024 to 2034

    4.1. Historical Market Size Value (US$ Million) Analysis, 2019 to 2023

    4.2. Current and Future Market Size Value (US$ Million) Projections, 2024 to 2034

        4.2.1. Y-o-Y Growth Trend Analysis

        4.2.2. Absolute $ Opportunity Analysis

5. Global Market Analysis 2019 to 2023 and Forecast 2024 to 2034, By Type

    5.1. Introduction / Key Findings

    5.2. Historical Market Size Value (US$ Million) Analysis By Type, 2019 to 2023

    5.3. Current and Future Market Size Value (US$ Million) Analysis and Forecast By Type, 2024 to 2034

        5.3.1. Personal Training

        5.3.2. Group Training

        5.3.3. Self-Training

    5.4. Y-o-Y Growth Trend Analysis By Type, 2019 to 2023

    5.5. Absolute $ Opportunity Analysis By Type, 2024 to 2034

6. Global Market Analysis 2019 to 2023 and Forecast 2024 to 2034, By Age Group

    6.1. Introduction / Key Findings

    6.2. Historical Market Size Value (US$ Million) Analysis By Age Group, 2019 to 2023

    6.3. Current and Future Market Size Value (US$ Million) Analysis and Forecast By Age Group, 2024 to 2034

        6.3.1. Up to 20 Years

        6.3.2. 20 to 40 Years

        6.3.3. 40 to 55 Years

        6.3.4. Above 55 Years

    6.4. Y-o-Y Growth Trend Analysis By Age Group, 2019 to 2023

    6.5. Absolute $ Opportunity Analysis By Age Group, 2024 to 2034

7. Global Market Analysis 2019 to 2023 and Forecast 2024 to 2034, By Region

    7.1. Introduction

    7.2. Historical Market Size Value (US$ Million) Analysis By Region, 2019 to 2023

    7.3. Current Market Size Value (US$ Million) Analysis and Forecast By Region, 2024 to 2034

        7.3.1. North America

        7.3.2. Latin America

        7.3.3. Western Europe

        7.3.4. Eastern Europe

        7.3.5. South Asia and Pacific

        7.3.6. East Asia

        7.3.7. Middle East and Africa

    7.4. Market Attractiveness Analysis By Region

8. North America Market Analysis 2019 to 2023 and Forecast 2024 to 2034, By Country

    8.1. Historical Market Size Value (US$ Million) Trend Analysis By Market Taxonomy, 2019 to 2023

    8.2. Market Size Value (US$ Million) Forecast By Market Taxonomy, 2024 to 2034

        8.2.1. By Country

            8.2.1.1. USA

            8.2.1.2. Canada

        8.2.2. By Type

        8.2.3. By Age Group

    8.3. Market Attractiveness Analysis

        8.3.1. By Country

        8.3.2. By Type

        8.3.3. By Age Group

    8.4. Key Takeaways

9. Latin America Market Analysis 2019 to 2023 and Forecast 2024 to 2034, By Country

    9.1. Historical Market Size Value (US$ Million) Trend Analysis By Market Taxonomy, 2019 to 2023

    9.2. Market Size Value (US$ Million) Forecast By Market Taxonomy, 2024 to 2034

        9.2.1. By Country

            9.2.1.1. Brazil

            9.2.1.2. Mexico

            9.2.1.3. Rest of Latin America

        9.2.2. By Type

        9.2.3. By Age Group

    9.3. Market Attractiveness Analysis

        9.3.1. By Country

        9.3.2. By Type

        9.3.3. By Age Group

    9.4. Key Takeaways

10. Western Europe Market Analysis 2019 to 2023 and Forecast 2024 to 2034, By Country

    10.1. Historical Market Size Value (US$ Million) Trend Analysis By Market Taxonomy, 2019 to 2023

    10.2. Market Size Value (US$ Million) Forecast By Market Taxonomy, 2024 to 2034

        10.2.1. By Country

            10.2.1.1. Germany

            10.2.1.2. UK

            10.2.1.3. France

            10.2.1.4. Spain

            10.2.1.5. Italy

            10.2.1.6. Rest of Western Europe

        10.2.2. By Type

        10.2.3. By Age Group

    10.3. Market Attractiveness Analysis

        10.3.1. By Country

        10.3.2. By Type

        10.3.3. By Age Group

    10.4. Key Takeaways

11. Eastern Europe Market Analysis 2019 to 2023 and Forecast 2024 to 2034, By Country

    11.1. Historical Market Size Value (US$ Million) Trend Analysis By Market Taxonomy, 2019 to 2023

    11.2. Market Size Value (US$ Million) Forecast By Market Taxonomy, 2024 to 2034

        11.2.1. By Country

            11.2.1.1. Poland

            11.2.1.2. Russia

            11.2.1.3. Czech Republic

            11.2.1.4. Romania

            11.2.1.5. Rest of Eastern Europe

        11.2.2. By Type

        11.2.3. By Age Group

    11.3. Market Attractiveness Analysis

        11.3.1. By Country

        11.3.2. By Type

        11.3.3. By Age Group

    11.4. Key Takeaways

12. South Asia and Pacific Market Analysis 2019 to 2023 and Forecast 2024 to 2034, By Country

    12.1. Historical Market Size Value (US$ Million) Trend Analysis By Market Taxonomy, 2019 to 2023

    12.2. Market Size Value (US$ Million) Forecast By Market Taxonomy, 2024 to 2034

        12.2.1. By Country

            12.2.1.1. India

            12.2.1.2. Bangladesh

            12.2.1.3. Australia

            12.2.1.4. New Zealand

            12.2.1.5. Rest of South Asia and Pacific

        12.2.2. By Type

        12.2.3. By Age Group

    12.3. Market Attractiveness Analysis

        12.3.1. By Country

        12.3.2. By Type

        12.3.3. By Age Group

    12.4. Key Takeaways

13. East Asia Market Analysis 2019 to 2023 and Forecast 2024 to 2034, By Country

    13.1. Historical Market Size Value (US$ Million) Trend Analysis By Market Taxonomy, 2019 to 2023

    13.2. Market Size Value (US$ Million) Forecast By Market Taxonomy, 2024 to 2034

        13.2.1. By Country

            13.2.1.1. China

            13.2.1.2. Japan

            13.2.1.3. South Korea

        13.2.2. By Type

        13.2.3. By Age Group

    13.3. Market Attractiveness Analysis

        13.3.1. By Country

        13.3.2. By Type

        13.3.3. By Age Group

    13.4. Key Takeaways

14. Middle East and Africa Market Analysis 2019 to 2023 and Forecast 2024 to 2034, By Country

    14.1. Historical Market Size Value (US$ Million) Trend Analysis By Market Taxonomy, 2019 to 2023

    14.2. Market Size Value (US$ Million) Forecast By Market Taxonomy, 2024 to 2034

        14.2.1. By Country

            14.2.1.1. GCC Countries

            14.2.1.2. South Africa

            14.2.1.3. Israel

            14.2.1.4. Rest of MEA

        14.2.2. By Type

        14.2.3. By Age Group

    14.3. Market Attractiveness Analysis

        14.3.1. By Country

        14.3.2. By Type

        14.3.3. By Age Group

    14.4. Key Takeaways

15. Key Countries Market Analysis

    15.1. USA

        15.1.1. Market Share Analysis, 2023

            15.1.1.1. By Type

            15.1.1.2. By Age Group

    15.2. Canada

        15.2.1. Market Share Analysis, 2023

            15.2.1.1. By Type

            15.2.1.2. By Age Group

    15.3. Brazil

        15.3.1. Market Share Analysis, 2023

            15.3.1.1. By Type

            15.3.1.2. By Age Group

    15.4. Mexico

        15.4.1. Market Share Analysis, 2023

            15.4.1.1. By Type

            15.4.1.2. By Age Group

    15.5. Germany

        15.5.1. Market Share Analysis, 2023

            15.5.1.1. By Type

            15.5.1.2. By Age Group

    15.6. UK

        15.6.1. Market Share Analysis, 2023

            15.6.1.1. By Type

            15.6.1.2. By Age Group

    15.7. France

        15.7.1. Market Share Analysis, 2023

            15.7.1.1. By Type

            15.7.1.2. By Age Group

    15.8. Spain

        15.8.1. Market Share Analysis, 2023

            15.8.1.1. By Type

            15.8.1.2. By Age Group

    15.9. Italy

        15.9.1. Market Share Analysis, 2023

            15.9.1.1. By Type

            15.9.1.2. By Age Group

    15.10. Poland

        15.10.1. Market Share Analysis, 2023

            15.10.1.1. By Type

            15.10.1.2. By Age Group

    15.11. Russia

        15.11.1. Market Share Analysis, 2023

            15.11.1.1. By Type

            15.11.1.2. By Age Group

    15.12. Czech Republic

        15.12.1. Market Share Analysis, 2023

            15.12.1.1. By Type

            15.12.1.2. By Age Group

    15.13. Romania

        15.13.1. Market Share Analysis, 2023

            15.13.1.1. By Type

            15.13.1.2. By Age Group

    15.14. India

        15.14.1. Market Share Analysis, 2023

            15.14.1.1. By Type

            15.14.1.2. By Age Group

    15.15. Bangladesh

        15.15.1. Market Share Analysis, 2023

            15.15.1.1. By Type

            15.15.1.2. By Age Group

    15.16. Australia

        15.16.1. Market Share Analysis, 2023

            15.16.1.1. By Type

            15.16.1.2. By Age Group

    15.17. New Zealand

        15.17.1. Market Share Analysis, 2023

            15.17.1.1. By Type

            15.17.1.2. By Age Group

    15.18. China

        15.18.1. Market Share Analysis, 2023

            15.18.1.1. By Type

            15.18.1.2. By Age Group

    15.19. Japan

        15.19.1. Market Share Analysis, 2023

            15.19.1.1. By Type

            15.19.1.2. By Age Group

    15.20. South Korea

        15.20.1. Market Share Analysis, 2023

            15.20.1.1. By Type

            15.20.1.2. By Age Group

    15.21. GCC Countries

        15.21.1. Market Share Analysis, 2023

            15.21.1.1. By Type

            15.21.1.2. By Age Group

    15.22. South Africa

        15.22.1. Market Share Analysis, 2023

            15.22.1.1. By Type

            15.22.1.2. By Age Group

    15.23. Israel

        15.23.1. Market Share Analysis, 2023

            15.23.1.1. By Type

            15.23.1.2. By Age Group

16. Market Structure Analysis

    16.1. Competition Dashboard

    16.2. Competition Benchmarking

    16.3. Market Share Analysis of Top Players

        16.3.1. By Regional

        16.3.2. By Type

        16.3.3. By Age Group

17. Competition Analysis

    17.1. Competition Deep Dive

        17.1.1. Equinox Group

            17.1.1.1. Overview

            17.1.1.2. Product Portfolio

            17.1.1.3. Profitability by Market Segments

            17.1.1.4. Sales Footprint

            17.1.1.5. Strategy Overview

                17.1.1.5.1. Marketing Strategy

        17.1.2. Gold's Gym International, Inc.

            17.1.2.1. Overview

            17.1.2.2. Product Portfolio

            17.1.2.3. Profitability by Market Segments

            17.1.2.4. Sales Footprint

            17.1.2.5. Strategy Overview

                17.1.2.5.1. Marketing Strategy

        17.1.3. Life Time, Inc.

            17.1.3.1. Overview

            17.1.3.2. Product Portfolio

            17.1.3.3. Profitability by Market Segments

            17.1.3.4. Sales Footprint

            17.1.3.5. Strategy Overview

                17.1.3.5.1. Marketing Strategy

        17.1.4. Planet Fitness Franchising, LLC

            17.1.4.1. Overview

            17.1.4.2. Product Portfolio

            17.1.4.3. Profitability by Market Segments

            17.1.4.4. Sales Footprint

            17.1.4.5. Strategy Overview

                17.1.4.5.1. Marketing Strategy

        17.1.5. CrossFit, LLC

            17.1.5.1. Overview

            17.1.5.2. Product Portfolio

            17.1.5.3. Profitability by Market Segments

            17.1.5.4. Sales Footprint

            17.1.5.5. Strategy Overview

                17.1.5.5.1. Marketing Strategy

        17.1.6. The Bay Club Company

            17.1.6.1. Overview

            17.1.6.2. Product Portfolio

            17.1.6.3. Profitability by Market Segments

            17.1.6.4. Sales Footprint

            17.1.6.5. Strategy Overview

                17.1.6.5.1. Marketing Strategy

        17.1.7. 24 Hour Fitness USA, LLC

            17.1.7.1. Overview

            17.1.7.2. Product Portfolio

            17.1.7.3. Profitability by Market Segments

            17.1.7.4. Sales Footprint

            17.1.7.5. Strategy Overview

                17.1.7.5.1. Marketing Strategy

        17.1.8. CRUNCH FITNESS

            17.1.8.1. Overview

            17.1.8.2. Product Portfolio

            17.1.8.3. Profitability by Market Segments

            17.1.8.4. Sales Footprint

            17.1.8.5. Strategy Overview

                17.1.8.5.1. Marketing Strategy

        17.1.9. Basic-Fit

            17.1.9.1. Overview

            17.1.9.2. Product Portfolio

            17.1.9.3. Profitability by Market Segments

            17.1.9.4. Sales Footprint

            17.1.9.5. Strategy Overview

                17.1.9.5.1. Marketing Strategy

        17.1.10. SATS Group

            17.1.10.1. Overview

            17.1.10.2. Product Portfolio

            17.1.10.3. Profitability by Market Segments

            17.1.10.4. Sales Footprint

            17.1.10.5. Strategy Overview

                17.1.10.5.1. Marketing Strategy

18. Assumptions & Acronyms Used

19. Research Methodology

List of Tables

Table 1: Global Market Value (US$ Million) Forecast by Region, 2019 to 2034

Table 2: Global Market Value (US$ Million) Forecast by Type, 2019 to 2034

Table 3: Global Market Value (US$ Million) Forecast by Age Group, 2019 to 2034

Table 4: North America Market Value (US$ Million) Forecast by Country, 2019 to 2034

Table 5: North America Market Value (US$ Million) Forecast by Type, 2019 to 2034

Table 6: North America Market Value (US$ Million) Forecast by Age Group, 2019 to 2034

Table 7: Latin America Market Value (US$ Million) Forecast by Country, 2019 to 2034

Table 8: Latin America Market Value (US$ Million) Forecast by Type, 2019 to 2034

Table 9: Latin America Market Value (US$ Million) Forecast by Age Group, 2019 to 2034

Table 10: Western Europe Market Value (US$ Million) Forecast by Country, 2019 to 2034

Table 11: Western Europe Market Value (US$ Million) Forecast by Type, 2019 to 2034

Table 12: Western Europe Market Value (US$ Million) Forecast by Age Group, 2019 to 2034

Table 13: Eastern Europe Market Value (US$ Million) Forecast by Country, 2019 to 2034

Table 14: Eastern Europe Market Value (US$ Million) Forecast by Type, 2019 to 2034

Table 15: Eastern Europe Market Value (US$ Million) Forecast by Age Group, 2019 to 2034

Table 16: South Asia and Pacific Market Value (US$ Million) Forecast by Country, 2019 to 2034

Table 17: South Asia and Pacific Market Value (US$ Million) Forecast by Type, 2019 to 2034

Table 18: South Asia and Pacific Market Value (US$ Million) Forecast by Age Group, 2019 to 2034

Table 19: East Asia Market Value (US$ Million) Forecast by Country, 2019 to 2034

Table 20: East Asia Market Value (US$ Million) Forecast by Type, 2019 to 2034

Table 21: East Asia Market Value (US$ Million) Forecast by Age Group, 2019 to 2034

Table 22: Middle East and Africa Market Value (US$ Million) Forecast by Country, 2019 to 2034

Table 23: Middle East and Africa Market Value (US$ Million) Forecast by Type, 2019 to 2034

Table 24: Middle East and Africa Market Value (US$ Million) Forecast by Age Group, 2019 to 2034

List of Charts

Figure 1: Global Market Value (US$ Million) by Type, 2024 to 2034

Figure 2: Global Market Value (US$ Million) by Age Group, 2024 to 2034

Figure 3: Global Market Value (US$ Million) by Region, 2024 to 2034

Figure 4: Global Market Value (US$ Million) Analysis by Region, 2019 to 2034

Figure 5: Global Market Value Share (%) and BPS Analysis by Region, 2024 to 2034

Figure 6: Global Market Y-o-Y Growth (%) Projections by Region, 2024 to 2034

Figure 7: Global Market Value (US$ Million) Analysis by Type, 2019 to 2034

Figure 8: Global Market Value Share (%) and BPS Analysis by Type, 2024 to 2034

Figure 9: Global Market Y-o-Y Growth (%) Projections by Type, 2024 to 2034

Figure 10: Global Market Value (US$ Million) Analysis by Age Group, 2019 to 2034

Figure 11: Global Market Value Share (%) and BPS Analysis by Age Group, 2024 to 2034

Figure 12: Global Market Y-o-Y Growth (%) Projections by Age Group, 2024 to 2034

Figure 13: Global Market Attractiveness by Type, 2024 to 2034

Figure 14: Global Market Attractiveness by Age Group, 2024 to 2034

Figure 15: Global Market Attractiveness by Region, 2024 to 2034

Figure 16: North America Market Value (US$ Million) by Type, 2024 to 2034

Figure 17: North America Market Value (US$ Million) by Age Group, 2024 to 2034

Figure 18: North America Market Value (US$ Million) by Country, 2024 to 2034

Figure 19: North America Market Value (US$ Million) Analysis by Country, 2019 to 2034

Figure 20: North America Market Value Share (%) and BPS Analysis by Country, 2024 to 2034

Figure 21: North America Market Y-o-Y Growth (%) Projections by Country, 2024 to 2034

Figure 22: North America Market Value (US$ Million) Analysis by Type, 2019 to 2034

Figure 23: North America Market Value Share (%) and BPS Analysis by Type, 2024 to 2034

Figure 24: North America Market Y-o-Y Growth (%) Projections by Type, 2024 to 2034

Figure 25: North America Market Value (US$ Million) Analysis by Age Group, 2019 to 2034

Figure 26: North America Market Value Share (%) and BPS Analysis by Age Group, 2024 to 2034

Figure 27: North America Market Y-o-Y Growth (%) Projections by Age Group, 2024 to 2034

Figure 28: North America Market Attractiveness by Type, 2024 to 2034

Figure 29: North America Market Attractiveness by Age Group, 2024 to 2034

Figure 30: North America Market Attractiveness by Country, 2024 to 2034

Figure 31: Latin America Market Value (US$ Million) by Type, 2024 to 2034

Figure 32: Latin America Market Value (US$ Million) by Age Group, 2024 to 2034

Figure 33: Latin America Market Value (US$ Million) by Country, 2024 to 2034

Figure 34: Latin America Market Value (US$ Million) Analysis by Country, 2019 to 2034

Figure 35: Latin America Market Value Share (%) and BPS Analysis by Country, 2024 to 2034

Figure 36: Latin America Market Y-o-Y Growth (%) Projections by Country, 2024 to 2034

Figure 37: Latin America Market Value (US$ Million) Analysis by Type, 2019 to 2034

Figure 38: Latin America Market Value Share (%) and BPS Analysis by Type, 2024 to 2034

Figure 39: Latin America Market Y-o-Y Growth (%) Projections by Type, 2024 to 2034

Figure 40: Latin America Market Value (US$ Million) Analysis by Age Group, 2019 to 2034

Figure 41: Latin America Market Value Share (%) and BPS Analysis by Age Group, 2024 to 2034

Figure 42: Latin America Market Y-o-Y Growth (%) Projections by Age Group, 2024 to 2034

Figure 43: Latin America Market Attractiveness by Type, 2024 to 2034

Figure 44: Latin America Market Attractiveness by Age Group, 2024 to 2034

Figure 45: Latin America Market Attractiveness by Country, 2024 to 2034

Figure 46: Western Europe Market Value (US$ Million) by Type, 2024 to 2034

Figure 47: Western Europe Market Value (US$ Million) by Age Group, 2024 to 2034

Figure 48: Western Europe Market Value (US$ Million) by Country, 2024 to 2034

Figure 49: Western Europe Market Value (US$ Million) Analysis by Country, 2019 to 2034

Figure 50: Western Europe Market Value Share (%) and BPS Analysis by Country, 2024 to 2034

Figure 51: Western Europe Market Y-o-Y Growth (%) Projections by Country, 2024 to 2034

Figure 52: Western Europe Market Value (US$ Million) Analysis by Type, 2019 to 2034

Figure 53: Western Europe Market Value Share (%) and BPS Analysis by Type, 2024 to 2034

Figure 54: Western Europe Market Y-o-Y Growth (%) Projections by Type, 2024 to 2034

Figure 55: Western Europe Market Value (US$ Million) Analysis by Age Group, 2019 to 2034

Figure 56: Western Europe Market Value Share (%) and BPS Analysis by Age Group, 2024 to 2034

Figure 57: Western Europe Market Y-o-Y Growth (%) Projections by Age Group, 2024 to 2034

Figure 58: Western Europe Market Attractiveness by Type, 2024 to 2034

Figure 59: Western Europe Market Attractiveness by Age Group, 2024 to 2034

Figure 60: Western Europe Market Attractiveness by Country, 2024 to 2034

Figure 61: Eastern Europe Market Value (US$ Million) by Type, 2024 to 2034

Figure 62: Eastern Europe Market Value (US$ Million) by Age Group, 2024 to 2034

Figure 63: Eastern Europe Market Value (US$ Million) by Country, 2024 to 2034

Figure 64: Eastern Europe Market Value (US$ Million) Analysis by Country, 2019 to 2034

Figure 65: Eastern Europe Market Value Share (%) and BPS Analysis by Country, 2024 to 2034

Figure 66: Eastern Europe Market Y-o-Y Growth (%) Projections by Country, 2024 to 2034

Figure 67: Eastern Europe Market Value (US$ Million) Analysis by Type, 2019 to 2034

Figure 68: Eastern Europe Market Value Share (%) and BPS Analysis by Type, 2024 to 2034

Figure 69: Eastern Europe Market Y-o-Y Growth (%) Projections by Type, 2024 to 2034

Figure 70: Eastern Europe Market Value (US$ Million) Analysis by Age Group, 2019 to 2034

Figure 71: Eastern Europe Market Value Share (%) and BPS Analysis by Age Group, 2024 to 2034

Figure 72: Eastern Europe Market Y-o-Y Growth (%) Projections by Age Group, 2024 to 2034

Figure 73: Eastern Europe Market Attractiveness by Type, 2024 to 2034

Figure 74: Eastern Europe Market Attractiveness by Age Group, 2024 to 2034

Figure 75: Eastern Europe Market Attractiveness by Country, 2024 to 2034

Figure 76: South Asia and Pacific Market Value (US$ Million) by Type, 2024 to 2034

Figure 77: South Asia and Pacific Market Value (US$ Million) by Age Group, 2024 to 2034

Figure 78: South Asia and Pacific Market Value (US$ Million) by Country, 2024 to 2034

Figure 79: South Asia and Pacific Market Value (US$ Million) Analysis by Country, 2019 to 2034

Figure 80: South Asia and Pacific Market Value Share (%) and BPS Analysis by Country, 2024 to 2034

Figure 81: South Asia and Pacific Market Y-o-Y Growth (%) Projections by Country, 2024 to 2034

Figure 82: South Asia and Pacific Market Value (US$ Million) Analysis by Type, 2019 to 2034

Figure 83: South Asia and Pacific Market Value Share (%) and BPS Analysis by Type, 2024 to 2034

Figure 84: South Asia and Pacific Market Y-o-Y Growth (%) Projections by Type, 2024 to 2034

Figure 85: South Asia and Pacific Market Value (US$ Million) Analysis by Age Group, 2019 to 2034

Figure 86: South Asia and Pacific Market Value Share (%) and BPS Analysis by Age Group, 2024 to 2034

Figure 87: South Asia and Pacific Market Y-o-Y Growth (%) Projections by Age Group, 2024 to 2034

Figure 88: South Asia and Pacific Market Attractiveness by Type, 2024 to 2034

Figure 89: South Asia and Pacific Market Attractiveness by Age Group, 2024 to 2034

Figure 90: South Asia and Pacific Market Attractiveness by Country, 2024 to 2034

Figure 91: East Asia Market Value (US$ Million) by Type, 2024 to 2034

Figure 92: East Asia Market Value (US$ Million) by Age Group, 2024 to 2034

Figure 93: East Asia Market Value (US$ Million) by Country, 2024 to 2034

Figure 94: East Asia Market Value (US$ Million) Analysis by Country, 2019 to 2034

Figure 95: East Asia Market Value Share (%) and BPS Analysis by Country, 2024 to 2034

Figure 96: East Asia Market Y-o-Y Growth (%) Projections by Country, 2024 to 2034

Figure 97: East Asia Market Value (US$ Million) Analysis by Type, 2019 to 2034

Figure 98: East Asia Market Value Share (%) and BPS Analysis by Type, 2024 to 2034

Figure 99: East Asia Market Y-o-Y Growth (%) Projections by Type, 2024 to 2034

Figure 100: East Asia Market Value (US$ Million) Analysis by Age Group, 2019 to 2034

Figure 101: East Asia Market Value Share (%) and BPS Analysis by Age Group, 2024 to 2034

Figure 102: East Asia Market Y-o-Y Growth (%) Projections by Age Group, 2024 to 2034

Figure 103: East Asia Market Attractiveness by Type, 2024 to 2034

Figure 104: East Asia Market Attractiveness by Age Group, 2024 to 2034

Figure 105: East Asia Market Attractiveness by Country, 2024 to 2034

Figure 106: Middle East and Africa Market Value (US$ Million) by Type, 2024 to 2034

Figure 107: Middle East and Africa Market Value (US$ Million) by Age Group, 2024 to 2034

Figure 108: Middle East and Africa Market Value (US$ Million) by Country, 2024 to 2034

Figure 109: Middle East and Africa Market Value (US$ Million) Analysis by Country, 2019 to 2034

Figure 110: Middle East and Africa Market Value Share (%) and BPS Analysis by Country, 2024 to 2034

Figure 111: Middle East and Africa Market Y-o-Y Growth (%) Projections by Country, 2024 to 2034

Figure 112: Middle East and Africa Market Value (US$ Million) Analysis by Type, 2019 to 2034

Figure 113: Middle East and Africa Market Value Share (%) and BPS Analysis by Type, 2024 to 2034

Figure 114: Middle East and Africa Market Y-o-Y Growth (%) Projections by Type, 2024 to 2034

Figure 115: Middle East and Africa Market Value (US$ Million) Analysis by Age Group, 2019 to 2034

Figure 116: Middle East and Africa Market Value Share (%) and BPS Analysis by Age Group, 2024 to 2034

Figure 117: Middle East and Africa Market Y-o-Y Growth (%) Projections by Age Group, 2024 to 2034

Figure 118: Middle East and Africa Market Attractiveness by Type, 2024 to 2034

Figure 119: Middle East and Africa Market Attractiveness by Age Group, 2024 to 2034

Figure 120: Middle East and Africa Market Attractiveness by Country, 2024 to 2034

Recommendations

Travel and Tourism

Yoga and Meditation Market

Published : September 2023

Services and Utilities

Personal Fitness Trainer Market

Published : June 2023

Explore Services and Utilities Insights

View Reports

Health and Fitness Club Market