Reports

- Global Locations -

Headquarters

Future Market Insights, Inc.

Christiana Corporate, 200
Continental Drive, Suite 401,
Newark, Delaware - 19713,
United States

T: +1-845-579-5705

Americas

Future Market Insights, Inc.

616 Corporate Way, Suite 2-9018,
Valley Cottage, NY 10989, United States

T: +1-347-918-3531

MEA

Future Market Insights

1602-6 Jumeirah Bay X2 Tower, Plot No: JLT-PH2-X2A,
Jumeirah Lakes Towers, Dubai,
United Arab Emirates

Europe

Future Market Insights

3rd Floor, 207 Regent Street,
W1B 3HH London
United Kingdom

T: + 44 (0) 20 8123 9659
D: +44 (0) 20 3287 4268

Asia Pacific

Future Market Insights

IndiaLand Global Tech Park, Unit UG-1, Behind Grand HighStreet, Phase 1, Hinjawadi, MH, Pune – 411057, India

Helicobacter Pylori Infections Treatment Market Snapshot (2023 to 2033)

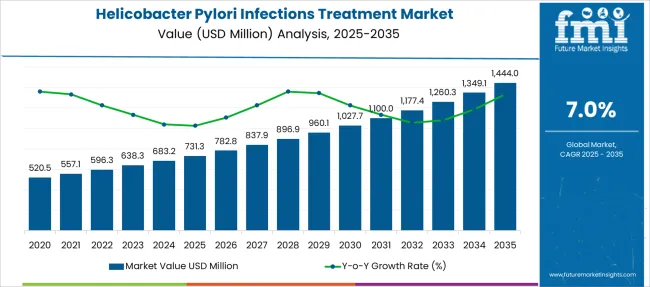
The global helicobacter pylori infections treatment market is expected to surpass an impressive valuation of US$ 638.3 Million in 2023 and is projected to exhibit a compound annual growth rate (CAGR) of 7.04% from 2023 to 2033, reaching US$ 1,260 Million.

Helicobacter pylori (H. pylori) is a gram-negative aerobic bacterium that is frequently found in the stomach. While it helps to maintain the stomach ecology, it can also induce infections of the stomach lining. The bacteria can be one of the causes of stomach cancer, peptic ulcers, gastritis, small intestine contagion, and peptic ulcer disease. This has heightened the need for H. pylori infection diagnostic techniques.

The dispersion of such infections can be linked to a variety of aspects, along with a lack of adequate water supply, poor sanitation, a high population, and poor personal hygiene. Increased awareness of H. pylori infections in the cohort is one of the variables affecting the Helicobacter pylori diagnostics market's expansion. Considering the aforementioned facts and figures, the market is projected to exhibit a good rate of growth.

Report Attribute

Details

Expected Market Value (2023)

US$ 638.3 Million

Anticipated Forecast Value (2033)

US$ 1,260 Million

Projected Growth Rate (2023 to 2033)

7.04% CAGR

Don't pay for what you don't need

Customize your report by selecting specific countries or regions and save 30%!

2018 to 2022 Helicobacter Pylori Infections Treatment Demand Analysis vs. Forecast 2023 to 2033

COVID-19 is an unprecedented global public health crisis that has impacted nearly every marketplace, and the lengthy effects are expected to have an influence on the industry's expansion over the forecast period. Our continuing research expands our research framework to include underlying COVID-19 concerns and potential next steps.

Antibiotic availability and affordability in addition to shorter processing duration will increase antibiotic implementation and requirement for pre and post-surveillance tests. Moreover, rising H. pylori infection rates, the necessity for early diagnosis of symptoms, and technological innovations in diagnostic procedures are estimated to drive overall growth over the forecast period.

Which are Some Prominent Drivers of the Helicobacter Pylori Infections Treatment Market?

Soaring Infectious Disease Incidence Rates and Increased Awareness to propel growth

The growing incidence of communicable diseases and soaring public awareness about infections are the key causes of the industry. Tuberculosis, Chlamydia, gonorrhea, other sexually transmitted illnesses (STDs), stomach flu (gastroenteritis), and bladder infections represent the most prevalent infectious illnesses caused by viruses (UTIs).

For example, according to a research released in 2021 titled "The Global Prevalence of Peptic Ulcer in the World: A Systematic Review and Meta-analysis," the worldwide incidence of peptic ulcer was around 8.4% in 2021. Because helicobacter pylori diagnostics are widely accepted for infectious disease diagnosis, such occurrences indicate that the market is projected to expand at a substantial rate over the coming years.

Diagnostic cost-effectiveness and the necessity for personalized antibiotic therapy drive market expansion

The market is expanding due to increased diagnostic cost-effectiveness and the requirement for personalized antibiotic therapy. The accessibility of low-cost antibiotics and short processing durations are anticipated to boost antibiotic regimen implementation, which will benefit consumers for both pre-and post-monitoring tests.

Furthermore, a rise in the prevalence of Helicobacter pylori infection, higher demand for early recognition of symptoms, and advancements in diagnostic methods all contribute to the market's growth.

Sabyasachi Ghosh
Sabyasachi Ghosh

Principal Consultant

Talk to Analyst

Find your sweet spots for generating winning opportunities in this market.

What are the Challenges Projected to be Faced by the Market?

Diagnostic test restrictions limit growth in the economy

Diagnostic test constraints are predicted to be a significant impediment to the expansion of the Helicobacter pylori diagnostics market. Serology-based assays, for example, have low sensitivity and specificity because they cannot distinguish between acute illness and IgG antibodies present after treatment.
Region-Wise Insights

What Makes North America the Largest Market for Helicobacter Pylori Infections Treatment?

North American Market Growth is credited to rising transmissible diseases

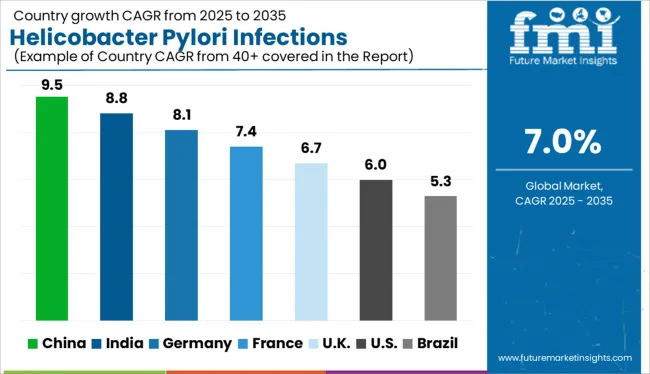
Over the projected timeframe, North America is likely to dominate the global helicobacter pylori diagnostics industry. The rise is attributed to aspects such as a rise in the instances of transmissible diseases, increased awareness of infectious diseases, and the introduction of new products.

For example, Biomerica Inc. announced in June 2021 that it had signed an exclusive five-year partnership deal with a Canadian partner for the marketing and sale of Biomerica's new and proprietary Helicobacter pylori test, hp+detect. The hp+detect product was created to identify and supervise helicobacter pylori infection, which is the major cause of stomach and duodenal ulcers and a health risk for gastric cancer.

As a result, such occurrences are expected to propel market expansion in the region. The gender representation of H. pylori infection indicates a male predominance worldwide, with an estimated 62,500,000 male and approximately 56,900,000 female cases in the United States in 2021.

Why is Europe Considered a Lucrative Region for the Helicobacter Pylori Infections Treatment Market?

Europe is estimated to have the second-highest volume of H. pylori sales

Europe is expected to possess the second-largest H. pylori sales volume, with 30% revenue by 2022. The extensive use of antibiotics in several countries is an important factor. Furthermore, rising investments and the emergence of different major influencers are being assessed as potential drivers of market growth.

The European Helicobacter Pylori Infections Treatment market is forecast to be the second biggest. The growing number of patients seeking an early diagnosis of helicobacter pylori infection in order to avoid peptic ulcers is predicted to boost the market growth in the European region.

Based on the National Institute for Health Research, Helicobacter pylori is prevalent in most nations, along with North European communities, in which an estimated one-third of grownups are still contaminated, meanwhile, the incidence is higher than 50% in South America, Asia, and south and east Europe. Moreover, Helicobacter pylori are still prominent in immigrants from Helicobacter pylori-endemic European countries. These aspects are predicted to propel the global helicobacter pylori testing market in Europe forward.

Get the data you need at a Fraction of the cost

Personalize your report by choosing insights you need
and save 40%!

Category-Wise Insights

Which End-User Segment Will Account for Highest Revenue?

The diagnostic laboratories segment to grow at the fastest pace

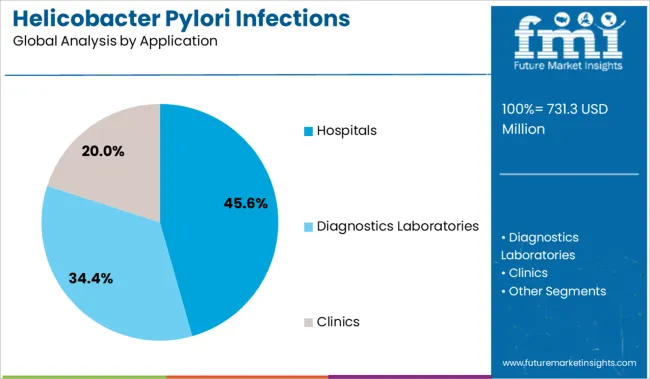
During the forecast period, the diagnostic laboratories segment is anticipated to expand at the fastest rate. The primary reasons for healthy growth are more specialized and effective infection identification, along with greater awareness of infectious diseases.

In regards to revenue, the hospitals and diagnostics laboratories segments were responsible for more than 82% of the industry in 2022.

Which Treatment Segment Will Generate the Highest Market Growth?

HDDT (high-dose dual therapy) segment to Grow Rapidly

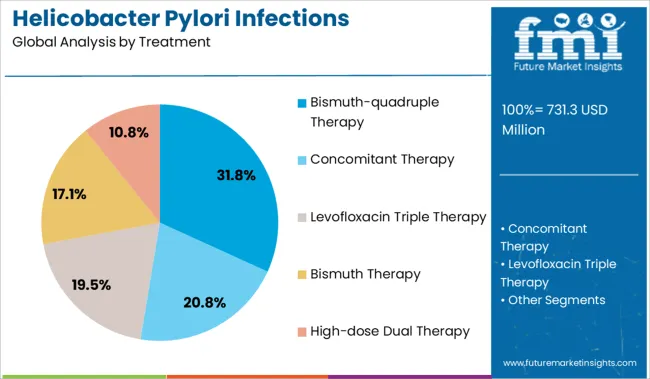
Bismuth quadruple therapy (BQT) is currently widely used to eliminate H pylori. High-dose dual therapy (HDDT) is an effective alternative diagnosis.

As per the latest analysis, both BQT and HDDT can achieve comparable elimination rates and adherence, with HDDT causing fewer side effects in general. As a result, these segments are expected to witness major market growth.

Start-ups offering Helicobacter Pylori Treatment

The growing number of start-ups in the Helicobacter Pylori Infections Treatment market has increased product quality and worldwide sales. Furthermore, in order to gain a competitive edge, new start-ups are operating on recent developments and releasing new products such as:
  • Sekisui Diagnostics (UK) Ltd was founded in 2010. Medical, surgical, ophthalmic, and veterinary devices and instruments are among the company's offerings. The company recently introduced the OSOM® H. pylori Test for the sensitive detection of H. pylori antibodies in serum, plasma, or whole blood as an aid in the diagnosis of H. pylori infection.
  • ImevaX is a biopharmaceutical company based in Munich, Germany that was established in 2014. Pylori DuoTect®, their solution, is an H. pylori Rapid Diagnostic Test that is available for use during a first-line assessment. Their test matches the precision of analytic gold standards like a biopsy, urea breath test (UBT), and stool test, with >98% responsivity and >91% precision.

Market Competition

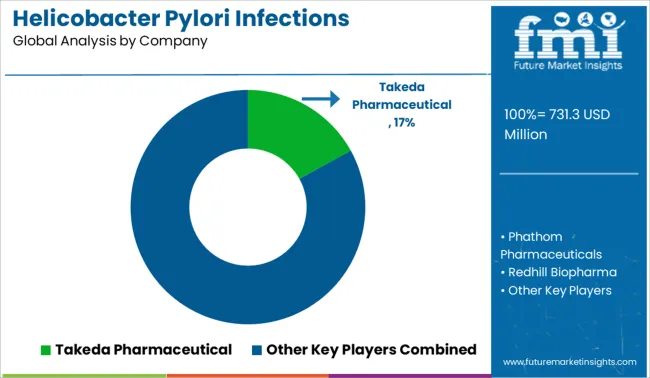
Key players in the helicobacter pylori infections treatment market are Takeda Pharmaceutical, AbbVie, Cumberland Pharmaceuticals, Eisai Co, Bio-Rad Laboratories, F. Hoffmann-La, Roche, Alpha Laboratories, Biohit, Biomerica, Inc., QuickNaviTM-H. pylori.

  • Biomerica, Inc. received CE Mark in May 2022 for its hp+detect diagnostic test for Helicobacter pylori bacteria. Following product registration in each country where it is sold, the business will begin marketing and selling its hp+detect diagnostic test in the European Union (EU) and other international countries.
  • QuickNaviTM-H.pylori, a Helicobacter pylori Quick Detection Kit, was introduced by Otsuka in April 2021. The immunochromatography technique is used by the diagnostic kit to verify the presence or absence of Helicobacter pylori antigens in a stool sample.
  • Bio-Rad launched Platelia H. Pylori IgG, an immuno-enzymatic assay for qualitative determination of IgG antibodies, in July 2022. Serology is a non-invasive, delicate, and straightforward technique for identifying H. pylori infection. The Platelia H. Pylori IgG immunoenzymatic assay is used to determine the quality of IgG antibodies.

Report Scope

Report Attribute

Details

Market Value in 2023

US$ 638.3 Million

Market Value in 2033

US$ 1,260 Million

Growth Rate

CAGR of 7.04% from 2023 to 2033

Base Year for Estimation

2022

Historical Data

2018 to 2022

Forecast Period

2023 to 2033

Quantitative Units

Revenue in US$ Million and CAGR from 2023 to 2033

Report Coverage

Revenue Forecast, Volume Forecast, Company Ranking, Competitive Landscape, Growth Factors, Trends, and Pricing Analysis

Segments Covered

  • Treatment
  • Application
  • Region

Regions Covered

  • North America
  • Latin America
  • Europe
  • Asia Pacific
  • Middle East & Africa (MEA)

Key Countries Profiled

  • The US
  • Canada
  • Brazil
  • Mexico
  • Mexico
  • Germany
  • The UK
  • France
  • Spain
  • Italy
  • China
  • Japan
  • South Korea
  • Singapore
  • Thailand
  • Indonesia
  • Australia
  • New Zealand
  • GCC
  • South Africa
  • Israel

Key Companies Profiled

  • Phathom Pharmaceuticals
  • Redhill Biopharma
  • Takeda Pharmaceuticals
  • AbbVie
  • Cumberland Pharmaceuticals
  • Eisai Co.
  • Bio-Rad Laboratories
  • F. Hoffmann-La Roche
  • Alpha Laboratories
  • Biohit

Customization

Available Upon Request

Key Segments Profiled in the Helicobacter Pylori Infections Treatment Market Industry Survey 

By Treatment :

  • Bismuth-quadruple Therapy
  • Concomitant Therapy
  • Levofloxacin Triple Therapy
  • Bismuth Therapy
  • High-dose Dual Therapy

By Application:

  • Hospitals
  • Diagnostics Laboratories
  • Clinics

By Region:

  • North America
  • Europe
  • Asia Pacific
  • Latin America
  • Middle East and Africa (MEA)

Frequently Asked Questions

What is the anticipated growth of the Helicobacter Pylori Infections Treatment market until 2033?

FMI projects the global Helicobacter Pylori Infections Treatment market to expand at a 7.04% value CAGR by 2033.

What is the estimated market value of the Helicobacter Pylori Infections Treatment market expected in 2023?

The global Helicobacter Pylori Infections Treatment market is estimated at a market value of US$ 638.3 Million.

What is the estimated market value of the Helicobacter Pylori Infections Treatment market expected in 2033?

The global Helicobacter Pylori Infections Treatment market is expected to garner a market value of US$ 1,260 Million.

Which region is forecast to be the most lucrative for Helicobacter Pylori Infections Treatment market growth?

FMI has projected North America to be one of the key regions for the Helicobacter Pylori Infections Treatment market.

Which are some prominent Helicobacter Pylori Infections Treatment manufacturers?

Takeda Pharmaceutical, AbbVie, Cumberland Pharmaceuticals, Eisai Co, Bio-Rad Laboratories, F. Hoffmann-La, Roche, Alpha Laboratories, Biohit, Biomerica, Inc., QuickNaviTM-H.pylori.

Table of Content

1. Executive Summary | Helicobacter Pylori Infections Treatment Market

    1.1. Global Market Outlook

    1.2. Demand-side Trends

    1.3. Supply-side Trends

    1.4. Technology Roadmap Analysis

    1.5. Analysis and Recommendations

2. Market Overview

    2.1. Market Coverage / Taxonomy

    2.2. Market Definition / Scope / Limitations

3. Market Background

    3.1. Market Dynamics

        3.1.1. Drivers

        3.1.2. Restraints

        3.1.3. Opportunity

        3.1.4. Trends

    3.2. Scenario Forecast

        3.2.1. Demand in Optimistic Scenario

        3.2.2. Demand in Likely Scenario

        3.2.3. Demand in Conservative Scenario

    3.3. Opportunity Map Analysis

    3.4. Investment Feasibility Matrix

    3.5. PESTLE and Porter’s Analysis

    3.6. Regulatory Landscape

        3.6.1. By Key Regions

        3.6.2. By Key Countries

    3.7. Regional Parent Market Outlook

4. Global Market Analysis 2018 to 2022 and Forecast, 2023 to 2033

    4.1. Historical Market Size Value (US$ Million) Analysis, 2018 to 2022

    4.2. Current and Future Market Size Value (US$ Million) Projections, 2023 to 2033

        4.2.1. Y-o-Y Growth Trend Analysis

        4.2.2. Absolute $ Opportunity Analysis

5. Global Market Analysis 2018 to 2022 and Forecast 2023 to 2033, By Treatment

    5.1. Introduction / Key Findings

    5.2. Historical Market Size Value (US$ Million) Analysis By Treatment, 2018 to 2022

    5.3. Current and Future Market Size Value (US$ Million) Analysis and Forecast By Treatment, 2023 to 2033

        5.3.1. Bismuth-quadruple Therapy

        5.3.2. Concomitant Therapy

        5.3.3. Levofloxacin Triple Therapy

        5.3.4. Bismuth Therapy

        5.3.5. High-dose Dual Therapy

    5.4. Y-o-Y Growth Trend Analysis By Treatment, 2018 to 2022

    5.5. Absolute $ Opportunity Analysis By Treatment, 2023 to 2033

6. Global Market Analysis 2018 to 2022 and Forecast 2023 to 2033, By Application

    6.1. Introduction / Key Findings

    6.2. Historical Market Size Value (US$ Million) Analysis By Application, 2018 to 2022

    6.3. Current and Future Market Size Value (US$ Million) Analysis and Forecast By Application, 2023 to 2033

        6.3.1. Hospitals

        6.3.2. Diagnostics Laboratories

        6.3.3. Clinics

    6.4. Y-o-Y Growth Trend Analysis By Application, 2018 to 2022

    6.5. Absolute $ Opportunity Analysis By Application, 2023 to 2033

7. Global Market Analysis 2018 to 2022 and Forecast 2023 to 2033, By Region

    7.1. Introduction

    7.2. Historical Market Size Value (US$ Million) Analysis By Region, 2018 to 2022

    7.3. Current Market Size Value (US$ Million) Analysis and Forecast By Region, 2023 to 2033

        7.3.1. North America

        7.3.2. Latin America

        7.3.3. Europe

        7.3.4. Asia Pacific

        7.3.5. Middle East & Africa (MEA)

    7.4. Market Attractiveness Analysis By Region

8. North America Market Analysis 2018 to 2022 and Forecast 2023 to 2033, By Country

    8.1. Historical Market Size Value (US$ Million) Trend Analysis By Market Taxonomy, 2018 to 2022

    8.2. Market Size Value (US$ Million) Forecast By Market Taxonomy, 2023 to 2033

        8.2.1. By Country

            8.2.1.1. The US

            8.2.1.2. Canada

        8.2.2. By Treatment

        8.2.3. By Application

    8.3. Market Attractiveness Analysis

        8.3.1. By Country

        8.3.2. By Treatment

        8.3.3. By Application

    8.4. Key Takeaways

9. Latin America Market Analysis 2018 to 2022 and Forecast 2023 to 2033, By Country

    9.1. Historical Market Size Value (US$ Million) Trend Analysis By Market Taxonomy, 2018 to 2022

    9.2. Market Size Value (US$ Million) Forecast By Market Taxonomy, 2023 to 2033

        9.2.1. By Country

            9.2.1.1. Brazil

            9.2.1.2. Mexico

            9.2.1.3. Rest of Latin America

        9.2.2. By Treatment

        9.2.3. By Application

    9.3. Market Attractiveness Analysis

        9.3.1. By Country

        9.3.2. By Treatment

        9.3.3. By Application

    9.4. Key Takeaways

10. Europe Market Analysis 2018 to 2022 and Forecast 2023 to 2033, By Country

    10.1. Historical Market Size Value (US$ Million) Trend Analysis By Market Taxonomy, 2018 to 2022

    10.2. Market Size Value (US$ Million) Forecast By Market Taxonomy, 2023 to 2033

        10.2.1. By Country

            10.2.1.1. Germany

            10.2.1.2. The UK

            10.2.1.3. France

            10.2.1.4. Spain

            10.2.1.5. Italy

            10.2.1.6. Rest of Europe

        10.2.2. By Treatment

        10.2.3. By Application

    10.3. Market Attractiveness Analysis

        10.3.1. By Country

        10.3.2. By Treatment

        10.3.3. By Application

    10.4. Key Takeaways

11. Asia Pacific Market Analysis 2018 to 2022 and Forecast 2023 to 2033, By Country

    11.1. Historical Market Size Value (US$ Million) Trend Analysis By Market Taxonomy, 2018 to 2022

    11.2. Market Size Value (US$ Million) Forecast By Market Taxonomy, 2023 to 2033

        11.2.1. By Country

            11.2.1.1. China

            11.2.1.2. Japan

            11.2.1.3. South Korea

            11.2.1.4. Singapore

            11.2.1.5. Thailand

            11.2.1.6. Indonesia

            11.2.1.7. Australia

            11.2.1.8. New Zealand

            11.2.1.9. Rest of Asia Pacific

        11.2.2. By Treatment

        11.2.3. By Application

    11.3. Market Attractiveness Analysis

        11.3.1. By Country

        11.3.2. By Treatment

        11.3.3. By Application

    11.4. Key Takeaways

12. MEA Market Analysis 2018 to 2022 and Forecast 2023 to 2033, By Country

    12.1. Historical Market Size Value (US$ Million) Trend Analysis By Market Taxonomy, 2018 to 2022

    12.2. Market Size Value (US$ Million) Forecast By Market Taxonomy, 2023 to 2033

        12.2.1. By Country

            12.2.1.1. GCC Countries

            12.2.1.2. South Africa

            12.2.1.3. Israel

            12.2.1.4. Rest of MEA

        12.2.2. By Treatment

        12.2.3. By Application

    12.3. Market Attractiveness Analysis

        12.3.1. By Country

        12.3.2. By Treatment

        12.3.3. By Application

    12.4. Key Takeaways

13. Key Countries Market Analysis

    13.1. The US.

        13.1.1. Pricing Analysis

        13.1.2. Market Share Analysis, 2022

            13.1.2.1. By Treatment

            13.1.2.2. By Application

    13.2. Canada

        13.2.1. Pricing Analysis

        13.2.2. Market Share Analysis, 2022

            13.2.2.1. By Treatment

            13.2.2.2. By Application

    13.3. Brazil

        13.3.1. Pricing Analysis

        13.3.2. Market Share Analysis, 2022

            13.3.2.1. By Treatment

            13.3.2.2. By Application

    13.4. Mexico

        13.4.1. Pricing Analysis

        13.4.2. Market Share Analysis, 2022

            13.4.2.1. By Treatment

            13.4.2.2. By Application

    13.5. Germany

        13.5.1. Pricing Analysis

        13.5.2. Market Share Analysis, 2022

            13.5.2.1. By Treatment

            13.5.2.2. By Application

    13.6. The UK

        13.6.1. Pricing Analysis

        13.6.2. Market Share Analysis, 2022

            13.6.2.1. By Treatment

            13.6.2.2. By Application

    13.7. France

        13.7.1. Pricing Analysis

        13.7.2. Market Share Analysis, 2022

            13.7.2.1. By Treatment

            13.7.2.2. By Application

    13.8. Spain

        13.8.1. Pricing Analysis

        13.8.2. Market Share Analysis, 2022

            13.8.2.1. By Treatment

            13.8.2.2. By Application

    13.9. Italy

        13.9.1. Pricing Analysis

        13.9.2. Market Share Analysis, 2022

            13.9.2.1. By Treatment

            13.9.2.2. By Application

    13.10. China

        13.10.1. Pricing Analysis

        13.10.2. Market Share Analysis, 2022

            13.10.2.1. By Treatment

            13.10.2.2. By Application

    13.11. Japan

        13.11.1. Pricing Analysis

        13.11.2. Market Share Analysis, 2022

            13.11.2.1. By Treatment

            13.11.2.2. By Application

    13.12. South Korea

        13.12.1. Pricing Analysis

        13.12.2. Market Share Analysis, 2022

            13.12.2.1. By Treatment

            13.12.2.2. By Application

    13.13. Singapore

        13.13.1. Pricing Analysis

        13.13.2. Market Share Analysis, 2022

            13.13.2.1. By Treatment

            13.13.2.2. By Application

    13.14. Thailand

        13.14.1. Pricing Analysis

        13.14.2. Market Share Analysis, 2022

            13.14.2.1. By Treatment

            13.14.2.2. By Application

    13.15. Indonesia

        13.15.1. Pricing Analysis

        13.15.2. Market Share Analysis, 2022

            13.15.2.1. By Treatment

            13.15.2.2. By Application

    13.16. Australia

        13.16.1. Pricing Analysis

        13.16.2. Market Share Analysis, 2022

            13.16.2.1. By Treatment

            13.16.2.2. By Application

    13.17. New Zealand

        13.17.1. Pricing Analysis

        13.17.2. Market Share Analysis, 2022

            13.17.2.1. By Treatment

            13.17.2.2. By Application

    13.18. GCC Countries

        13.18.1. Pricing Analysis

        13.18.2. Market Share Analysis, 2022

            13.18.2.1. By Treatment

            13.18.2.2. By Application

    13.19. South Africa

        13.19.1. Pricing Analysis

        13.19.2. Market Share Analysis, 2022

            13.19.2.1. By Treatment

            13.19.2.2. By Application

    13.20. Israel

        13.20.1. Pricing Analysis

        13.20.2. Market Share Analysis, 2022

            13.20.2.1. By Treatment

            13.20.2.2. By Application

14. Market Structure Analysis

    14.1. Competition Dashboard

    14.2. Competition Benchmarking

    14.3. Market Share Analysis of Top Players

        14.3.1. By Regional

        14.3.2. By Treatment

        14.3.3. By Application

15. Competition Analysis

    15.1. Competition Deep Dive

        15.1.1. Phathom Pharmaceuticals

            15.1.1.1. Overview

            15.1.1.2. Product Portfolio

            15.1.1.3. Profitability by Market Segments

            15.1.1.4. Sales Footprint

            15.1.1.5. Strategy Overview

                15.1.1.5.1. Marketing Strategy

        15.1.2. Redhill Biopharma

            15.1.2.1. Overview

            15.1.2.2. Product Portfolio

            15.1.2.3. Profitability by Market Segments

            15.1.2.4. Sales Footprint

            15.1.2.5. Strategy Overview

                15.1.2.5.1. Marketing Strategy

        15.1.3. Takeda Pharmaceutical

            15.1.3.1. Overview

            15.1.3.2. Product Portfolio

            15.1.3.3. Profitability by Market Segments

            15.1.3.4. Sales Footprint

            15.1.3.5. Strategy Overview

                15.1.3.5.1. Marketing Strategy

        15.1.4. AbbVie

            15.1.4.1. Overview

            15.1.4.2. Product Portfolio

            15.1.4.3. Profitability by Market Segments

            15.1.4.4. Sales Footprint

            15.1.4.5. Strategy Overview

                15.1.4.5.1. Marketing Strategy

        15.1.5. Cumberland Pharmaceuticals

            15.1.5.1. Overview

            15.1.5.2. Product Portfolio

            15.1.5.3. Profitability by Market Segments

            15.1.5.4. Sales Footprint

            15.1.5.5. Strategy Overview

                15.1.5.5.1. Marketing Strategy

        15.1.6. Eisai Co

            15.1.6.1. Overview

            15.1.6.2. Product Portfolio

            15.1.6.3. Profitability by Market Segments

            15.1.6.4. Sales Footprint

            15.1.6.5. Strategy Overview

                15.1.6.5.1. Marketing Strategy

        15.1.7. Bio-Rad Laboratories

            15.1.7.1. Overview

            15.1.7.2. Product Portfolio

            15.1.7.3. Profitability by Market Segments

            15.1.7.4. Sales Footprint

            15.1.7.5. Strategy Overview

                15.1.7.5.1. Marketing Strategy

        15.1.8. F. Hoffmann-La Roche

            15.1.8.1. Overview

            15.1.8.2. Product Portfolio

            15.1.8.3. Profitability by Market Segments

            15.1.8.4. Sales Footprint

            15.1.8.5. Strategy Overview

                15.1.8.5.1. Marketing Strategy

        15.1.9. Alpha Laboratories

            15.1.9.1. Overview

            15.1.9.2. Product Portfolio

            15.1.9.3. Profitability by Market Segments

            15.1.9.4. Sales Footprint

            15.1.9.5. Strategy Overview

                15.1.9.5.1. Marketing Strategy

        15.1.10. Biohit

            15.1.10.1. Overview

            15.1.10.2. Product Portfolio

            15.1.10.3. Profitability by Market Segments

            15.1.10.4. Sales Footprint

            15.1.10.5. Strategy Overview

                15.1.10.5.1. Marketing Strategy

16. Assumptions & Acronyms Used

17. Research Methodology

List of Tables

Table 1: Global Market Value (US$ Million) Forecast by Region, 2018 to 2033

Table 2: Global Market Value (US$ Million) Forecast by Treatment, 2018 to 2033

Table 3: Global Market Value (US$ Million) Forecast by Application, 2018 to 2033

Table 4: North America Market Value (US$ Million) Forecast by Country, 2018 to 2033

Table 5: North America Market Value (US$ Million) Forecast by Treatment, 2018 to 2033

Table 6: North America Market Value (US$ Million) Forecast by Application, 2018 to 2033

Table 7: Latin America Market Value (US$ Million) Forecast by Country, 2018 to 2033

Table 8: Latin America Market Value (US$ Million) Forecast by Treatment, 2018 to 2033

Table 9: Latin America Market Value (US$ Million) Forecast by Application, 2018 to 2033

Table 10: Europe Market Value (US$ Million) Forecast by Country, 2018 to 2033

Table 11: Europe Market Value (US$ Million) Forecast by Treatment, 2018 to 2033

Table 12: Europe Market Value (US$ Million) Forecast by Application, 2018 to 2033

Table 13: Asia Pacific Market Value (US$ Million) Forecast by Country, 2018 to 2033

Table 14: Asia Pacific Market Value (US$ Million) Forecast by Treatment, 2018 to 2033

Table 15: Asia Pacific Market Value (US$ Million) Forecast by Application, 2018 to 2033

Table 16: MEA Market Value (US$ Million) Forecast by Country, 2018 to 2033

Table 17: MEA Market Value (US$ Million) Forecast by Treatment, 2018 to 2033

Table 18: MEA Market Value (US$ Million) Forecast by Application, 2018 to 2033

List of Charts

Figure 1: Global Market Value (US$ Million) by Treatment, 2023 to 2033

Figure 2: Global Market Value (US$ Million) by Application, 2023 to 2033

Figure 3: Global Market Value (US$ Million) by Region, 2023 to 2033

Figure 4: Global Market Value (US$ Million) Analysis by Region, 2018 to 2033

Figure 5: Global Market Value Share (%) and BPS Analysis by Region, 2023 to 2033

Figure 6: Global Market Y-o-Y Growth (%) Projections by Region, 2023 to 2033

Figure 7: Global Market Value (US$ Million) Analysis by Treatment, 2018 to 2033

Figure 8: Global Market Value Share (%) and BPS Analysis by Treatment, 2023 to 2033

Figure 9: Global Market Y-o-Y Growth (%) Projections by Treatment, 2023 to 2033

Figure 10: Global Market Value (US$ Million) Analysis by Application, 2018 to 2033

Figure 11: Global Market Value Share (%) and BPS Analysis by Application, 2023 to 2033

Figure 12: Global Market Y-o-Y Growth (%) Projections by Application, 2023 to 2033

Figure 13: Global Market Attractiveness by Treatment, 2023 to 2033

Figure 14: Global Market Attractiveness by Application, 2023 to 2033

Figure 15: Global Market Attractiveness by Region, 2023 to 2033

Figure 16: North America Market Value (US$ Million) by Treatment, 2023 to 2033

Figure 17: North America Market Value (US$ Million) by Application, 2023 to 2033

Figure 18: North America Market Value (US$ Million) by Country, 2023 to 2033

Figure 19: North America Market Value (US$ Million) Analysis by Country, 2018 to 2033

Figure 20: North America Market Value Share (%) and BPS Analysis by Country, 2023 to 2033

Figure 21: North America Market Y-o-Y Growth (%) Projections by Country, 2023 to 2033

Figure 22: North America Market Value (US$ Million) Analysis by Treatment, 2018 to 2033

Figure 23: North America Market Value Share (%) and BPS Analysis by Treatment, 2023 to 2033

Figure 24: North America Market Y-o-Y Growth (%) Projections by Treatment, 2023 to 2033

Figure 25: North America Market Value (US$ Million) Analysis by Application, 2018 to 2033

Figure 26: North America Market Value Share (%) and BPS Analysis by Application, 2023 to 2033

Figure 27: North America Market Y-o-Y Growth (%) Projections by Application, 2023 to 2033

Figure 28: North America Market Attractiveness by Treatment, 2023 to 2033

Figure 29: North America Market Attractiveness by Application, 2023 to 2033

Figure 30: North America Market Attractiveness by Country, 2023 to 2033

Figure 31: Latin America Market Value (US$ Million) by Treatment, 2023 to 2033

Figure 32: Latin America Market Value (US$ Million) by Application, 2023 to 2033

Figure 33: Latin America Market Value (US$ Million) by Country, 2023 to 2033

Figure 34: Latin America Market Value (US$ Million) Analysis by Country, 2018 to 2033

Figure 35: Latin America Market Value Share (%) and BPS Analysis by Country, 2023 to 2033

Figure 36: Latin America Market Y-o-Y Growth (%) Projections by Country, 2023 to 2033

Figure 37: Latin America Market Value (US$ Million) Analysis by Treatment, 2018 to 2033

Figure 38: Latin America Market Value Share (%) and BPS Analysis by Treatment, 2023 to 2033

Figure 39: Latin America Market Y-o-Y Growth (%) Projections by Treatment, 2023 to 2033

Figure 40: Latin America Market Value (US$ Million) Analysis by Application, 2018 to 2033

Figure 41: Latin America Market Value Share (%) and BPS Analysis by Application, 2023 to 2033

Figure 42: Latin America Market Y-o-Y Growth (%) Projections by Application, 2023 to 2033

Figure 43: Latin America Market Attractiveness by Treatment, 2023 to 2033

Figure 44: Latin America Market Attractiveness by Application, 2023 to 2033

Figure 45: Latin America Market Attractiveness by Country, 2023 to 2033

Figure 46: Europe Market Value (US$ Million) by Treatment, 2023 to 2033

Figure 47: Europe Market Value (US$ Million) by Application, 2023 to 2033

Figure 48: Europe Market Value (US$ Million) by Country, 2023 to 2033

Figure 49: Europe Market Value (US$ Million) Analysis by Country, 2018 to 2033

Figure 50: Europe Market Value Share (%) and BPS Analysis by Country, 2023 to 2033

Figure 51: Europe Market Y-o-Y Growth (%) Projections by Country, 2023 to 2033

Figure 52: Europe Market Value (US$ Million) Analysis by Treatment, 2018 to 2033

Figure 53: Europe Market Value Share (%) and BPS Analysis by Treatment, 2023 to 2033

Figure 54: Europe Market Y-o-Y Growth (%) Projections by Treatment, 2023 to 2033

Figure 55: Europe Market Value (US$ Million) Analysis by Application, 2018 to 2033

Figure 56: Europe Market Value Share (%) and BPS Analysis by Application, 2023 to 2033

Figure 57: Europe Market Y-o-Y Growth (%) Projections by Application, 2023 to 2033

Figure 58: Europe Market Attractiveness by Treatment, 2023 to 2033

Figure 59: Europe Market Attractiveness by Application, 2023 to 2033

Figure 60: Europe Market Attractiveness by Country, 2023 to 2033

Figure 61: Asia Pacific Market Value (US$ Million) by Treatment, 2023 to 2033

Figure 62: Asia Pacific Market Value (US$ Million) by Application, 2023 to 2033

Figure 63: Asia Pacific Market Value (US$ Million) by Country, 2023 to 2033

Figure 64: Asia Pacific Market Value (US$ Million) Analysis by Country, 2018 to 2033

Figure 65: Asia Pacific Market Value Share (%) and BPS Analysis by Country, 2023 to 2033

Figure 66: Asia Pacific Market Y-o-Y Growth (%) Projections by Country, 2023 to 2033

Figure 67: Asia Pacific Market Value (US$ Million) Analysis by Treatment, 2018 to 2033

Figure 68: Asia Pacific Market Value Share (%) and BPS Analysis by Treatment, 2023 to 2033

Figure 69: Asia Pacific Market Y-o-Y Growth (%) Projections by Treatment, 2023 to 2033

Figure 70: Asia Pacific Market Value (US$ Million) Analysis by Application, 2018 to 2033

Figure 71: Asia Pacific Market Value Share (%) and BPS Analysis by Application, 2023 to 2033

Figure 72: Asia Pacific Market Y-o-Y Growth (%) Projections by Application, 2023 to 2033

Figure 73: Asia Pacific Market Attractiveness by Treatment, 2023 to 2033

Figure 74: Asia Pacific Market Attractiveness by Application, 2023 to 2033

Figure 75: Asia Pacific Market Attractiveness by Country, 2023 to 2033

Figure 76: MEA Market Value (US$ Million) by Treatment, 2023 to 2033

Figure 77: MEA Market Value (US$ Million) by Application, 2023 to 2033

Figure 78: MEA Market Value (US$ Million) by Country, 2023 to 2033

Figure 79: MEA Market Value (US$ Million) Analysis by Country, 2018 to 2033

Figure 80: MEA Market Value Share (%) and BPS Analysis by Country, 2023 to 2033

Figure 81: MEA Market Y-o-Y Growth (%) Projections by Country, 2023 to 2033

Figure 82: MEA Market Value (US$ Million) Analysis by Treatment, 2018 to 2033

Figure 83: MEA Market Value Share (%) and BPS Analysis by Treatment, 2023 to 2033

Figure 84: MEA Market Y-o-Y Growth (%) Projections by Treatment, 2023 to 2033

Figure 85: MEA Market Value (US$ Million) Analysis by Application, 2018 to 2033

Figure 86: MEA Market Value Share (%) and BPS Analysis by Application, 2023 to 2033

Figure 87: MEA Market Y-o-Y Growth (%) Projections by Application, 2023 to 2033

Figure 88: MEA Market Attractiveness by Treatment, 2023 to 2033

Figure 89: MEA Market Attractiveness by Application, 2023 to 2033

Figure 90: MEA Market Attractiveness by Country, 2023 to 2033

Recommendations

Healthcare

Bacterial Diagnostics in Aquaculture Market

Published : August 2023

Healthcare

Antibacterial Haemostatic Gels Market

Published : April 2023

Healthcare

Helicobacter Pylori Non-Invasive Testing Market

Published : November 2022

Healthcare

Helicobacter Pylori Testing Market

Published : July 2022

Explore Healthcare Insights

View Reports

Helicobacter Pylori Infections Treatment Market