Helicobacter Pylori Testing Market
Market Insights on Helicobacter Pylori Testing covering sales outlook, demand forecast & up-to-date key trends
Helicobacter Pylori Testing Market By Test Type, End User & Region - Forecast 2022 – 2032
Helicobacter Pylori Testing Market Outlook (2022-2032)
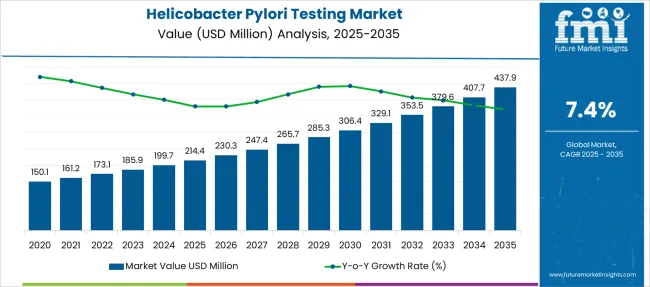
[301 Pages Report] The global helicobacter pylori testing market is expected to accumulate US$ 173.1 Million in value by 2022-end. During the forecast period ranging from 2022 to 2032, a CAGR worth 7.4% has been projected for the market, with an expected closing value worth US$ 380.3 Million. During the 2016-2021 historical period, the industry grew at a value CAGR worth 6.2%.
“Growing awareness of immunodiagnostics in developed countries like United States & Germany and increasing product approvals boost the demand for Helicobacter Pylori Testing.”
Attributes |
Key Statistics |
Global Helicobacter Pylori Testing Market CAGR (2022-2032) |
7.4% |
Anticipated Market Value (2022) |
US$ 173.1 Million |
Global Helicobacter Pylori Testing Market (2032) |
US$ 380.3 Million |
Global Helicobacter Pylori Testing Market Attraction |
People's growing awareness of immunodiagnostics, rapid advances in technology and innovation, and increasing product approvals are anticipated to propel the global helicobacter pylori testing market forward. |
Helicobacter pylori testing is used to diagnose Helicobacter pylori infections in the upper small intestine and stomach. The helicobacter pylori test is also used to evaluate treatment efficacy. Peptic ulcers, stomach (gastric) cancer, and chronic gastritis can all be caused by helicobacter pylori.
Helicobacter pylori testing is used to determine whether a helicobacter pylori infection is causing an ulcer. There are various types of helicobacter pylori testing obtainable. Some of them require a stool or breath sample, while others are more invasive and require a tissue sample obtained via endoscopy.
The bacteria Helicobacter pylori grows in the digestive tract and has a proclivity to attack the stomach lining. Helicobacter pylori infections are usually harmless, but they are responsible for the vast majority of the small intestine and stomach ulcers. Because it is the most common illness in humans, early detection is critical. According to CDC research, Helicobacter pylori causes more than 90% of duodenal ulcers and up to 80% of gastric ulcers.
Let us know your requirement to get
100% FREE customization
What are the Factors Propelling the Global Helicobacter Pylori Testing Market?
The global helicobacter pylori testing industry is poised to increase consistently over the forecast period due to an aging population and an increase in the prevalence of infectious diseases and gastritis. People's growing awareness of immunodiagnostics, rapid advances in technology and innovation, and increasing product approvals are anticipated to propel the global helicobacter pylori testing market forward.
The advancement of newer innovations to enhance accuracy and precision has stemmed from a preference for non-invasive testing. Furthermore, non-invasive tests allow for multiple sample screenings at the same time, which a?ects its acceptance rate. Reduced time, reduction of other infections during invasive testing, and less severe pain will all encourage more people to use non-invasive testing.
What are the Factors Hampering the Global Helicobacter Pylori Testing Market?
However, high test costs and a lack of awareness about helicobacter pylori testing are major factors restricting the growth of the global helicobacter pylori testing market.
Furthermore, underdeveloped and developing countries face challenges related to a lack of healthcare resources. This results in limited access to healthcare services with insufficient facilities, which increases the likelihood of a lack of knowledge about such diseases and their diagnosis.
Find your sweet spots for generating winning opportunities in this market.
Talk to AnalystWhy is North America Emerging as an Opportunistic Helicobacter Pylori Testing Market?
The market for Helicobacter pylori testing in North America is expected to take a turn for the better, attributed to the growing prevalence of H. pylori infections, rising awareness about disease diagnosis and treatment, and government initiatives to eradicate the incidence of infections.
The bacteria pose a high risk of stomach cancer, contributing to the existing disease burden, and are thus bound to grow the associated incidence and mortality among African Americans in the United States. Furthermore, advances in diagnostic technology and the inclusion of advanced healthcare infrastructure will fuel the country's growth. According to Future Market Insights, North America is likely to account for a 36.4% market share as of 2022.
According to the National Institute of Diabetes and Digestive and Kidney Diseases (NIDDK), approximately half of people over the age of 60 and 20% of people under the age of 40 are infected with Helicobacter Pylori in the United States. Furthermore, technological advancements in Helicobacter pylori diagnostics, as well as the presence of a well-established healthcare infrastructure, are fuelling the market's growth to a large extent.
Why is the Demand for Helicobacter Pylori Testing Burgeoning in Europe?
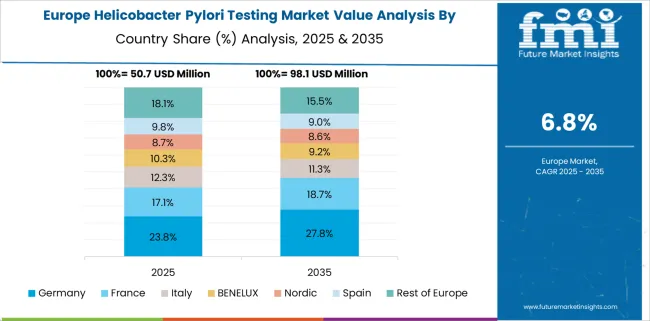
Europe is thought to have the second-largest H. pylori testing market share, accumulating 32% revenue as of 2022. An important factor is the widespread utilization of antibiotics in many countries. In addition, rising investments and the presence of various key players are being evaluated to drive market growth.
The European market for helicobacter pylori testing is expected to be the second largest. The increasing patient pool intent on early detection of helicobacter pylori infection to avoid peptic ulcers is expected to aid market growth in the European region.
The role of H pylori in gastritis, peptic ulcers, and gastric cancer is now established, but research currently underway into possible associations with cardiovascular disease and several other conditions could guarantee a massive market in Europe for H pylori diagnostic tests and antimicrobial eradication therapy.
According to the National Institute for Health Research, the ubiquity of Helicobacter pylori is intense in most countries, including North European populations, where approximately one-third of adults are still infected, whereas, in South America, Asia, and south and east Europe, the prevalence is greater than 50%. Furthermore, Helicobacter pylori remain highly prevalent in immigrants from Helicobacter pylori-endemic countries in Europe. These factors are anticipated to propel the global helicobacter pylori testing market forward in Europe.

A unified Market Research Subscription Platform, built for today's disparate research needs.
How Start-ups are Adding Value to the Global Helicobacter Pylori Testing Market
The swelling dispersion of start-ups in the Helicobacter Pylori Testing market has improved the product quality and expanded global sales. Besides, to gain a competitive edge, new start-ups are working on innovative developments and launching new products such as:
- In 2010, Sekisui Diagnostics (UK) Ltd was established. The company's product line includes medical, surgical, ophthalmic, and veterinary instruments and apparatus. OSOM® H. pylori Test For the qualitative detection of H. pylori antibodies in serum, plasma, or whole blood as an aid in the diagnosis of H. pylori infection was recently launched by the company.
Who are the Key Players in the Global Helicobacter Pylori Testing Packaging Market?
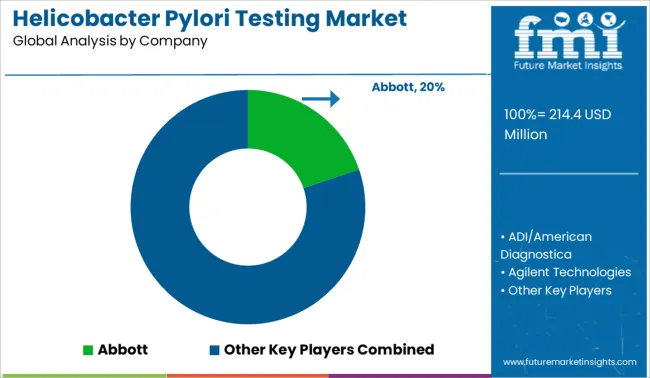
Some key players in the Helicobacter Pylori Testing packaging market are Abbott, ADI/American Diagnostica, Agilent Technologies, Bio-Rad Laboratories, Inc., Helena Laboratories, Horiba, Takara Bio, EKF Diagnostics, Exalenz Bioscience Ltd. and Sekisui Diagnostics, LLC. Key development in the Helicobacter Pylori Testing Packaging market is as follows:
- Horiba launched the Horiba ABX Micros ESV 60 Hematology Analyzer in November 2021, which is the Gold Standard of Veterinary Hematology Testing for 11 animal species.
In July 2022, Bio Rad released Platelia H. pylori IgG, an immuno-enzymatic assay for qualitative determination of IgG antibodies. Serology provides a non-invasive, sensitive, and simple method for determining H. pylori infection. Platelia H. pylori IgG is an immunoenzymatic assay for determining the quality of IgG antibodies.
Report Scope
Report Attribute |
Details |
Growth Rate |
CAGR of 7.4% from 2022 to 2032 |
Market Value in 2022 |
US$ 173.1 Million |
Market Value in 2032 |
US$ 380.3 Million |
Base Year for Estimation |
2021 |
Historical Period |
2016-2021 |
Forecast Period |
2022-2032 |
Quantitative Units |
Revenue in US$ Million and CAGR from 2022-2032 |
Report Coverage |
Revenue Forecast, Company Ranking, Competitive Landscape, Growth Factors, Trends, and Pricing Analysis |
Segments Covered |
|
Regions Covered |
|
Key Countries Profiled |
|
Key Companies Profiled |
|
Customization |
Available Upon Request |
Key Segments Covered in the Helicobacter Pylori Testing Industry Survey
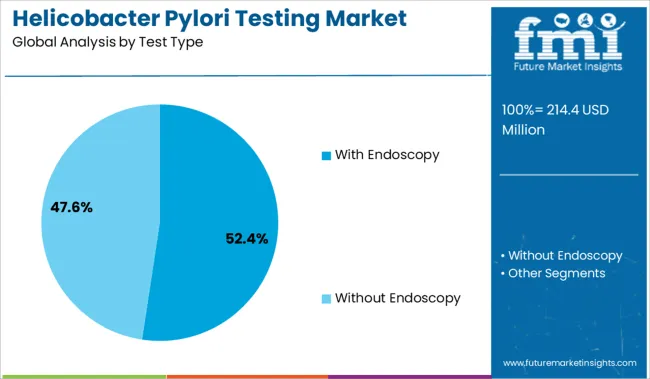
Helicobacter Pylori Testing Market by Test Type:
- Helicobacter Pylori Testing with Endoscopy
- Histology
- Rapid Urease Testing
- PCR (Polymerase Chain Reaction)
- Culture Testing
- Helicobacter Pylori Testing without Endoscopy
- Stool/Faecal Antigen Test
- Urea Breath Test
- H. Pylori Antibody Testing
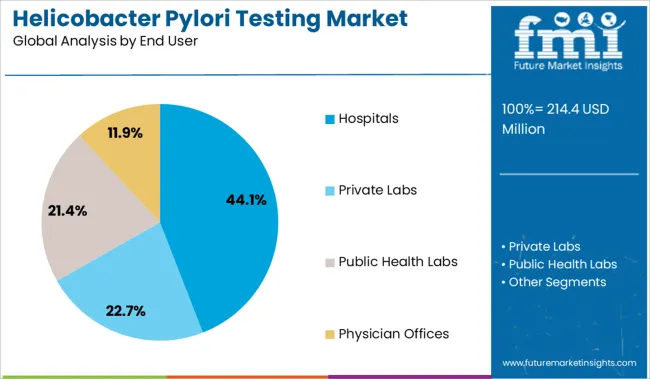
Helicobacter Pylori Testing Market by End User:
- Helicobacter Pylori Testing in Hospitals
- Helicobacter Pylori Testing in Private Labs
- Helicobacter Pylori Testing in Public Health Labs
- Helicobacter Pylori Testing in Physician Offices
Helicobacter Pylori Testing Market by Region:
- North America Helicobacter Pylori Testing Market
- Latin America Helicobacter Pylori Testing Market
- Europe Helicobacter Pylori Testing Market
- Asia Pacific Helicobacter Pylori Testing Market
- Middle East & Africa Helicobacter Pylori Testing Market
Frequently Asked Questions
What is the estimated market value of the helicobacter pylori testing market in 2022?
The global helicobacter pylori testing market is likely to value at US$ 173.1 Million in 2022.
What is the projected CAGR of the helicobacter pylori testing market until 2032?
The helicobacter pylori testing market is estimated to grow at a CAGR of 7.4% from 2022 to 2032.
What is the expected market value of the global helicobacter pylori testing market by 2032?
The helicobacter pylori testing market is predicted to procure US$ 380.3 Million by 2032.
Table of Content
1. Executive Summary 1.1. Global Market Outlook 1.2. Demand-side Trends 1.3. Supply-side Trends 1.4. Technology Roadmap Analysis 1.5. Analysis and Recommendations 2. Market Overview 2.1. Market Coverage / Taxonomy 2.2. Market Definition / Scope / Limitations 3. Market Background 3.1. Market Dynamics 3.1.1. Drivers 3.1.2. Restraints 3.1.3. Opportunity 3.1.4. Trends 3.2. Scenario Forecast 3.2.1. Demand in Optimistic Scenario 3.2.2. Demand in Likely Scenario 3.2.3. Demand in Conservative Scenario 3.3. Opportunity Map Analysis 3.4. Investment Feasibility Matrix 3.5. PESTLE and Porter’s Analysis 3.6. Regulatory Landscape 3.6.1. By Key Regions 3.6.2. By Key Countries 3.7. Regional Parent Market Outlook 4. Global Market Analysis 2016-2021 and Forecast, 2022-2032 4.1. Historical Market Size Value (US$ Mn) Analysis, 2017-2021 4.2. Current and Future Market Size Value (US$ Mn) Projections, 2022-2032 4.2.1. Y-o-Y Growth Trend Analysis 4.2.2. Absolute $ Opportunity Analysis 5. Global Market Analysis 2016-2021 and Forecast 2022-2032, By Test Type 5.1. Introduction / Key Findings 5.2. Historical Market Size Value (US$ Mn) Analysis By Test Type, 2017-2021 5.3. Current and Future Market Size Value (US$ Mn) Analysis and Forecast By Test Type, 2022-2032 5.3.1. With Endoscopy 5.3.2. Histology 5.3.3. Rapid Urease Testing 5.3.4. Culture 5.3.5. PCR (Polymerase Chain Reaction) 5.3.6. Without Endoscopy 5.3.7. Stool/Faecal Antigen Test 5.3.8. Urea Breath Test 5.3.9. H. Pylori Antibody Testing 5.4. Y-o-Y Growth Trend Analysis By Test Type, 2017-2021 5.5. Absolute $ Opportunity Analysis By Test Type, 2022-2032 6. Global Market Analysis 2016-2021 and Forecast 2022-2032, By End User 6.1. Introduction / Key Findings 6.2. Historical Market Size Value (US$ Mn) Analysis By End User, 2017-2021 6.3. Current and Future Market Size Value (US$ Mn) Analysis and Forecast By End User, 2022-2032 6.3.1. Hospitals 6.3.2. Private Labs 6.3.3. Public Health Labs 6.3.4. Physician Offices 6.4. Y-o-Y Growth Trend Analysis By End User, 2017-2021 6.5. Absolute $ Opportunity Analysis By End User, 2022-2032 7. Global Market Analysis 2016-2021 and Forecast 2022-2032, By Region 7.1. Introduction 7.2. Historical Market Size Value (US$ Mn) Analysis By Region, 2017-2021 7.3. Current Market Size Value (US$ Mn) Analysis and Forecast By Region, 2022-2032 7.3.1. North America 7.3.2. Latin America 7.3.3. Europe 7.3.4. Asia Pacific 7.3.5. MEA 7.4. Market Attractiveness Analysis By Region 8. North America Market Analysis 2016-2021 and Forecast 2022-2032, By Country 8.1. Historical Market Size Value (US$ Mn) Trend Analysis By Market Taxonomy, 2017-2021 8.2. Market Size Value (US$ Mn) Forecast By Market Taxonomy, 2022-2032 8.2.1. By Country 8.2.1.1. U.S. 8.2.1.2. Canada 8.2.2. By Test Type 8.2.3. By End User 8.3. Market Attractiveness Analysis 8.3.1. By Country 8.3.2. By Test Type 8.3.3. By End User 8.4. Key Takeaways 9. Latin America Market Analysis 2016-2021 and Forecast 2022-2032, By Country 9.1. Historical Market Size Value (US$ Mn) Trend Analysis By Market Taxonomy, 2017-2021 9.2. Market Size Value (US$ Mn) Forecast By Market Taxonomy, 2022-2032 9.2.1. By Country 9.2.1.1. Brazil 9.2.1.2. Mexico 9.2.1.3. Rest of Latin America 9.2.2. By Test Type 9.2.3. By End User 9.3. Market Attractiveness Analysis 9.3.1. By Country 9.3.2. By Test Type 9.3.3. By End User 9.4. Key Takeaways 10. Europe Market Analysis 2016-2021 and Forecast 2022-2032, By Country 10.1. Historical Market Size Value (US$ Mn) Trend Analysis By Market Taxonomy, 2017-2021 10.2. Market Size Value (US$ Mn) Forecast By Market Taxonomy, 2022-2032 10.2.1. By Country 10.2.1.1. Germany 10.2.1.2. U.K. 10.2.1.3. France 10.2.1.4. Spain 10.2.1.5. Italy 10.2.1.6. Rest of Europe 10.2.2. By Test Type 10.2.3. By End User 10.3. Market Attractiveness Analysis 10.3.1. By Country 10.3.2. By Test Type 10.3.3. By End User 10.4. Key Takeaways 11. Asia Pacific Market Analysis 2016-2021 and Forecast 2022-2032, By Country 11.1. Historical Market Size Value (US$ Mn) Trend Analysis By Market Taxonomy, 2017-2021 11.2. Market Size Value (US$ Mn) Forecast By Market Taxonomy, 2022-2032 11.2.1. By Country 11.2.1.1. China 11.2.1.2. Japan 11.2.1.3. South Korea 11.2.1.4. India 11.2.1.5. Malaysia 11.2.1.6. Singapore 11.2.1.7. Australia 11.2.1.8. New Zealand 11.2.1.9. Rest of APAC 11.2.2. By Test Type 11.2.3. By End User 11.3. Market Attractiveness Analysis 11.3.1. By Country 11.3.2. By Test Type 11.3.3. By End User 11.4. Key Takeaways 12. MEA Market Analysis 2016-2021 and Forecast 2022-2032, By Country 12.1. Historical Market Size Value (US$ Mn) Trend Analysis By Market Taxonomy, 2017-2021 12.2. Market Size Value (US$ Mn) Forecast By Market Taxonomy, 2022-2032 12.2.1. By Country 12.2.1.1. GCC Countries 12.2.1.2. South Africa 12.2.1.3. Israel 12.2.1.4. Rest of MEA 12.2.2. By Test Type 12.2.3. By End User 12.3. Market Attractiveness Analysis 12.3.1. By Country 12.3.2. By Test Type 12.3.3. By End User 12.4. Key Takeaways 13. Key Countries Market Analysis 13.1. U.S. 13.1.1. Pricing Analysis 13.1.2. Market Share Analysis, 2021 13.1.2.1. By Test Type 13.1.2.2. By End User 13.2. Canada 13.2.1. Pricing Analysis 13.2.2. Market Share Analysis, 2021 13.2.2.1. By Test Type 13.2.2.2. By End User 13.3. Brazil 13.3.1. Pricing Analysis 13.3.2. Market Share Analysis, 2021 13.3.2.1. By Test Type 13.3.2.2. By End User 13.4. Mexico 13.4.1. Pricing Analysis 13.4.2. Market Share Analysis, 2021 13.4.2.1. By Test Type 13.4.2.2. By End User 13.5. Germany 13.5.1. Pricing Analysis 13.5.2. Market Share Analysis, 2021 13.5.2.1. By Test Type 13.5.2.2. By End User 13.6. U.K. 13.6.1. Pricing Analysis 13.6.2. Market Share Analysis, 2021 13.6.2.1. By Test Type 13.6.2.2. By End User 13.7. France 13.7.1. Pricing Analysis 13.7.2. Market Share Analysis, 2021 13.7.2.1. By Test Type 13.7.2.2. By End User 13.8. Spain 13.8.1. Pricing Analysis 13.8.2. Market Share Analysis, 2021 13.8.2.1. By Test Type 13.8.2.2. By End User 13.9. Italy 13.9.1. Pricing Analysis 13.9.2. Market Share Analysis, 2021 13.9.2.1. By Test Type 13.9.2.2. By End User 13.10. China 13.10.1. Pricing Analysis 13.10.2. Market Share Analysis, 2021 13.10.2.1. By Test Type 13.10.2.2. By End User 13.11. Japan 13.11.1. Pricing Analysis 13.11.2. Market Share Analysis, 2021 13.11.2.1. By Test Type 13.11.2.2. By End User 13.12. South Korea 13.12.1. Pricing Analysis 13.12.2. Market Share Analysis, 2021 13.12.2.1. By Test Type 13.12.2.2. By End User 13.13. Malaysia 13.13.1. Pricing Analysis 13.13.2. Market Share Analysis, 2021 13.13.2.1. By Test Type 13.13.2.2. By End User 13.14. Singapore 13.14.1. Pricing Analysis 13.14.2. Market Share Analysis, 2021 13.14.2.1. By Test Type 13.14.2.2. By End User 13.15. Australia 13.15.1. Pricing Analysis 13.15.2. Market Share Analysis, 2021 13.15.2.1. By Test Type 13.15.2.2. By End User 13.16. New Zealand 13.16.1. Pricing Analysis 13.16.2. Market Share Analysis, 2021 13.16.2.1. By Test Type 13.16.2.2. By End User 13.17. GCC Countries 13.17.1. Pricing Analysis 13.17.2. Market Share Analysis, 2021 13.17.2.1. By Test Type 13.17.2.2. By End User 13.18. South Africa 13.18.1. Pricing Analysis 13.18.2. Market Share Analysis, 2021 13.18.2.1. By Test Type 13.18.2.2. By End User 13.19. Israel 13.19.1. Pricing Analysis 13.19.2. Market Share Analysis, 2021 13.19.2.1. By Test Type 13.19.2.2. By End User 14. Market Structure Analysis 14.1. Competition Dashboard 14.2. Competition Benchmarking 14.3. Market Share Analysis of Top Players 14.3.1. By Regional 14.3.2. By Test Type 14.3.3. By End User 15. Competition Analysis 15.1. Competition Deep Dive 15.1.1. Abbott 15.1.1.1. Overview 15.1.1.2. Product Portfolio 15.1.1.3. Profitability by Market Segments 15.1.1.4. Sales Footprint 15.1.1.5. Strategy Overview 15.1.1.5.1. Marketing Strategy 15.1.2. ADI/American Diagnostica 15.1.2.1. Overview 15.1.2.2. Product Portfolio 15.1.2.3. Profitability by Market Segments 15.1.2.4. Sales Footprint 15.1.2.5. Strategy Overview 15.1.2.5.1. Marketing Strategy 15.1.3. Agilent Technologies 15.1.3.1. Overview 15.1.3.2. Product Portfolio 15.1.3.3. Profitability by Market Segments 15.1.3.4. Sales Footprint 15.1.3.5. Strategy Overview 15.1.3.5.1. Marketing Strategy 15.1.4. Bio-Rad Laboratories Inc. 15.1.4.1. Overview 15.1.4.2. Product Portfolio 15.1.4.3. Profitability by Market Segments 15.1.4.4. Sales Footprint 15.1.4.5. Strategy Overview 15.1.4.5.1. Marketing Strategy 15.1.5. Helena Laboratories 15.1.5.1. Overview 15.1.5.2. Product Portfolio 15.1.5.3. Profitability by Market Segments 15.1.5.4. Sales Footprint 15.1.5.5. Strategy Overview 15.1.5.5.1. Marketing Strategy 15.1.6. Horiba 15.1.6.1. Overview 15.1.6.2. Product Portfolio 15.1.6.3. Profitability by Market Segments 15.1.6.4. Sales Footprint 15.1.6.5. Strategy Overview 15.1.6.5.1. Marketing Strategy 15.1.7. Takara Bio 15.1.7.1. Overview 15.1.7.2. Product Portfolio 15.1.7.3. Profitability by Market Segments 15.1.7.4. Sales Footprint 15.1.7.5. Strategy Overview 15.1.7.5.1. Marketing Strategy 15.1.8. EKF Diagnostics 15.1.8.1. Overview 15.1.8.2. Product Portfolio 15.1.8.3. Profitability by Market Segments 15.1.8.4. Sales Footprint 15.1.8.5. Strategy Overview 15.1.8.5.1. Marketing Strategy 15.1.9. Exalenz Bioscience Ltd. 15.1.9.1. Overview 15.1.9.2. Product Portfolio 15.1.9.3. Profitability by Market Segments 15.1.9.4. Sales Footprint 15.1.9.5. Strategy Overview 15.1.9.5.1. Marketing Strategy 15.1.10. Sekisui Diagnostics 15.1.10.1. Overview 15.1.10.2. Product Portfolio 15.1.10.3. Profitability by Market Segments 15.1.10.4. Sales Footprint 15.1.10.5. Strategy Overview 15.1.10.5.1. Marketing Strategy 16. Assumptions & Acronyms Used 17. Research Methodology
Let us know your requirement to get
100% FREE customization
List of Tables
Table 1: Global Market Value (US$ Mn) Forecast by Region, 2016-2032 Table 2: Global Market Value (US$ Mn) Forecast by Test Type, 2016-2032 Table 3: Global Market Value (US$ Mn) Forecast by End User, 2016-2032 Table 4: North America Market Value (US$ Mn) Forecast by Country, 2016-2032 Table 5: North America Market Value (US$ Mn) Forecast by Test Type, 2016-2032 Table 6: North America Market Value (US$ Mn) Forecast by End User, 2016-2032 Table 7: Latin America Market Value (US$ Mn) Forecast by Country, 2016-2032 Table 8: Latin America Market Value (US$ Mn) Forecast by Test Type, 2016-2032 Table 9: Latin America Market Value (US$ Mn) Forecast by End User, 2016-2032 Table 10: Europe Market Value (US$ Mn) Forecast by Country, 2016-2032 Table 11: Europe Market Value (US$ Mn) Forecast by Test Type, 2016-2032 Table 12: Europe Market Value (US$ Mn) Forecast by End User, 2016-2032 Table 13: Asia Pacific Market Value (US$ Mn) Forecast by Country, 2016-2032 Table 14: Asia Pacific Market Value (US$ Mn) Forecast by Test Type, 2016-2032 Table 15: Asia Pacific Market Value (US$ Mn) Forecast by End User, 2016-2032 Table 16: MEA Market Value (US$ Mn) Forecast by Country, 2016-2032 Table 17: MEA Market Value (US$ Mn) Forecast by Test Type, 2016-2032 Table 18: MEA Market Value (US$ Mn) Forecast by End User, 2016-2032
Find your sweet spots for generating winning opportunities in this market.
Talk to AnalystList of Charts
Figure 1: Global Market Value (US$ Mn) by Test Type, 2022-2032 Figure 2: Global Market Value (US$ Mn) by End User, 2022-2032 Figure 3: Global Market Value (US$ Mn) by Region, 2022-2032 Figure 4: Global Market Value (US$ Mn) Analysis by Region, 2016-2032 Figure 5: Global Market Value Share (%) and BPS Analysis by Region, 2022-2032 Figure 6: Global Market Y-o-Y Growth (%) Projections by Region, 2022-2032 Figure 7: Global Market Value (US$ Mn) Analysis by Test Type, 2016-2032 Figure 8: Global Market Value Share (%) and BPS Analysis by Test Type, 2022-2032 Figure 9: Global Market Y-o-Y Growth (%) Projections by Test Type, 2022-2032 Figure 10: Global Market Value (US$ Mn) Analysis by End User, 2016-2032 Figure 11: Global Market Value Share (%) and BPS Analysis by End User, 2022-2032 Figure 12: Global Market Y-o-Y Growth (%) Projections by End User, 2022-2032 Figure 13: Global Market Attractiveness by Test Type, 2022-2032 Figure 14: Global Market Attractiveness by End User, 2022-2032 Figure 15: Global Market Attractiveness by Region, 2022-2032 Figure 16: North America Market Value (US$ Mn) by Test Type, 2022-2032 Figure 17: North America Market Value (US$ Mn) by End User, 2022-2032 Figure 18: North America Market Value (US$ Mn) by Country, 2022-2032 Figure 19: North America Market Value (US$ Mn) Analysis by Country, 2016-2032 Figure 20: North America Market Value Share (%) and BPS Analysis by Country, 2022-2032 Figure 21: North America Market Y-o-Y Growth (%) Projections by Country, 2022-2032 Figure 22: North America Market Value (US$ Mn) Analysis by Test Type, 2016-2032 Figure 23: North America Market Value Share (%) and BPS Analysis by Test Type, 2022-2032 Figure 24: North America Market Y-o-Y Growth (%) Projections by Test Type, 2022-2032 Figure 25: North America Market Value (US$ Mn) Analysis by End User, 2016-2032 Figure 26: North America Market Value Share (%) and BPS Analysis by End User, 2022-2032 Figure 27: North America Market Y-o-Y Growth (%) Projections by End User, 2022-2032 Figure 28: North America Market Attractiveness by Test Type, 2022-2032 Figure 29: North America Market Attractiveness by End User, 2022-2032 Figure 30: North America Market Attractiveness by Country, 2022-2032 Figure 31: Latin America Market Value (US$ Mn) by Test Type, 2022-2032 Figure 32: Latin America Market Value (US$ Mn) by End User, 2022-2032 Figure 33: Latin America Market Value (US$ Mn) by Country, 2022-2032 Figure 34: Latin America Market Value (US$ Mn) Analysis by Country, 2016-2032 Figure 35: Latin America Market Value Share (%) and BPS Analysis by Country, 2022-2032 Figure 36: Latin America Market Y-o-Y Growth (%) Projections by Country, 2022-2032 Figure 37: Latin America Market Value (US$ Mn) Analysis by Test Type, 2016-2032 Figure 38: Latin America Market Value Share (%) and BPS Analysis by Test Type, 2022-2032 Figure 39: Latin America Market Y-o-Y Growth (%) Projections by Test Type, 2022-2032 Figure 40: Latin America Market Value (US$ Mn) Analysis by End User, 2016-2032 Figure 41: Latin America Market Value Share (%) and BPS Analysis by End User, 2022-2032 Figure 42: Latin America Market Y-o-Y Growth (%) Projections by End User, 2022-2032 Figure 43: Latin America Market Attractiveness by Test Type, 2022-2032 Figure 44: Latin America Market Attractiveness by End User, 2022-2032 Figure 45: Latin America Market Attractiveness by Country, 2022-2032 Figure 46: Europe Market Value (US$ Mn) by Test Type, 2022-2032 Figure 47: Europe Market Value (US$ Mn) by End User, 2022-2032 Figure 48: Europe Market Value (US$ Mn) by Country, 2022-2032 Figure 49: Europe Market Value (US$ Mn) Analysis by Country, 2016-2032 Figure 50: Europe Market Value Share (%) and BPS Analysis by Country, 2022-2032 Figure 51: Europe Market Y-o-Y Growth (%) Projections by Country, 2022-2032 Figure 52: Europe Market Value (US$ Mn) Analysis by Test Type, 2016-2032 Figure 53: Europe Market Value Share (%) and BPS Analysis by Test Type, 2022-2032 Figure 54: Europe Market Y-o-Y Growth (%) Projections by Test Type, 2022-2032 Figure 55: Europe Market Value (US$ Mn) Analysis by End User, 2016-2032 Figure 56: Europe Market Value Share (%) and BPS Analysis by End User, 2022-2032 Figure 57: Europe Market Y-o-Y Growth (%) Projections by End User, 2022-2032 Figure 58: Europe Market Attractiveness by Test Type, 2022-2032 Figure 59: Europe Market Attractiveness by End User, 2022-2032 Figure 60: Europe Market Attractiveness by Country, 2022-2032 Figure 61: Asia Pacific Market Value (US$ Mn) by Test Type, 2022-2032 Figure 62: Asia Pacific Market Value (US$ Mn) by End User, 2022-2032 Figure 63: Asia Pacific Market Value (US$ Mn) by Country, 2022-2032 Figure 64: Asia Pacific Market Value (US$ Mn) Analysis by Country, 2016-2032 Figure 65: Asia Pacific Market Value Share (%) and BPS Analysis by Country, 2022-2032 Figure 66: Asia Pacific Market Y-o-Y Growth (%) Projections by Country, 2022-2032 Figure 67: Asia Pacific Market Value (US$ Mn) Analysis by Test Type, 2016-2032 Figure 68: Asia Pacific Market Value Share (%) and BPS Analysis by Test Type, 2022-2032 Figure 69: Asia Pacific Market Y-o-Y Growth (%) Projections by Test Type, 2022-2032 Figure 70: Asia Pacific Market Value (US$ Mn) Analysis by End User, 2016-2032 Figure 71: Asia Pacific Market Value Share (%) and BPS Analysis by End User, 2022-2032 Figure 72: Asia Pacific Market Y-o-Y Growth (%) Projections by End User, 2022-2032 Figure 73: Asia Pacific Market Attractiveness by Test Type, 2022-2032 Figure 74: Asia Pacific Market Attractiveness by End User, 2022-2032 Figure 75: Asia Pacific Market Attractiveness by Country, 2022-2032 Figure 76: MEA Market Value (US$ Mn) by Test Type, 2022-2032 Figure 77: MEA Market Value (US$ Mn) by End User, 2022-2032 Figure 78: MEA Market Value (US$ Mn) by Country, 2022-2032 Figure 79: MEA Market Value (US$ Mn) Analysis by Country, 2016-2032 Figure 80: MEA Market Value Share (%) and BPS Analysis by Country, 2022-2032 Figure 81: MEA Market Y-o-Y Growth (%) Projections by Country, 2022-2032 Figure 82: MEA Market Value (US$ Mn) Analysis by Test Type, 2016-2032 Figure 83: MEA Market Value Share (%) and BPS Analysis by Test Type, 2022-2032 Figure 84: MEA Market Y-o-Y Growth (%) Projections by Test Type, 2022-2032 Figure 85: MEA Market Value (US$ Mn) Analysis by End User, 2016-2032 Figure 86: MEA Market Value Share (%) and BPS Analysis by End User, 2022-2032 Figure 87: MEA Market Y-o-Y Growth (%) Projections by End User, 2022-2032 Figure 88: MEA Market Attractiveness by Test Type, 2022-2032 Figure 89: MEA Market Attractiveness by End User, 2022-2032 Figure 90: MEA Market Attractiveness by Country, 2022-2032
Need specific information?
Request CustomizationExplore Healthcare Insights
View Reports