Reports

- Global Locations -

Headquarters

Future Market Insights, Inc.

Christiana Corporate, 200
Continental Drive, Suite 401,
Newark, Delaware - 19713,
United States

T: +1-845-579-5705

Americas

Future Market Insights, Inc.

616 Corporate Way, Suite 2-9018,
Valley Cottage, NY 10989, United States

T: +1-347-918-3531

MEA

Future Market Insights

1602-6 Jumeirah Bay X2 Tower, Plot No: JLT-PH2-X2A,
Jumeirah Lakes Towers, Dubai,
United Arab Emirates

Europe

Future Market Insights

3rd Floor, 207 Regent Street,
W1B 3HH London
United Kingdom

T: + 44 (0) 20 8123 9659
D: +44 (0) 20 3287 4268

Asia Pacific

Future Market Insights

IndiaLand Global Tech Park, Unit UG-1, Behind Grand HighStreet, Phase 1, Hinjawadi, MH, Pune – 411057, India

Helium Gas Market Outlook (2022 to 2032)

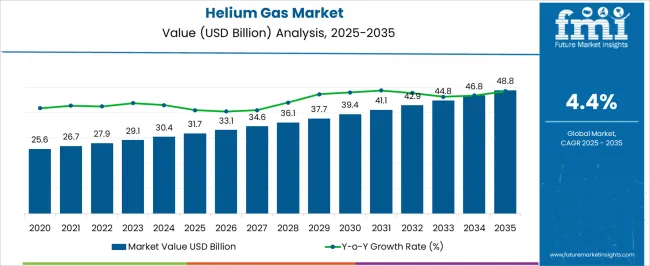
[220 Pages Report] The global helium gas market is forecast to reach a valuation of US$ 2.8 Billion in 2022. With demand growing at a 5.1% CAGR, the market size is expected to reach US$ 4.6 Billion by 2032. The growing adoption of helium gas for metal fabrication across various industries such as automotive and electric and electronics will boost sales in the market in the forthcoming years.

Helium gas is an inert gas that finds applications in various industries. It acts as a shielding agent in metal fabrication, making it an ideal element in comparison to other rare gases.

Further, helium gas is increasingly being incorporated into the electronics sector. Liquid helium is used to cool magnets in semiconductors used in various electronics and appliances.

Attributes Details
Helium Gas Market Base Year Value (2021A) US$ 2.7 Billion
Helium Gas Market Estimated Year Value (2022E) US$ 2.8 Billion
Helium Gas Market Projected Year Value (2032F) US$ 4.6 Billion
Helium Gas Market Value-based CAGR (2022 to 2032) 5.1%
Helium Gas Market Collective Value Share: Top 3 Countries Worldwide (2022E) 89.5%

As per FMI, sales of helium gas are projected to grow year-over-year by 4.6% in 2022. Increasing adoption in different applications such as metal inert gas welding, magnetic imaging instrument (MRI), adjunct therapy in many respiratory ailments, and semiconductor manufacturing is expected to boost the demand over the forecast period.

Total demand for helium gas is anticipated to hold more than 75% of the market share of the global rare gas market.

Don't pay for what you don't need

Customize your report by selecting specific countries or regions and save 30%!

2017 to 2021 Helium Gas Market Historic Outlook Compared to 2022 to 2032 Forecast

The demand for helium gas grew at a 2.1% CAGR between 2017 and 2021. As per the report, sales are forecast to increase at a 5.1% CAGR over the forecast period.

Helium gas offers benefits such as low density, boiling point and solubility, high thermal conductivity, and inertness which makes it an ideal element for healthcare and metal fabrication applications.

Helium Gas Market

Increasing demand for helium gas applications in the healthcare sector such as magnetic imaging instruments (MRI) and various adjunct therapies in respiratory ailments is expected to boost the market in the forthcoming years.

What is Driving the Sales of Helium Gas in the Healthcare Sector?

Favorable physical and chemical characteristics such as high thermal conductivity, low solubility, and low density are driving applications of helium gas in the healthcare sector. Helium gas is biologically inert, and its neuroprotective capabilities make it effective for adjunct therapy in many respiratory diseases such as asthma exacerbation, ARDS, COPD, bronchiolitis, and croup.

Magnetic resonant imaging (MRI) machine operates using helium gas. In an MRI machine, there are many coils of wire which conduct electricity. Helium is used to cool the coil of wire and it helps to drop the resistance of the wire close to zero.

It creates a strong magnetic field in the MRI machine. Helium Ion Microscopy is a recently discovered application in MRI radiology and imaging of organs. Such developments are expected to create opportunities for growth for helium gas manufacturers.

Nikhil Kaitwade
Nikhil Kaitwade

Principal Consultant

Talk to Analyst

Find your sweet spots for generating winning opportunities in this market.

What Are the Prospects of Helium Gas in The Metal Fabrication Industry?

Consumption of helium gas is increasing in the metal fabrication industry as it is an inert gas, which is lighter than air, has high ionization potential and it does not react with other gases when exposed to other substances.

Owing to these factors, helium gas is mainly used for all types of electric welding such as TIG, MIG, MAG, PLASMA, and LASER welding. Helium demonstrated a high thermal conductivity, allowing it to be used in higher heat input welding applications.

Increasing demand for thin sheet metal and related products in industries such as aeronautics, medical, industrial, construction, manufacturing, and automotive will continue driving sales of helium gas over the forecast period.

Which Factors are Restricting Sales of Helium Gas?

Helium is the second most abundant element on the earth but it’s hard to capture and reserve. Owing to this reason, helium storage and supply might restrict demand for helium gas in the forthcoming years.

In addition to this, Russia is the world’s third helium-producing country. However, various countries have cut off the financial flows over its invasion of Ukraine. Furthermore, the Amur Helium plant in Russia is taken down as the natural gas processing plant experienced a fire that will delay Amur’s Helium Production.

This is expected to limit the supply of helium gas from Russia in 2022. Moreover, helium has a high cost of extraction, and the transportation of helium is difficult. It requires complex tanks that have a doubled-walled pressure container with multilayer vacuum insulation, which might limit sales in the market.

Get the data you need at a Fraction of the cost

Personalize your report by choosing insights you need
and save 40%!

Country-wise Insights

What Will Be the Demand Outlook in the USA Helium Gas Market?

Surging Demand for Helium Gas Cylinders in the USA will Steer Growth

Total sales of helium gas in the USA market are forecast to reach a valuation of US$ 816 Million by 2032, accounting for a dominant share of the North American helium gas market. Increasing demand for helium gas from industries such as healthcare, electronics, and metal fabrication will augment the growth in the USA market.

In addition to this, the rapid adoption of technologically advanced digital devices and instruments such as NMR and MRI machines are spurring the demand for helium gas. NMR and MRI machines need a continuous supply of liquid helium to keep them running.

Liquid helium helps to keep the coil cool to ensure electron flow without any resistance. Further, the demand for helium gas in the electronics sector is growing due to its usage in electronics and semiconductors. The surging adoption of electronic devices in IT firms in the USA will create opportunities for growth for helium gas manufacturers.

What is Driving the China Helium Gas Market?

Increasing Sales of Compressed Helium in China Will Augment Growth

As per FMI, total sales of helium gas in China are slated to reach a valuation of US$ 1.1 Billion by 2032, leading the East Asia helium gas market over the forecast period. The ongoing expansion of the electronics sector in China due to the growing demand for 3G telecommunication, IoT, automotive electronics, medical electronics, and industrial electronics is boosting sales of helium gas.

Category-wise Insights

Which is the Leading Application of Helium Gas?

Demand for Helium Gas for Semiconductors to Remain High

In terms of applications, sales of helium gas in the electronic segment will reach a valuation of US$ 404 Million by 2032. Helium gas is a frictionless fluid and has the ability to produce auditory sensations. This is driving its applications in global positioning systems (GPS).

For instance, helium gas manufacturers are investing in research and development to improve global positioning systems in airplanes and submarines by using helium gas. The research is funded by the National Aeronautics and space administration (NASA).

GPS technology is used in a variety of applications including road, aviation, marine, and location-based services. Many enterprises use location-based data for advertising to target customers.

Increasing demand for smartphones and GPS-enabled vehicles such as space shuttles that navigate using GPS, tractors in the agricultural sector, and airplanes is expected to create opportunities for growth in the global helium market.

Competitive Landscape

Key helium gas manufacturers are strengthening their positions in the market by expanding their production capacities. They are focusing on acquisition and expansion strategies to increase revenue. For instance:

  • Grand Gulf Energy entered into a collaboration with helium refiner and seller Paradox Resources to increase the production of helium gas.
  • Paradox Resources acquired the Lisbon Valley helium plant in Utah which is capable of producing high purity 99.99% helium.
  • Air Products has started up the world's largest storage cavern in Texas. It confirms that it holds the right to helium storage with a long-term service agreement.

Scope of Report

Attributes Details
Forecast Period 2022 to 2032
Historical Data Available for 2017 to 2021
Market Analysis US$ Million for Value and Tons for Volume
Key Countries Covered USA, Canada, Brazil, Mexico, Germany, Italy, France, UK, Spain, Russia, Poland, China, Japan, South Korea, India, ASEAN, Australia and New Zealand, GCC Countries, Turkey, and South Africa.
Key Segments Covered Supply Mode, Applications & Region
Key Companies Profiled
  • Air Liquide
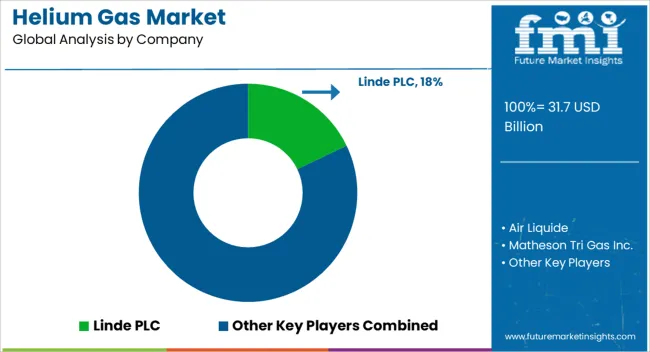
  • Linde PLC
  • Matheson Tri Gas Inc
  • Air Products and Chemical Inc.
  • Air Gas INC.
  • The Messer Group GMBH
  • Cryoin Engineering Ltd.
  • Chengdu Taiyu Industrial Gases Co. Ltd.
  • Paradox
  • Grand Gulf Energy
Report Coverage Market Forecast, Company Share Analysis, Competition Intelligence, Drivers, Restraints, Opportunities and Threats Analysis, Market Dynamics and Challenges, and Strategic Growth Initiatives
Customization & Pricing Available upon Request

Helium Gas Market by Category

By Supply Mode:

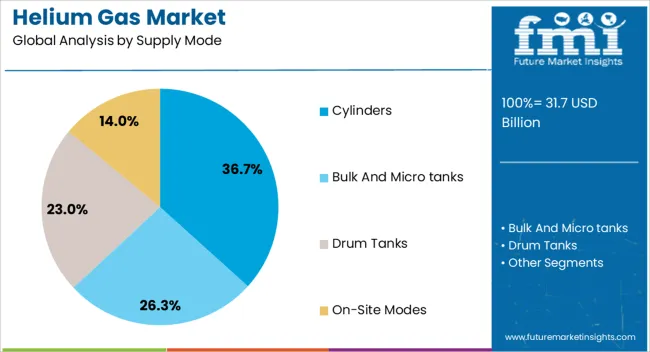
  • Cylinders
  • Bulk and Micro tanks
  • Drum tank
  • On-site

By Application:

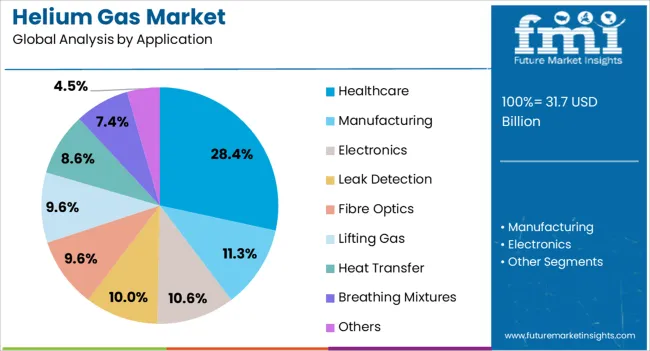
  • Healthcare
  • Manufacturing
  • Electronics
  • Leak Detection
  • Fibre Optics
  • Lifting Gas
  • Heat Transfer
  • Breathing Mixtures
  • Others

By Region:

  • North America
  • Latin America
  • Europe
  • East Asia
  • South Asia & Pacific
  • Middle East & Africa

Frequently Asked Questions

What is the current helium gas market value?

The helium gas market is anticipated to reach a valuation of US$ 2.8 Billion in 2022.

What is the demand outlook for helium gas?

The helium gas market is anticipated to witness a growth at a 5.1% CAGR over the forecast period.

At what rate did the helium gas market grow between 2017 and 2021?

The helium gas market grew at a 4.4% CAGR between 2017 and 2021.

Who are the leading players in the helium gas market?

Air Liquide, Linde PLC, Matheson Tri gas Inc,Air Products and Chemical Inc., Air Gas INC.,The Messer Group GMBH, Cryoin Engineering Ltd., Chengdu Taiyu Industrial Gases Co. Ltd., Paradox, Grand Gulf Energy, and others are the leading players in the helium gas market.

Which are the top countries driving demand for helium gas?

The USA, China, and India are the top countries driving demand for helium gas.

Table of Content

1. Executive Summary | Helium Gas Market

    1.1. Global Market Outlook

    1.2. Demand Side Trends

    1.3. Supply Side Trends

    1.4. Technology Roadmap

    1.5. Analysis and Recommendations

2. Market Overview

    2.1. Market Coverage / Taxonomy

    2.2. Market Definition / Scope / Limitations

3. Key Market Trends

    3.1. Key Trends Impacting the Market

    3.2. Product Innovation / Development Trends

4. Key Success Factors

    4.1. Product Adoption / Usage Analysis

    4.2. Product USPs / Features

    4.3. Strategic Promotional Strategies

5. Global Market Demand Analysis 2017 to 2021 and Forecast, 2022 to 2032

    5.1. Historical Market Volume (Tons) Analysis, 2017 to 2021

    5.2. Current and Future Market Volume (Tons) Projections, 2022 to 2032

    5.3. Y-o-Y Growth Trend Analysis

6. Global Market - Pricing Analysis

    6.1. Regional Pricing Analysis

    6.2. Pricing Break-up

        6.2.1. Manufacturer-Level Pricing

        6.2.2. Distributor Level Pricing

    6.3. Global Average Pricing Analysis Benchmark

7. Global Market Demand (in Value or Size in US$ Billion) Analysis 2017 to 2021 and Forecast, 2022 to 2032

    7.1. Historical Market Value (US$ Billion) Analysis, 2017 to 2021

    7.2. Current and Future Market Value (US$ Billion) Projections, 2022 to 2032

        7.2.1. Y-o-Y Growth Trend Analysis

        7.2.2. Absolute $ Opportunity Analysis

8. Market Background

    8.1. Macro-Economic Factors

    8.2. Forecast Factors - Relevance & Impact

    8.3. Value Chain

        8.3.1. List of Manufacturers

        8.3.2. List of Probable End Users

        8.3.3. Average Margins

    8.4. COVID-19 Crisis - Impact Assessment

        8.4.1. Current Statistics

        8.4.2. Short-Mid-Long Term Outlook

        8.4.3. Likely Rebound

    8.5. Market Dynamics

        8.5.1. Drivers

        8.5.2. Restraints

        8.5.3. Opportunity Analysis

    8.6. Global Supply Demand Analysis

    8.7. Buyers Decision Analysis

    8.8. Trade Statistics

    8.9. Porters Five Forces Analysis

9. Global Market Analysis 2017 to 2021 and Forecast 2022 to 2032, by Supply Mode 

    9.1. Introduction / Key Findings

    9.2. Historical Market Size (US$ Billion) and Volume Analysis By Supply Mode, 2017 to 2021

    9.3. Current and Future Market Size (US$ Billion) and Volume Analysis and Forecast By Supply Mode, 2022 to 2032

        9.3.1. Cylinders

        9.3.2. Bulk & Micro Bulk

        9.3.3. Drum Tanks

        9.3.4. On-Site

    9.4. Market Attractiveness Analysis By Supply Mode

10. Global Market Analysis 2017 to 2021 and Forecast 2022 to 2032, by Application

    10.1. Introduction / Key Findings

    10.2. Historical Market Size (US$ Billion) and Volume Analysis By Application, 2017 to 2021

    10.3. Current and Future Market Size (US$ Billion) and Volume Analysis and Forecast By Application, 2022 to 2032

        10.3.1. Healthcare

        10.3.2. Manufacturing

        10.3.3. Electronics

        10.3.4. Leak Detection

        10.3.5. Fiber Optics

        10.3.6. Lifting Gas

        10.3.7. Heat Transfer

        10.3.8. Breathing Mixture

        10.3.9. Others

    10.4. Market Attractiveness Analysis By Application

11. Global Market Analysis 2017 to 2021 and Forecast 2022 to 2032, by Region

    11.1. Introduction

    11.2. Historical Market Size (US$ Billion) and Volume Analysis By Region, 2017 to 2021

    11.3. Current Market Size (US$ Billion) and Volume Analysis and Forecast By Region, 2022 to 2032

        11.3.1. North America

        11.3.2. Latin America

        11.3.3. Europe

        11.3.4. South Asia and Pacific

        11.3.5. East Asia

        11.3.6. Middle East & Africa

    11.4. Market Attractiveness Analysis By Region

12. North America Market Analysis 2017 to 2021 and Forecast 2022 to 2032

    12.1. Introduction

    12.2. Pricing Analysis

    12.3. Historical Market Size (US$ Billion) and Volume Trend Analysis By Market Taxonomy, 2017 to 2021

    12.4. Market Size (US$ Billion) and Volume Forecast By Market Taxonomy, 2022 to 2032

        12.4.1. By Country

            12.4.1.1.United States of America

            12.4.1.2. Canada

        12.4.2. By Supply Mode

        12.4.3. By Application

    12.5. Market Attractiveness Analysis

        12.5.1. By Country

        12.5.2. By Supply Mode

        12.5.3. By Application

    12.6. Market Trends

    12.7. Key Market Participants - Intensity Mapping

    12.8. Drivers and Restraints - Impact Analysis

13. Latin America Market Analysis 2017 to 2021 and Forecast 2022 to 2032

    13.1. Introduction

    13.2. Pricing Analysis

    13.3. Historical Market Size (US$ Billion) and Volume Trend Analysis By Market Taxonomy, 2017 to 2021

    13.4. Market Size (US$ Billion) and Volume Forecast By Market Taxonomy, 2022 to 2032

        13.4.1. By Country

            13.4.1.1. Brazil

            13.4.1.2. Mexico

            13.4.1.3. Rest of Latin America

        13.4.2. By Supply Mode

        13.4.3. By Application

    13.5. Market Attractiveness Analysis

        13.5.1. By Country

        13.5.2. By Supply Mode

        13.5.3. By Application

    13.6. Market Trends

    13.7. Key Market Participants - Intensity Mapping

    13.8. Drivers and Restraints - Impact Analysis

14. Europe Market Analysis 2017 to 2021 and Forecast 2022 to 2032

    14.1. Introduction

    14.2. Pricing Analysis

    14.3. Historical Market Size (US$ Billion) and Volume Trend Analysis By Market Taxonomy, 2017 to 2021

    14.4. Market Size (US$ Billion) and Volume Forecast By Market Taxonomy, 2022 to 2032

        14.4.1. By Country

            14.4.1.1. Germany

            14.4.1.2. Italy

            14.4.1.3. France

            14.4.1.4. United Kingdom

            14.4.1.5. Spain

            14.4.1.6. Poland

            14.4.1.7. Russia

            14.4.1.8. Rest of Europe

        14.4.2. By Supply Mode

        14.4.3. By Application

    14.5. Market Attractiveness Analysis

        14.5.1. By Country

        14.5.2. By Supply Mode

        14.5.3. By Application

    14.6. Market Trends

    14.7. Key Market Participants - Intensity Mapping

    14.8. Drivers and Restraints - Impact Analysis

15. South Asia and Pacific Market Analysis 2017 to 2021 and Forecast 2022 to 2032

    15.1. Introduction

    15.2. Pricing Analysis

    15.3. Historical Market Size (US$ Billion) and Volume Trend Analysis By Market Taxonomy, 2017 to 2021

    15.4. Market Size (US$ Billion) and Volume Forecast By Market Taxonomy, 2022 to 2032

        15.4.1. By Country

            15.4.1.1. India

            15.4.1.2. ASEAN

            15.4.1.3. Australia and New Zealand

            15.4.1.4. Rest of South Asia & Pacific

        15.4.2. By Supply Mode

        15.4.3. By Application

    15.5. Market Attractiveness Analysis

        15.5.1. By Country

        15.5.2. By Supply Mode

        15.5.3. By Application

    15.6. Market Trends

    15.7. Key Market Participants - Intensity Mapping

    15.8. Drivers and Restraints - Impact Analysis

16. East Asia Market Analysis 2017 to 2021 and Forecast 2022 to 2032

    16.1. Introduction

    16.2. Pricing Analysis

    16.3. Historical Market Size (US$ Billion) and Volume Trend Analysis By Market Taxonomy, 2017 to 2021

    16.4. Market Size (US$ Billion) and Volume Forecast By Market Taxonomy, 2022 to 2032

        16.4.1. By Country

            16.4.1.1. China

            16.4.1.2. Japan

            16.4.1.3. South Korea

        16.4.2. By Supply Mode

        16.4.3. By Application

    16.5. Market Attractiveness Analysis

        16.5.1. By Country

        16.5.2. By Supply Mode

        16.5.3. By Application

    16.6. Market Trends

    16.7. Key Market Participants - Intensity Mapping

    16.8. Drivers and Restraints - Impact Analysis

17. Middle East and Africa Market Analysis 2017 to 2021 and Forecast 2022 to 2032

    17.1. Introduction

    17.2. Pricing Analysis

    17.3. Historical Market Size (US$ Billion) and Volume Trend Analysis By Market Taxonomy, 2017 to 2021

    17.4. Market Size (US$ Billion) and Volume Forecast By Market Taxonomy, 2022 to 2032

        17.4.1. By Country

            17.4.1.1. GCC Countries

            17.4.1.2. Turkey

            17.4.1.3. South Africa

            17.4.1.4. Rest of Middle East and Africa

        17.4.2. By Supply Mode

        17.4.3. By Application

    17.5. Market Attractiveness Analysis

        17.5.1. By Country

        17.5.2. By Supply Mode

        17.5.3. By Application

    17.6. Market Trends

    17.7. Key Market Participants - Intensity Mapping

    17.8. Drivers and Restraints - Impact Analysis

18. Country-Wise Market Analysis 2022 to 2032

    18.1. Introduction

        18.1.1. Market Value Proportion Analysis, By Key Countries

        18.1.2. Global Vs. Country Growth Comparison

    18.2. USA Market Analysis

        18.2.1. By Supply Mode

        18.2.2. By Application

    18.3. Canada Market Analysis

        18.3.1. By Supply Mode

        18.3.2. By Application

    18.4. Mexico Market Analysis

        18.4.1. By Supply Mode

        18.4.2. By Application

    18.5. Brazil Market Analysis

        18.5.1. By Supply Mode

        18.5.2. By Application

    18.6. Germany Market Analysis

        18.6.1. By Supply Mode

        18.6.2. By Application

    18.7. Italy Market Analysis

        18.7.1. By Supply Mode

        18.7.2. By Application

    18.8. France Market Analysis

        18.8.1. By Supply Mode

        18.8.2. By Application

    18.9. UK Market Analysis

        18.9.1. By Supply Mode

        18.9.2. By Application

    18.10. Spain Market Analysis

        18.10.1. By Supply Mode

        18.10.2. By Application

    18.11. Russia Market Analysis

        18.11.1. By Supply Mode

        18.11.2. By Application

    18.12. Poland Market Analysis

        18.12.1. By Supply Mode

        18.12.2. By Application

    18.13. China Market Analysis

        18.13.1. By Supply Mode

        18.13.2. By Application

    18.14. Japan Market Analysis

        18.14.1. By Supply Mode

        18.14.2. By Application

    18.15. S. Korea Market Analysis

        18.15.1. By Supply Mode

        18.15.2. By Application

    18.16. India Market Analysis

        18.16.1. By Supply Mode

        18.16.2. By Application

    18.17. ASEAN Market Analysis

        18.17.1. By Supply Mode

        18.17.2. By Application

    18.18. Australia and New Zealand Market Analysis

        18.18.1. By Supply Mode

        18.18.2. By Application

    18.19. GCC Countries Market Analysis

        18.19.1. By Supply Mode

        18.19.2. By Application

    18.20. Turkey Market Analysis

        18.20.1. By Supply Mode

        18.20.2. By Application

    18.21. South Africa Market Analysis

        18.21.1. By Supply Mode

        18.21.2. By Application

19. Market Structure Analysis

    19.1. Market Analysis by Tier of Companies (Helium Gas)

    19.2. Market Concentration

    19.3. Market Share Analysis of Top Players

    19.4. Apparent Production Capacity

    19.5. Market Presence Analysis

        19.5.1. By Product Footprint of Players

        19.5.2. By Region Footprint of Players

        19.5.3. By Channel Footprint of Players

20. Competition Analysis

    20.1. Competition Dashboard

    20.2. Competition Benchmarking

    20.3. Primary Survey Analysis

    20.4. Competition Deep Dive

        20.4.1. Air Liquide

            20.4.1.1. Overview

            20.4.1.2. Product Portfolio

            20.4.1.3. Profitability by Market Segments (Product/Channel/Region)

            20.4.1.4. Sales Footprint

            20.4.1.5. Strategy Overview

        20.4.2. The Linde Group

        20.4.3. Matheson Tri-Gas, Inc.

        20.4.4. Air Gas Inc.

        20.4.5. Air Products & Chemicals, Inc.

        20.4.6. Cryoin Engineering Ltd

        20.4.7. Chengdu Taiyu Industrial Gases Co. Ltd

        20.4.8. Messer Group GmbH

21. Assumptions and Acronyms Used

22. Research Methodology

Don't pay for what you don't need

Customize your report by selecting specific countries or regions and save 30%!

List of Tables

Table 01: Global Market Size (US$ Billion) and Volume (Tons) Forecast by Supply Mode, 2017 to 2032

Table 02: Global Market Size (US$ Billion) and Volume (Tons) Forecast by Application, 2017 to 2032

Table 03: Global Market Size (US$ Billion) and Volume (Tons) Forecast by Region, 2017 to 2032

Table 04: North America Market Size (US$ Billion) and Volume (Tons) Forecast by Country, 2017 to 2032

Table 05: North America Market Size (US$ Billion) and Volume (Tons) Forecast by Supply Mode, 2017 to 2032

Table 06: North America Market Size (US$ Billion) and Volume (Tons) Forecast by Application, 2017 to 2032

Table 07: Latin America Market Size (US$ Billion) and Volume (Tons) Forecast by Country, 2017 to 2032

Table 08: Latin America Market Size (US$ Billion) and Volume (Tons) Forecast by Supply Mode, 2017 to 2032

Table 09: Latin America Market Size (US$ Billion) and Volume (Tons) Forecast by Application, 2017 to 2032

Table 10: Europe Market Size (US$ Billion) and Volume (Tons) Forecast by Country, 2017 to 2032

Table 11: Europe Market Size (US$ Billion) and Volume (Tons) Forecast by Supply Mode, 2017 to 2032

Table 12: Europe Market Size (US$ Billion) and Volume (Tons) Forecast by Application, 2017 to 2032

Table 13: East Asia Market Size (US$ Billion) and Volume (Tons) Forecast by Country, 2017 to 2032

Table 14: East Asia Market Size (US$ Billion) and Volume (Tons) Forecast by Supply Mode, 2017 to 2032

Table 15: East Asia Market Size (US$ Billion) and Volume (Tons) Forecast by Application, 2017 to 2032

Table 16: South Asia Pacific Market Size (US$ Billion) and Volume (Tons) Forecast by Country, 2017 to 2032

Table 17: South Asia Pacific Market Size (US$ Billion) and Volume (Tons) Forecast by Supply Mode, 2017 to 2032

Table 18: South Asia Pacific Market Size (US$ Billion) and Volume (Tons) Forecast by Application, 2017 to 2032

Table 19: MEA Market Size (US$ Billion) and Volume (Tons) Forecast by Country, 2017 to 2032

Table 20: MEA Market Size (US$ Billion) and Volume (Tons) Forecast by Supply Mode, 2017 to 2032

Table 21: MEA Market Size (US$ Billion) and Volume (Tons) Forecast by Application, 2017 to 2032
Nikhil Kaitwade
Nikhil Kaitwade

Principal Consultant

Talk to Analyst

Find your sweet spots for generating winning opportunities in this market.

List of Charts

Figure 01: Global Historical Market Volume (Tons) Analysis, 2017 to 2021

Figure 02: Global Current and Future Market Volume (Tons) Analysis, 2022 to 2032

Figure 03: Global Historical Value (US$ Billion), 2017 to 2021

Figure 04: Global Value (US$ Billion) Forecast, 2022 to 2032

Figure 05: Global Absolute $ Opportunity, 2017 to 2022 and 2032

Figure 06: Global Market Share and BPS Analysis by Supply Mode, 2022 & 2032

Figure 07: Global Market Y-o-Y Growth by Supply Mode, 2022 to 2032

Figure 08: Global Market Attractiveness Analysis By Supply Mode, 2022 to 2032

Figure 09: Global Market Share and BPS Analysis by Application, 2022 & 2032

Figure 10: Global Market Y-o-Y Growth by Application, 2022 to 2032

Figure 11: Global Market Attractiveness Analysis Application, 2022 to 2032

Figure 12: Global Market Share and BPS Analysis by Region, 2022 & 2032

Figure 13: Global Market Y-o-Y Growth by Region, 2022 to 2032

Figure 14: Global Market Attractiveness Analysis Application, 2022 to 2032

Figure 15: Global Market Absolute $ Opportunity by North America Segment, 2017 to 2032

Figure 16: Global Market Absolute $ Opportunity by Latin America Segment, 2017 to 2032

Figure 17: Global Market Absolute $ Opportunity by Europe Segment, 2017 to 2032

Figure 18: Global Market Absolute $ Opportunity by East Asia Segment, 2017 to 2032

Figure 19: Global Market Absolute $ Opportunity by South Asia Pacific Segment, 2017 to 2032

Figure 20: Global Market Absolute $ Opportunity by MEA Segment, 2017 to 2032

Figure 21: North America Market Share and BPS Analysis by Country, 2022 & 2032

Figure 22: North America Market Y-o-Y Growth by Country, 2022 to 2032

Figure 23: North America Market Attractiveness Analysis Country, 2022 to 2032

Figure 24: North America Market Share and BPS Analysis by Supply Mode, 2022 & 2032

Figure 25: North America Market Y-o-Y Growth by Supply Mode, 2022 to 2032

Figure 26: North America Market Attractiveness Analysis By Supply Mode, 2022 to 2032

Figure 27: North America Market Share and BPS Analysis by Application, 2022 & 2032

Figure 28: North America Market Y-o-Y Growth by Application, 2022 to 2032

Figure 29: North America Market Attractiveness Analysis Application, 2022 to 2032

Figure 30: Latin America Market Share and BPS Analysis by Country, 2022 & 2032

Figure 31: Latin America Market Y-o-Y Growth by Country, 2022 to 2032

Figure 32: Latin America Market Attractiveness Analysis Country, 2022 to 2032

Figure 33: Latin America Market Share and BPS Analysis by Supply Mode, 2022 & 2032

Figure 34: Latin America Market Y-o-Y Growth by Supply Mode, 2022 to 2032

Figure 35: Latin America Market Attractiveness Analysis By Supply Mode, 2022 to 2032

Figure 36: Latin America Market Share and BPS Analysis by Application, 2022 & 2032

Figure 37: Latin America Market Y-o-Y Growth by Application, 2022 to 2032

Figure 38: Latin America Market Attractiveness Analysis Application, 2022 to 2032

Figure 39: Europe Market Share and BPS Analysis by Country, 2022 & 2032

Figure 40: Europe Market Y-o-Y Growth by Country, 2022 to 2032

Figure 41: Europe Market Attractiveness Analysis Country, 2022 to 2032

Figure 42: Europe Market Share and BPS Analysis by Supply Mode, 2022 & 2032

Figure 43: Europe Market Y-o-Y Growth by Supply Mode, 2022 to 2032

Figure 44: Europe Market Attractiveness Analysis By Supply Mode, 2022 to 2032

Figure 45: Europe Market Share and BPS Analysis by Application, 2022 & 2032

Figure 46: Europe Market Y-o-Y Growth by Application, 2022 to 2032

Figure 47: Europe Market Attractiveness Analysis Application, 2022 to 2032

Figure 48: East Asia Market Share and BPS Analysis by Country, 2022 & 2032

Figure 49: East Asia Market Y-o-Y Growth by Country, 2022 to 2032

Figure 50: East Asia Market Attractiveness Analysis Country, 2022 to 2032

Figure 51: East Asia Market Share and BPS Analysis by Supply Mode, 2022 & 2032

Figure 52: East Asia Market Y-o-Y Growth by Supply Mode, 2022 to 2032

Figure 53: East Asia Market Attractiveness Analysis By Supply Mode, 2022 to 2032

Figure 54: East Asia Market Share and BPS Analysis by Application, 2022 & 2032

Figure 55: East Asia Market Y-o-Y Growth by Application, 2022 to 2032

Figure 56: East Asia Market Attractiveness Analysis Application, 2022 to 2032

Figure 57: South Asia Pacific Market Share and BPS Analysis by Country, 2022 & 2032

Figure 58: South Asia Pacific Market Y-o-Y Growth by Country, 2022 to 2032

Figure 59: South Asia Pacific Market Attractiveness Analysis Country, 2022 to 2032

Figure 60: South Asia Pacific Market Share and BPS Analysis by Supply Mode, 2022 & 2032

Figure 61: South Asia Pacific Market Y-o-Y Growth by Supply Mode, 2022 to 2032

Figure 62: South Asia Pacific Market Attractiveness Analysis By Supply Mode, 2022 to 2032

Figure 63: South Asia Pacific Market Share and BPS Analysis by Application, 2022 & 2032

Figure 64: South Asia Pacific Market Y-o-Y Growth by Application, 2022 to 2032

Figure 65: South Asia Pacific Market Attractiveness Analysis Application, 2022 to 2032

Figure 66: MEA Market Share and BPS Analysis by Country, 2022 & 2032

Figure 67: MEA Market Y-o-Y Growth by Country, 2022 to 2032

Figure 68: MEA Market Attractiveness Analysis Country, 2022 to 2032

Figure 69: MEA Market Share and BPS Analysis by Supply Mode, 2022 & 2032

Figure 70: MEA Market Y-o-Y Growth by Supply Mode, 2022 to 2032

Figure 71: MEA Market Attractiveness Analysis By Supply Mode, 2022 to 2032

Figure 72: MEA Market Share and BPS Analysis by Application, 2022 & 2032

Figure 73: MEA Market Y-o-Y Growth by Application, 2022 to 2032

Figure 74: MEA Market Attractiveness Analysis Application, 2022 to 2032

Recommendations

Chemicals & Materials

Coating Additives Market

Published : August 2023

Chemicals & Materials

Pharmaceutical Solvents Market

Published : May 2023

Chemicals & Materials

Industrial Adhesives Market

Published : March 2023

Chemicals & Materials

Xenon Gas Market

Published : May 2022

Explore Chemicals & Materials Insights

View Reports