Reports

- Global Locations -

Headquarters

Future Market Insights, Inc.

Christiana Corporate, 200
Continental Drive, Suite 401,
Newark, Delaware - 19713,
United States

T: +1-347-918-3531

Americas

Future Market Insights, Inc.

616 Corporate Way, Suite 2-9018,
Valley Cottage, NY 10989, United States

MEA

Future Market Insights

1602-6 Jumeirah Bay X2 Tower, Plot No: JLT-PH2-X2A,
Jumeirah Lakes Towers, Dubai,
United Arab Emirates

Europe

Future Market Insights

3rd Floor, 207 Regent Street,
W1B 3HH London
United Kingdom

T: + 44 (0) 20 8123 9659

Asia Pacific

Future Market Insights

IndiaLand Global Tech Park, Unit UG-1, Behind Grand HighStreet, Phase 1, Hinjawadi, MH, Pune – 411057, India

Hygienic Pump and Valve Market Outlook for 2024 to 2034

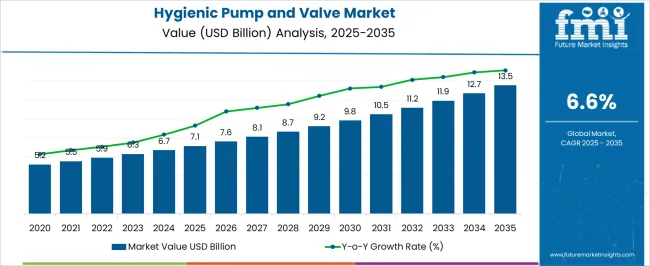
The hygienic pump and valve market is expected to expand from US$ 6.7 billion in 2024 to US$ 12.6 billion by 2034. The market is set to exhibit a CAGR of 6.6% over the forecast period.

Attributes Key Insights
Estimated Hygienic Pump and Valve Market Size (2024E) US$ 6.7 billion
Projected Industry Value (2034F) US$ 12.6 billion
Value-based CAGR (2024 to 2034) 6.6%

Don't pay for what you don't need

Customize your report by selecting specific countries or regions and save 30%!

Key Trends Shaping the Hygienic Pump and Valve Market

  • Stringent regulations related to product purity and hygiene in pharmaceutical, food and beverage, and bioprocessing industries are raising the use of hygienic pumps and valves to ensure product compliance and safety.
  • Growing demand for hygienic pumps and valves from multiple end-use industries like food and beverages, and pharmaceuticals is expected to appreciate the market value.
  • Increasing integration of hygienic pumps and valves with Industrial Internet of Things (IIoT) systems is projected to facilitate remote monitoring, optimized performance, and predictive maintenance.
  • Surging environmental concerns are expected to motivate manufacturers to adopt sustainable practices like using energy-efficient hygienic pumps and valves and those made of recyclable materials.

Overview of Markets Adjacent to the Hygienic Pump and Valve Market

Given below is a comparative analysis of the hygienic pump and valve market with drum pump and industrial valve markets. These markets are being compared on parameters like drivers, trends, and opportunities.

Among these, the hygienic pump and valve market is estimated to register a higher CAGR of 6.6% through 2034. This market is driven by surging demand for hygienic pumps and valves in multiple end-use industries.

The demand for drum pumps is expected to increase at a CAGR of 6.3% through 2034. Key forces that are catapulting sales of drum pumps are increasing investments by industry leaders in quality checks and the execution of two new pump tests, which stand for the concluding inspection of drum pumps and the testing of air-operated and centrifugal pumps.

Adoption of industrial valves is set to rise at a CAGR of 4.2% from 2024 to 2034. This market is driven by the surging use of IoT and AI to lower unplanned downtime and various other adverse situations resulting from valve failures. The integration of cutting-edge valve technologies is expected to fuel market growth.

Hygienic Pump and Valve Market:

Attributes Hygienic Pump and Valve Market
CAGR (2024 to 2034) 6.6%
Growth Factor Increasing demand for these pumps in various end-use industries
Opportunity Rise in the integration of hygienic pumps and valves with cutting-edge technologies like IIoT and AI
Key Trends Stringent regulation in food and beverage industry to raise demand for food-grade hygienic pumps and valves

Industrial Valves Market:

Attributes Industrial Valves Market
CAGR (2024 to 2034) 4.2%
Growth Factor Robust industrialization has fueled the product’s demand
Opportunity Emerging opportunities in China, due to surging investments by governments in oil and gas and power generation
Key Trends Increasing adoption of Industrial Internet of Things (IIoT)

Drum Pump Market:

Attributes Drum Pump Market
CAGR (2024 to 2034) 6.3%
Growth Factor Growing demand for advanced technology to effectively deliver the drug to the target site
Opportunity Surplus investments made in the chemical industry to rev up sales of drum pumps
Key Trends Increasing investments by prominent players in quality assurance
Nikhil Kaitwade
Nikhil Kaitwade

Principal Consultant

Talk to Analyst

Find your sweet spots for generating winning opportunities in this market.

Category-wise Insights

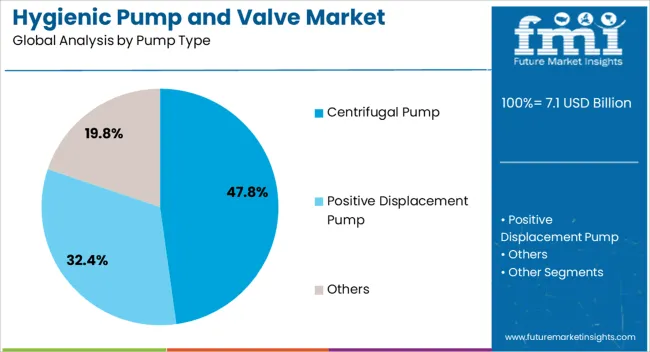
Widening Application Cases of Centrifugal Pumps to Increase their Value in the Global Market

Leading Pump Type Centrifugal Pumps
CAGR (2024 to 2034) 6.20%

The centrifugal pump segment is projected to record a CAGR of 6.20% through 2034. This pump type is driven by the following factors:

  • Increasing appeal for affordable, hygienic pumps with wider applications is raising the demand for centrifugal pumps, which has simpler designs and reduced manufacturing costs.
  • Surging use of centrifugal pumps for applications like transferring beverages, milk, and other liquid food products.
  • Easy maintenance of centrifugal pumps due to their simpler designs makes them an easier option to clean and maintain as opposed to some other types of hygienic pumps, thus raising their adoption rate.

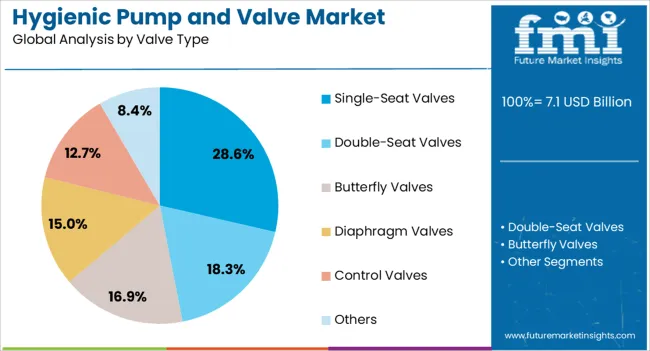
Compact Design of Single-seat Valves to Raise their Applications in Processing Plants

Leading Valve Type Single-seat Valves
CAGR (2024 to 2034) 6.0%

The single-seat valves are expected to expand at a CAGR of 6% through 2034. The segment’s growth is driven by the following factors:

  • Growing demand for single-seat valves in applications that have limited space, like the ones common in several processing plants.
  • Surging demand for these valves in hygienic industries where automation has taken over as they easily integrate with automation systems.
  • The versatility of single-seat valves to handle an extensive range of viscosities and fluids, thereby making them apt for several applications throughout the hygienic pump and valve market.

Hygienic Pump and Valve Market Analysis by Country

Countries CAGR (2024 to 2034)
United States 6.80%
United Kingdom 7.80%
China 6.90%
Japan 7.20%
South Korea 7.50%

Surging Cases of Foodborne Illnesses to Boost Sales of Hygienic Pumps and Valves in the United States

The hygienic pump and valve market in the United States is projected to acquire a market size of US$ 2.2 billion by 2034. Over the forecast period, the market is anticipated to record a CAGR of 6.8% through 2034. The top factors that are compelling the industry growth are:

  • Increasing consumer awareness of safe and healthy food has led to the introduction of strict laws and quality control measures within the food and beverage sector. These shifting dynamics are contributing to the sales of hygienic pumps and valves to prevent contamination throughout packaging and processing.
  • The Food and Drug Administration (FDA) and other regulatory bodies are executing stringent regulations to maintain food safety. These laws usually require the utilization of certain types of equipment, such as hygienic pumps and valves.
  • Increasing cases of foodborne illness on an annual basis is consolidating the demand for procedures and technologies to reduce contamination risks.

Accelerating Demand for Specialized Hygienic Pumps and Valves in the United Kingdom

The United Kingdom’s hygienic pump and valve market is expected to account for a market valuation of US$ 541.4 million by 2034. The market is anticipated to register a CAGR of 7.8% through 2034. Leading growth-inducing factors include:

  • Growth in personal care and pharmaceutical industries is necessitating the demand for specialized hygienic pumps and valves to ensure high levels of sterility and cleanliness.
  • Active players in the United Kingdom are continuously innovating hygienic pumps and valves to make them more durable, efficient, and easier to clean. Such advancements are expected to propel demand for this equipment.
  • As sustainability gains significant ground in the United Kingdom, businesses opt for eco-friendly solutions like hygienic pumps and valves that are designed for energy efficiency and lower water utilization.

Magnifying Demand for Packaged Food Varieties Appreciating the China Market Value

The China hygienic pump and valve industry is anticipated to acquire a market value of US$ 1.9 billion by 2034. It is expected to expand at a CAGR of 6.9% through 2034. Top market catalysts include:

  • The economy in China is experiencing a robust shift due to the increasing discretionary incomes of its citizens. This is contributing to rising demand for pharmaceuticals, beverages, processed foods, and other products that depend on hygienic pumps and valves throughout the production process.
  • Surging demand for packaged and convenient food options, spurred by busy lifestyles and urbanization, is creating demand for advanced hygienic pumps and valves to ensure hygienic production processes.
  • Manufacturers in China are intensifying their focus on automating their production lines to enhance efficiency and curtail costs. Since hygienic pumps and valves play a critical role in automated fluid handling systems, their adoption rate is set to enhance over time.

Technological Innovations in Japan to Augment Sales of Hygienic Pumps and Valves

The hygienic pump and valve market in Japan is estimated to gain US$ 1.3 billion by 2034, expanding at a CAGR of 7.2% through 2034. The market is expected to be motivated by the following forces:
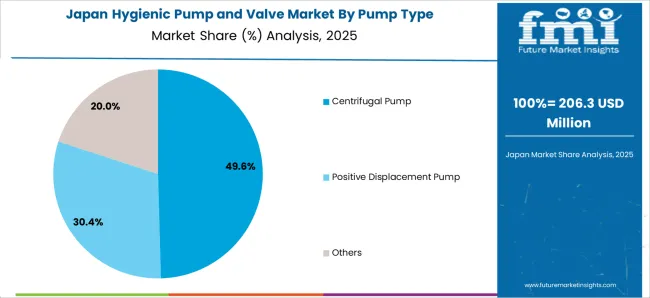
  • Demand for sanitary pumps and valves in the pharmaceutical and medical sectors in Japan is driven by the expanding aging population within the country.
  • Increasing advancements by top players to refine technology and automation are resulting in the development of more sophisticated and efficient hygienic valves and pumps. Thus, enhancing their demand in several industries.
  • Rising use of hygienic pumps and valves in biotechnology and pharmaceutical sectors to prevent contamination in sensitive products.

Focus on Innovation and Quality in South Korea Drives Market Demand

The hygienic pump and valve market in South Korea is projected to attain a value of US$ 752 million by 2034. For the time being, the market is predicted to register a CAGR of 7.5% through 2034. The following factors support the market’s growth:

  • Surging disposable incomes of people in South Korea and shifting consumer preferences for convenient foods are impacting the food and beverage industry. These dynamics are necessitating the demand for hygienic equipment to ensure product quality and safety in the food and beverage sector.
  • Strict laws for food safety and hygiene in South Korea are imposing the use of hygienic equipment like hygienic pumps and valves in pharmaceuticals, food processing, and other sensitive industries.
  • Manufacturers in South Korea are narrowing down their focus on high-quality products and distinct processes, which is bringing into use reliable hygienic pumps and valves to maintain consistent product quality.

Get the data you need at a Fraction of the cost

Personalize your report by choosing insights you need
and save 40%!

Top Strategies Implemented by Leading Players

Key players are focusing on the development of hygienic pumps and valves with advanced materials. Additionally, they are increasingly integrating sensors as well as connecting pumps and valves with the Industrial Internet of Things (IIoT) to raise cost-savings and efficiency for customers. Players are further increasing their market share by entering new markets where demand for pharmaceuticals and processed food is surging.

Industry participants are strategically partnering and acquiring new companies to extend their product portfolios, access new technologies, and reach new customers. Active companies are further focusing on offering excellent technical support, customer service, and customized solutions to cater to individual customer needs.

Latest Developments in the Hygienic Pump and Valve Market

  • Alfa Laval introduced a new ThinkTop V20 in March 2023. This is a next-gen hygienic valve indication unit, which is expected to assist the digital transformation in process industries. The ThinkTop V20 is expected to facilitate process control and reduce the time and money spent on commissioning, installation, maintenance, and operation.
  • GEA Group Aktiengesellschaft introduced GEA Hilge CONTRA III in June 2021. This launch is expected to meet the requirements of the beverage, dairy, and food industries. GEA further extended the performance spectrum of its centrifugal pumps to a 100 cubic meters per hour flow rate.

Key Manufacturers of Hygienic Pumps and Valves

  • Alfa Laval AB
  • Ampco Pumps Company
  • Dixon Valve & Coupling Company, LLC
  • GEA Group Aktiengesellschaft
  • Dover Corporation
  • IDEX Corporation
  • Holland Applied Technologies, Inc.
  • KSB SE & Co. KGaA
  • Tapflo Group
  • SPX Corporation
  • Others

Key Coverage in the Hygienic Pump and Valve Industry Report

  • Adjacent Study of the Sanitary Pumps and Valves Market, Clean-in-place (CIP) Pump and Valve Market, Biopharmaceutical Pump and Valve Market, and Hygienic Fluid Handling Equipment Market
  • Consumption Rate of Hygienic Pumps and Valves in End Uses Like Dairy, Pharmaceutical, and Beverage

Key Market Segmentation

By Pump Type:

  • Centrifugal Pump
  • Positive Displacement Pump
  • Others

By Valve Type:

  • Single-Seat Valves
  • Double-Seat Valves
  • Butterfly Valves
  • Diaphragm Valves
  • Control Valves
  • Others

By Material Type:

  • Stainless Steel
  • Copper
  • Bronze

By Hygiene Class:

  • Aseptic
  • Standard
  • Ultraclean

By Application:

  • Pharmaceutical
  • Food
  • Cosmetics
  • Fine Chemistry
  • Others

By Region:

  • North America
  • Europe
  • Asia Pacific
  • Middle East and Africa
  • Latin America

Frequently Asked Questions

How Big is the Hygienic Pump and Valve Market in 2024?

The hygienic pump and valve market is estimated to account for US$ 6.7 billion in 2024.

At What Rate will the Hygienic Pump and Valve Market Grow?

The hygienic pump and valve industry is projected to register a CAGR of 6.6% through 2034.

What is the Expected Value of the Hygienic Pump and Valve Market by 2034?

By 2034, the hygienic pump and valve industry is forecast to reach a valuation of US$ 12.6 billion.

Which Pump Type is Expected to Observe Significant Growth in the Hygienic Pump and Valve Industry?

Sales of centrifugal pumps are expected to observe significant growth over the forecast period.

Which Country is Projected to Find Significant Growth Opportunities?

The United Kingdom is expected to generate substantial growth prospects in the future.

Which are the Leading Companies in the Hygienic Pump and Valve Industry?

Leading companies in the hygienic pump and valve industry include KSB SE & Co. KGaA, Tapflo Group, and SPX Corporation.

Table of Content

1. Executive Summary

    1.1. Global Market Outlook

    1.2. Demand-side Trends

    1.3. Supply-side Trends

    1.4. Technology Roadmap Analysis

    1.5. Analysis and Recommendations

2. Market Overview

    2.1. Market Coverage / Taxonomy

    2.2. Market Definition / Scope / Limitations

3. Market Background

    3.1. Market Dynamics

        3.1.1. Drivers

        3.1.2. Restraints

        3.1.3. Opportunity

        3.1.4. Trends

    3.2. Scenario Forecast

        3.2.1. Demand in Optimistic Scenario

        3.2.2. Demand in Likely Scenario

        3.2.3. Demand in Conservative Scenario

    3.3. Opportunity Map Analysis

    3.4. Product Life Cycle Analysis

    3.5. Supply Chain Analysis

        3.5.1. Supply Side Participants and their Roles

            3.5.1.1. Producers

            3.5.1.2. Mid-Level Participants (Traders/ Agents/ Brokers)

            3.5.1.3. Wholesalers and Distributors

        3.5.2. Value Added and Value Created at Node in the Supply Chain

        3.5.3. List of Raw Material Suppliers

        3.5.4. List of Existing and Potential Buyer’s

    3.6. Investment Feasibility Matrix

    3.7. Value Chain Analysis

        3.7.1. Profit Margin Analysis

        3.7.2. Wholesalers and Distributors

        3.7.3. Retailers

    3.8. PESTLE and Porter’s Analysis

    3.9. Regulatory Landscape

        3.9.1. By Key Regions

        3.9.2. By Key Countries

    3.10. Regional Parent Market Outlook

    3.11. Production and Consumption Statistics

    3.12. Import and Export Statistics

4. Global Market Analysis 2019 to 2023 and Forecast, 2024 to 2034

    4.1. Historical Market Size Value (US$ Million) & Volume (Units) Analysis, 2019 to 2023

    4.2. Current and Future Market Size Value (US$ Million) & Volume (Units) Projections, 2024 to 2034

        4.2.1. Y-o-Y Growth Trend Analysis

        4.2.2. Absolute $ Opportunity Analysis

5. Global Market Analysis 2019 to 2023 and Forecast 2024 to 2034, By Pump Type

    5.1. Introduction / Key Findings

    5.2. Historical Market Size Value (US$ Million) & Volume (Units) Analysis By Pump Type, 2019 to 2023

    5.3. Current and Future Market Size Value (US$ Million) & Volume (Units) Analysis and Forecast By Pump Type, 2024 to 2034

        5.3.1. Centrifugal Pump

        5.3.2. Positive Displacement Pum

        5.3.3. Others

    5.4. Y-o-Y Growth Trend Analysis By Pump Type, 2019 to 2023

    5.5. Absolute $ Opportunity Analysis By Pump Type, 2024 to 2034

6. Global Market Analysis 2019 to 2023 and Forecast 2024 to 2034, By Valve Type

    6.1. Introduction / Key Findings

    6.2. Historical Market Size Value (US$ Million) & Volume (Units) Analysis By Valve Type, 2019 to 2023

    6.3. Current and Future Market Size Value (US$ Million) & Volume (Units) Analysis and Forecast By Valve Type, 2024 to 2034

        6.3.1. Single-Seat Valves

        6.3.2. Double-Seat Valves

        6.3.3. Butterfly Valves

        6.3.4. Diaphragm Valves

        6.3.5. Control Valves

        6.3.6. Others

    6.4. Y-o-Y Growth Trend Analysis By Valve Type, 2019 to 2023

    6.5. Absolute $ Opportunity Analysis By Valve Type, 2024 to 2034

7. Global Market Analysis 2019 to 2023 and Forecast 2024 to 2034, By Material Type

    7.1. Introduction / Key Findings

    7.2. Historical Market Size Value (US$ Million) & Volume (Units) Analysis By Material Type, 2019 to 2023

    7.3. Current and Future Market Size Value (US$ Million) & Volume (Units) Analysis and Forecast By Material Type, 2024 to 2034

        7.3.1. Stainless Steel

        7.3.2. Copper

        7.3.3. Bronze

    7.4. Y-o-Y Growth Trend Analysis By Material Type, 2019 to 2023

    7.5. Absolute $ Opportunity Analysis By Material Type, 2024 to 2034

8. Global Market Analysis 2019 to 2023 and Forecast 2024 to 2034, By Hygiene Class

    8.1. Introduction / Key Findings

    8.2. Historical Market Size Value (US$ Million) & Volume (Units) Analysis By Hygiene Class, 2019 to 2023

    8.3. Current and Future Market Size Value (US$ Million) & Volume (Units) Analysis and Forecast By Hygiene Class, 2024 to 2034

        8.3.1. Aseptic

        8.3.2. Standard

        8.3.3. Ultraclean

    8.4. Y-o-Y Growth Trend Analysis By Hygiene Class, 2019 to 2023

    8.5. Absolute $ Opportunity Analysis By Hygiene Class, 2024 to 2034

9. Global Market Analysis 2019 to 2023 and Forecast 2024 to 2034, By Application

    9.1. Introduction / Key Findings

    9.2. Historical Market Size Value (US$ Million) & Volume (Units) Analysis By Application, 2019 to 2023

    9.3. Current and Future Market Size Value (US$ Million) & Volume (Units) Analysis and Forecast By Application, 2024 to 2034

        9.3.1. Pharmaceutical

        9.3.2. Food

        9.3.3. Cosmetics

        9.3.4. Fine Chemistry

        9.3.5. Others

    9.4. Y-o-Y Growth Trend Analysis By Application, 2019 to 2023

    9.5. Absolute $ Opportunity Analysis By Application, 2024 to 2034

10. Global Market Analysis 2019 to 2023 and Forecast 2024 to 2034, By Region

    10.1. Introduction

    10.2. Historical Market Size Value (US$ Million) & Volume (Units) Analysis By Region, 2019 to 2023

    10.3. Current Market Size Value (US$ Million) & Volume (Units) Analysis and Forecast By Region, 2024 to 2034

        10.3.1. North America

        10.3.2. Latin America

        10.3.3. Western Europe

        10.3.4. Eastern Europe

        10.3.5. South Asia and Pacific

        10.3.6. East Asia

        10.3.7. Middle East and Africa

    10.4. Market Attractiveness Analysis By Region

11. North America Market Analysis 2019 to 2023 and Forecast 2024 to 2034, By Country

    11.1. Historical Market Size Value (US$ Million) & Volume (Units) Trend Analysis By Market Taxonomy, 2019 to 2023

    11.2. Market Size Value (US$ Million) & Volume (Units) Forecast By Market Taxonomy, 2024 to 2034

        11.2.1. By Country

            11.2.1.1. USA

            11.2.1.2. Canada

        11.2.2. By Pump Type

        11.2.3. By Valve Type

        11.2.4. By Material Type

        11.2.5. By Hygiene Class

        11.2.6. By Application

    11.3. Market Attractiveness Analysis

        11.3.1. By Country

        11.3.2. By Pump Type

        11.3.3. By Valve Type

        11.3.4. By Material Type

        11.3.5. By Hygiene Class

        11.3.6. By Application

    11.4. Key Takeaways

12. Latin America Market Analysis 2019 to 2023 and Forecast 2024 to 2034, By Country

    12.1. Historical Market Size Value (US$ Million) & Volume (Units) Trend Analysis By Market Taxonomy, 2019 to 2023

    12.2. Market Size Value (US$ Million) & Volume (Units) Forecast By Market Taxonomy, 2024 to 2034

        12.2.1. By Country

            12.2.1.1. Brazil

            12.2.1.2. Mexico

            12.2.1.3. Rest of Latin America

        12.2.2. By Pump Type

        12.2.3. By Valve Type

        12.2.4. By Material Type

        12.2.5. By Hygiene Class

        12.2.6. By Application

    12.3. Market Attractiveness Analysis

        12.3.1. By Country

        12.3.2. By Pump Type

        12.3.3. By Valve Type

        12.3.4. By Material Type

        12.3.5. By Hygiene Class

        12.3.6. By Application

    12.4. Key Takeaways

13. Western Europe Market Analysis 2019 to 2023 and Forecast 2024 to 2034, By Country

    13.1. Historical Market Size Value (US$ Million) & Volume (Units) Trend Analysis By Market Taxonomy, 2019 to 2023

    13.2. Market Size Value (US$ Million) & Volume (Units) Forecast By Market Taxonomy, 2024 to 2034

        13.2.1. By Country

            13.2.1.1. Germany

            13.2.1.2. UK

            13.2.1.3. France

            13.2.1.4. Spain

            13.2.1.5. Italy

            13.2.1.6. Rest of Western Europe

        13.2.2. By Pump Type

        13.2.3. By Valve Type

        13.2.4. By Material Type

        13.2.5. By Hygiene Class

        13.2.6. By Application

    13.3. Market Attractiveness Analysis

        13.3.1. By Country

        13.3.2. By Pump Type

        13.3.3. By Valve Type

        13.3.4. By Material Type

        13.3.5. By Hygiene Class

        13.3.6. By Application

    13.4. Key Takeaways

14. Eastern Europe Market Analysis 2019 to 2023 and Forecast 2024 to 2034, By Country

    14.1. Historical Market Size Value (US$ Million) & Volume (Units) Trend Analysis By Market Taxonomy, 2019 to 2023

    14.2. Market Size Value (US$ Million) & Volume (Units) Forecast By Market Taxonomy, 2024 to 2034

        14.2.1. By Country

            14.2.1.1. Poland

            14.2.1.2. Russia

            14.2.1.3. Czech Republic

            14.2.1.4. Romania

            14.2.1.5. Rest of Eastern Europe

        14.2.2. By Pump Type

        14.2.3. By Valve Type

        14.2.4. By Material Type

        14.2.5. By Hygiene Class

        14.2.6. By Application

    14.3. Market Attractiveness Analysis

        14.3.1. By Country

        14.3.2. By Pump Type

        14.3.3. By Valve Type

        14.3.4. By Material Type

        14.3.5. By Hygiene Class

        14.3.6. By Application

    14.4. Key Takeaways

15. South Asia and Pacific Market Analysis 2019 to 2023 and Forecast 2024 to 2034, By Country

    15.1. Historical Market Size Value (US$ Million) & Volume (Units) Trend Analysis By Market Taxonomy, 2019 to 2023

    15.2. Market Size Value (US$ Million) & Volume (Units) Forecast By Market Taxonomy, 2024 to 2034

        15.2.1. By Country

            15.2.1.1. India

            15.2.1.2. Bangladesh

            15.2.1.3. Australia

            15.2.1.4. New Zealand

            15.2.1.5. Rest of South Asia and Pacific

        15.2.2. By Pump Type

        15.2.3. By Valve Type

        15.2.4. By Material Type

        15.2.5. By Hygiene Class

        15.2.6. By Application

    15.3. Market Attractiveness Analysis

        15.3.1. By Country

        15.3.2. By Pump Type

        15.3.3. By Valve Type

        15.3.4. By Material Type

        15.3.5. By Hygiene Class

        15.3.6. By Application

    15.4. Key Takeaways

16. East Asia Market Analysis 2019 to 2023 and Forecast 2024 to 2034, By Country

    16.1. Historical Market Size Value (US$ Million) & Volume (Units) Trend Analysis By Market Taxonomy, 2019 to 2023

    16.2. Market Size Value (US$ Million) & Volume (Units) Forecast By Market Taxonomy, 2024 to 2034

        16.2.1. By Country

            16.2.1.1. China

            16.2.1.2. Japan

            16.2.1.3. South Korea

        16.2.2. By Pump Type

        16.2.3. By Valve Type

        16.2.4. By Material Type

        16.2.5. By Hygiene Class

        16.2.6. By Application

    16.3. Market Attractiveness Analysis

        16.3.1. By Country

        16.3.2. By Pump Type

        16.3.3. By Valve Type

        16.3.4. By Material Type

        16.3.5. By Hygiene Class

        16.3.6. By Application

    16.4. Key Takeaways

17. Middle East and Africa Market Analysis 2019 to 2023 and Forecast 2024 to 2034, By Country

    17.1. Historical Market Size Value (US$ Million) & Volume (Units) Trend Analysis By Market Taxonomy, 2019 to 2023

    17.2. Market Size Value (US$ Million) & Volume (Units) Forecast By Market Taxonomy, 2024 to 2034

        17.2.1. By Country

            17.2.1.1. GCC Countries

            17.2.1.2. South Africa

            17.2.1.3. Israel

            17.2.1.4. Rest of MEA

        17.2.2. By Pump Type

        17.2.3. By Valve Type

        17.2.4. By Material Type

        17.2.5. By Hygiene Class

        17.2.6. By Application

    17.3. Market Attractiveness Analysis

        17.3.1. By Country

        17.3.2. By Pump Type

        17.3.3. By Valve Type

        17.3.4. By Material Type

        17.3.5. By Hygiene Class

        17.3.6. By Application

    17.4. Key Takeaways

18. Key Countries Market Analysis

    18.1. USA

        18.1.1. Pricing Analysis

        18.1.2. Market Share Analysis, 2023

            18.1.2.1. By Pump Type

            18.1.2.2. By Valve Type

            18.1.2.3. By Material Type

            18.1.2.4. By Hygiene Class

            18.1.2.5. By Application

    18.2. Canada

        18.2.1. Pricing Analysis

        18.2.2. Market Share Analysis, 2023

            18.2.2.1. By Pump Type

            18.2.2.2. By Valve Type

            18.2.2.3. By Material Type

            18.2.2.4. By Hygiene Class

            18.2.2.5. By Application

    18.3. Brazil

        18.3.1. Pricing Analysis

        18.3.2. Market Share Analysis, 2023

            18.3.2.1. By Pump Type

            18.3.2.2. By Valve Type

            18.3.2.3. By Material Type

            18.3.2.4. By Hygiene Class

            18.3.2.5. By Application

    18.4. Mexico

        18.4.1. Pricing Analysis

        18.4.2. Market Share Analysis, 2023

            18.4.2.1. By Pump Type

            18.4.2.2. By Valve Type

            18.4.2.3. By Material Type

            18.4.2.4. By Hygiene Class

            18.4.2.5. By Application

    18.5. Germany

        18.5.1. Pricing Analysis

        18.5.2. Market Share Analysis, 2023

            18.5.2.1. By Pump Type

            18.5.2.2. By Valve Type

            18.5.2.3. By Material Type

            18.5.2.4. By Hygiene Class

            18.5.2.5. By Application

    18.6. UK

        18.6.1. Pricing Analysis

        18.6.2. Market Share Analysis, 2023

            18.6.2.1. By Pump Type

            18.6.2.2. By Valve Type

            18.6.2.3. By Material Type

            18.6.2.4. By Hygiene Class

            18.6.2.5. By Application

    18.7. France

        18.7.1. Pricing Analysis

        18.7.2. Market Share Analysis, 2023

            18.7.2.1. By Pump Type

            18.7.2.2. By Valve Type

            18.7.2.3. By Material Type

            18.7.2.4. By Hygiene Class

            18.7.2.5. By Application

    18.8. Spain

        18.8.1. Pricing Analysis

        18.8.2. Market Share Analysis, 2023

            18.8.2.1. By Pump Type

            18.8.2.2. By Valve Type

            18.8.2.3. By Material Type

            18.8.2.4. By Hygiene Class

            18.8.2.5. By Application

    18.9. Italy

        18.9.1. Pricing Analysis

        18.9.2. Market Share Analysis, 2023

            18.9.2.1. By Pump Type

            18.9.2.2. By Valve Type

            18.9.2.3. By Material Type

            18.9.2.4. By Hygiene Class

            18.9.2.5. By Application

    18.10. Poland

        18.10.1. Pricing Analysis

        18.10.2. Market Share Analysis, 2023

            18.10.2.1. By Pump Type

            18.10.2.2. By Valve Type

            18.10.2.3. By Material Type

            18.10.2.4. By Hygiene Class

            18.10.2.5. By Application

    18.11. Russia

        18.11.1. Pricing Analysis

        18.11.2. Market Share Analysis, 2023

            18.11.2.1. By Pump Type

            18.11.2.2. By Valve Type

            18.11.2.3. By Material Type

            18.11.2.4. By Hygiene Class

            18.11.2.5. By Application

    18.12. Czech Republic

        18.12.1. Pricing Analysis

        18.12.2. Market Share Analysis, 2023

            18.12.2.1. By Pump Type

            18.12.2.2. By Valve Type

            18.12.2.3. By Material Type

            18.12.2.4. By Hygiene Class

            18.12.2.5. By Application

    18.13. Romania

        18.13.1. Pricing Analysis

        18.13.2. Market Share Analysis, 2023

            18.13.2.1. By Pump Type

            18.13.2.2. By Valve Type

            18.13.2.3. By Material Type

            18.13.2.4. By Hygiene Class

            18.13.2.5. By Application

    18.14. India

        18.14.1. Pricing Analysis

        18.14.2. Market Share Analysis, 2023

            18.14.2.1. By Pump Type

            18.14.2.2. By Valve Type

            18.14.2.3. By Material Type

            18.14.2.4. By Hygiene Class

            18.14.2.5. By Application

    18.15. Bangladesh

        18.15.1. Pricing Analysis

        18.15.2. Market Share Analysis, 2023

            18.15.2.1. By Pump Type

            18.15.2.2. By Valve Type

            18.15.2.3. By Material Type

            18.15.2.4. By Hygiene Class

            18.15.2.5. By Application

    18.16. Australia

        18.16.1. Pricing Analysis

        18.16.2. Market Share Analysis, 2023

            18.16.2.1. By Pump Type

            18.16.2.2. By Valve Type

            18.16.2.3. By Material Type

            18.16.2.4. By Hygiene Class

            18.16.2.5. By Application

    18.17. New Zealand

        18.17.1. Pricing Analysis

        18.17.2. Market Share Analysis, 2023

            18.17.2.1. By Pump Type

            18.17.2.2. By Valve Type

            18.17.2.3. By Material Type

            18.17.2.4. By Hygiene Class

            18.17.2.5. By Application

    18.18. China

        18.18.1. Pricing Analysis

        18.18.2. Market Share Analysis, 2023

            18.18.2.1. By Pump Type

            18.18.2.2. By Valve Type

            18.18.2.3. By Material Type

            18.18.2.4. By Hygiene Class

            18.18.2.5. By Application

    18.19. Japan

        18.19.1. Pricing Analysis

        18.19.2. Market Share Analysis, 2023

            18.19.2.1. By Pump Type

            18.19.2.2. By Valve Type

            18.19.2.3. By Material Type

            18.19.2.4. By Hygiene Class

            18.19.2.5. By Application

    18.20. South Korea

        18.20.1. Pricing Analysis

        18.20.2. Market Share Analysis, 2023

            18.20.2.1. By Pump Type

            18.20.2.2. By Valve Type

            18.20.2.3. By Material Type

            18.20.2.4. By Hygiene Class

            18.20.2.5. By Application

    18.21. GCC Countries

        18.21.1. Pricing Analysis

        18.21.2. Market Share Analysis, 2023

            18.21.2.1. By Pump Type

            18.21.2.2. By Valve Type

            18.21.2.3. By Material Type

            18.21.2.4. By Hygiene Class

            18.21.2.5. By Application

    18.22. South Africa

        18.22.1. Pricing Analysis

        18.22.2. Market Share Analysis, 2023

            18.22.2.1. By Pump Type

            18.22.2.2. By Valve Type

            18.22.2.3. By Material Type

            18.22.2.4. By Hygiene Class

            18.22.2.5. By Application

    18.23. Israel

        18.23.1. Pricing Analysis

        18.23.2. Market Share Analysis, 2023

            18.23.2.1. By Pump Type

            18.23.2.2. By Valve Type

            18.23.2.3. By Material Type

            18.23.2.4. By Hygiene Class

            18.23.2.5. By Application

19. Market Structure Analysis

    19.1. Competition Dashboard

    19.2. Competition Benchmarking

    19.3. Market Share Analysis of Top Players

        19.3.1. By Regional

        19.3.2. By Pump Type

        19.3.3. By Valve Type

        19.3.4. By Material Type

        19.3.5. By Hygiene Class

        19.3.6. By Application

20. Competition Analysis

    20.1. Competition Deep Dive

        20.1.1. Adamant Valves

            20.1.1.1. Overview

            20.1.1.2. Product Portfolio

            20.1.1.3. Profitability by Market Segments

            20.1.1.4. Sales Footprint

            20.1.1.5. Strategy Overview

                20.1.1.5.1. Marketing Strategy

                20.1.1.5.2. Product Strategy

                20.1.1.5.3. Channel Strategy

        20.1.2. Alfa Laval

            20.1.2.1. Overview

            20.1.2.2. Product Portfolio

            20.1.2.3. Profitability by Market Segments

            20.1.2.4. Sales Footprint

            20.1.2.5. Strategy Overview

                20.1.2.5.1. Marketing Strategy

                20.1.2.5.2. Product Strategy

                20.1.2.5.3. Channel Strategy

        20.1.3. Bardiani Valvole S.P.A.

            20.1.3.1. Overview

            20.1.3.2. Product Portfolio

            20.1.3.3. Profitability by Market Segments

            20.1.3.4. Sales Footprint

            20.1.3.5. Strategy Overview

                20.1.3.5.1. Marketing Strategy

                20.1.3.5.2. Product Strategy

                20.1.3.5.3. Channel Strategy

        20.1.4. Christian Bürkert GmbH & Co. Kg

            20.1.4.1. Overview

            20.1.4.2. Product Portfolio

            20.1.4.3. Profitability by Market Segments

            20.1.4.4. Sales Footprint

            20.1.4.5. Strategy Overview

                20.1.4.5.1. Marketing Strategy

                20.1.4.5.2. Product Strategy

                20.1.4.5.3. Channel Strategy

        20.1.5. Cipriani Harrison Valves

            20.1.5.1. Overview

            20.1.5.2. Product Portfolio

            20.1.5.3. Profitability by Market Segments

            20.1.5.4. Sales Footprint

            20.1.5.5. Strategy Overview

                20.1.5.5.1. Marketing Strategy

                20.1.5.5.2. Product Strategy

                20.1.5.5.3. Channel Strategy

        20.1.6. Dft Inc.

            20.1.6.1. Overview

            20.1.6.2. Product Portfolio

            20.1.6.3. Profitability by Market Segments

            20.1.6.4. Sales Footprint

            20.1.6.5. Strategy Overview

                20.1.6.5.1. Marketing Strategy

                20.1.6.5.2. Product Strategy

                20.1.6.5.3. Channel Strategy

        20.1.7. Dixon Valve & Coupling Company, LLC

            20.1.7.1. Overview

            20.1.7.2. Product Portfolio

            20.1.7.3. Profitability by Market Segments

            20.1.7.4. Sales Footprint

            20.1.7.5. Strategy Overview

                20.1.7.5.1. Marketing Strategy

                20.1.7.5.2. Product Strategy

                20.1.7.5.3. Channel Strategy

        20.1.8. Donjoy Technology Co. Ltd.

            20.1.8.1. Overview

            20.1.8.2. Product Portfolio

            20.1.8.3. Profitability by Market Segments

            20.1.8.4. Sales Footprint

            20.1.8.5. Strategy Overview

                20.1.8.5.1. Marketing Strategy

                20.1.8.5.2. Product Strategy

                20.1.8.5.3. Channel Strategy

        20.1.9. Emerson Electric Co.

            20.1.9.1. Overview

            20.1.9.2. Product Portfolio

            20.1.9.3. Profitability by Market Segments

            20.1.9.4. Sales Footprint

            20.1.9.5. Strategy Overview

                20.1.9.5.1. Marketing Strategy

                20.1.9.5.2. Product Strategy

                20.1.9.5.3. Channel Strategy

        20.1.10. Evoguard GmbH

            20.1.10.1. Overview

            20.1.10.2. Product Portfolio

            20.1.10.3. Profitability by Market Segments

            20.1.10.4. Sales Footprint

            20.1.10.5. Strategy Overview

                20.1.10.5.1. Marketing Strategy

                20.1.10.5.2. Product Strategy

                20.1.10.5.3. Channel Strategy

        20.1.11. Flowserve Corporation

            20.1.11.1. Overview

            20.1.11.2. Product Portfolio

            20.1.11.3. Profitability by Market Segments

            20.1.11.4. Sales Footprint

            20.1.11.5. Strategy Overview

                20.1.11.5.1. Marketing Strategy

                20.1.11.5.2. Product Strategy

                20.1.11.5.3. Channel Strategy

        20.1.12. Gea Group Aktiengesellschaft

            20.1.12.1. Overview

            20.1.12.2. Product Portfolio

            20.1.12.3. Profitability by Market Segments

            20.1.12.4. Sales Footprint

            20.1.12.5. Strategy Overview

                20.1.12.5.1. Marketing Strategy

                20.1.12.5.2. Product Strategy

                20.1.12.5.3. Channel Strategy

        20.1.13. Gemü Group

            20.1.13.1. Overview

            20.1.13.2. Product Portfolio

            20.1.13.3. Profitability by Market Segments

            20.1.13.4. Sales Footprint

            20.1.13.5. Strategy Overview

                20.1.13.5.1. Marketing Strategy

                20.1.13.5.2. Product Strategy

                20.1.13.5.3. Channel Strategy

        20.1.14. Haitima Corporation

            20.1.14.1. Overview

            20.1.14.2. Product Portfolio

            20.1.14.3. Profitability by Market Segments

            20.1.14.4. Sales Footprint

            20.1.14.5. Strategy Overview

                20.1.14.5.1. Marketing Strategy

                20.1.14.5.2. Product Strategy

                20.1.14.5.3. Channel Strategy

        20.1.15. Hanningfield

            20.1.15.1. Overview

            20.1.15.2. Product Portfolio

            20.1.15.3. Profitability by Market Segments

            20.1.15.4. Sales Footprint

            20.1.15.5. Strategy Overview

                20.1.15.5.1. Marketing Strategy

                20.1.15.5.2. Product Strategy

                20.1.15.5.3. Channel Strategy

        20.1.16. Inoxpa S.A.U.

            20.1.16.1. Overview

            20.1.16.2. Product Portfolio

            20.1.16.3. Profitability by Market Segments

            20.1.16.4. Sales Footprint

            20.1.16.5. Strategy Overview

                20.1.16.5.1. Marketing Strategy

                20.1.16.5.2. Product Strategy

                20.1.16.5.3. Channel Strategy

        20.1.17. Joneng Valves Co. Ltd.

            20.1.17.1. Overview

            20.1.17.2. Product Portfolio

            20.1.17.3. Profitability by Market Segments

            20.1.17.4. Sales Footprint

            20.1.17.5. Strategy Overview

                20.1.17.5.1. Marketing Strategy

                20.1.17.5.2. Product Strategy

                20.1.17.5.3. Channel Strategy

        20.1.18. Kieselmann GmbH

            20.1.18.1. Overview

            20.1.18.2. Product Portfolio

            20.1.18.3. Profitability by Market Segments

            20.1.18.4. Sales Footprint

            20.1.18.5. Strategy Overview

                20.1.18.5.1. Marketing Strategy

                20.1.18.5.2. Product Strategy

                20.1.18.5.3. Channel Strategy

        20.1.19. Ksb Se & Co. KGaA

            20.1.19.1. Overview

            20.1.19.2. Product Portfolio

            20.1.19.3. Profitability by Market Segments

            20.1.19.4. Sales Footprint

            20.1.19.5. Strategy Overview

                20.1.19.5.1. Marketing Strategy

                20.1.19.5.2. Product Strategy

                20.1.19.5.3. Channel Strategy

21. Assumptions & Acronyms Used

22. Research Methodology

Recommendations

Industrial Automation

Industrial Valve Market

Published : March 2024

Industrial Automation

Drum Pump Market

Published : July 2023

Explore Industrial Automation Insights

View Reports

Hygienic Pump and Valve Market