Reports

- Global Locations -

Headquarters

Future Market Insights, Inc.

Christiana Corporate, 200
Continental Drive, Suite 401,
Newark, Delaware - 19713,
United States

T: +1-845-579-5705

Americas

Future Market Insights, Inc.

616 Corporate Way, Suite 2-9018,
Valley Cottage, NY 10989, United States

T: +1-347-918-3531

MEA

Future Market Insights

1602-6 Jumeirah Bay X2 Tower, Plot No: JLT-PH2-X2A,
Jumeirah Lakes Towers, Dubai,
United Arab Emirates

Europe

Future Market Insights

3rd Floor, 207 Regent Street,
W1B 3HH London
United Kingdom

T: + 44 (0) 20 8123 9659
D: +44 (0) 20 3287 4268

Asia Pacific

Future Market Insights

IndiaLand Global Tech Park, Unit UG-1, Behind Grand HighStreet, Phase 1, Hinjawadi, MH, Pune – 411057, India

ID Card Printer Market Outlook from 2024 to 2034

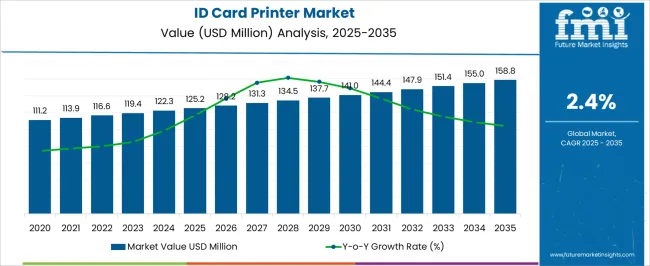
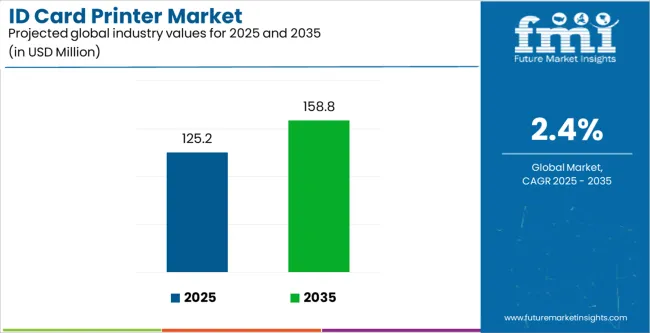
FMI recently published a new report on the ID card printer market. As per the analysis, ID card printer revenues hold a current valuation of US$ 122.3 million in 2024. ID card printer manufacturers can focus on innovations and digitization in the education sector in developing economies.

Reflecting on this, demand is slated to rise and equate to a market valuation of US$ 155.1 million, with a CAGR of 2.40% in the intervening period, by 2034.

Attributes Details
ID Card Printer Market Size, 2023 US$ 118.7 million
ID Card Printer Market Size, 2024 US$ 122.3 million
ID Card Printer Market Size, 2034 US$ 155.1 million
Value CAGR (2024 to 2034) 2.40%

Don't pay for what you don't need

Customize your report by selecting specific countries or regions and save 30%!

Key Market Highlights

Businesses can Leverage the Digital Empowerment in the Education Sector

With applications like access control, payment systems, and secure authentication, smart cards are being increasingly adopted. The development of smart card technology raises the demand for ID card printers that can encode and print these sophisticated cards.

Several businesses are ushering in a new era of digital solutions for various demographics. As such, in February 2024, LEO1, a prominent Edu-fintech business, launched India's first limitless prepaid student ID card in collaboration with NSDL Payments Bank and Mastercard as part of its Financial SAAS for Educational Institutions.

This unique card acts as a secure prepaid card and a student ID card, representing a significant breakthrough in digitizing financial transactions in educational institutions. Considering this development, businesses manufacturing ID card printers and edu-fintech firms can explore partnership opportunities.

Hybrid ID Card Printer Sales and Innovations Continue to Increase

Staying competitive in today's ever-changing corporate environment requires flexibility and adaptation. Organizations are coping with a wide range of printing demands with unprecedented flexibility using hybrid ID card printers that enable direct-to-card and retransfer printing processes. With the help of these printers, customers can select the best printing option depending on the card's security features, print quality, and durability.

Businesses can succeed in operations and sustainable development by using hybrid ID card printers to improve printing processes, optimize workflow efficiency, and adapt smoothly to changing business demands. Thus, demand for hybrid ID card printers is rising through both the customer-centric and commercial-centric avenues.

Rise of Unmanned Card Printing Kiosks Boosts Growth in the Market

In busy places like airports, colleges, and business campuses, unmanned card printing kiosks are becoming a popular self-service option for quick ID card issuance. These ID card design and printing kiosks eliminate the need for central printing facilities and shorten turnaround times by enabling customers to create and print ID cards immediately.

Organizations can boost accessibility, improve customer service, expedite the card issue process, and improve overall operational efficiency by using on-demand printing kiosks. Leveraging this potential, in April 2023, Nidec Instruments Corporation launched a new card-printing-issuing machine for unmanned kiosk terminals.

ID Card Printer Market Trends Analysis

  • Multi-dimensional, tactile ID cards with complex patterns and textures are being produced by implementing 3D printing technology in the ID card printing industry.
  • Manufacturers are investigating environmentally suitable substitutes for conventional PVC cards, such as polymers derived from biomass or substrates made of paper.
  • Materials science breakthroughs are making it possible to create incredibly thin and flexible card materials that are strong and lightweight, making them more attractive to consumers.
Ismail Sutaria
Ismail Sutaria

Principal Consultant

Talk to Analyst

Find your sweet spots for generating winning opportunities in this market.

ID Card Printer Market Opportunity Analysis

  • Businesses have the potential to incorporate developing technology into ID card printing solutions.
  • With heightened awareness of sustainability, manufacturers have the opportunity to grow demand with the help of sustainable and environmentally friendly printing solutions.
  • With an increased emphasis on accountability and identity verification, businesses can explore opportunities for providing specialist security services in addition to ID card printing options.
  • Transition to mobile and cloud-based technology is allowing organizations to deliver versatile and scalable ID card printing solutions.
  • Businesses have the opportunity to benefit by developing printers for ID cards that include contactless payment capabilities, loyalty programs, and interactive displays.

Comparative View of Markets Adjacent to ID Card Printer

This section compares the ID card printer market with the commercial printer market and the industrial printer market.

Rising investment in automation and technology is seeing commercial printers being adopted more frequently in offices. Digitization trends in industries are helping the progress of the indsutrial printer market.

ID Card Printer Market:

Attributes ID Card Printer Market
CAGR (2024 to 2034) 2.40%
Growth Factors
  • Growing security concerns in various sectors.
  • Rising adoption of smart cards
Future Opportunities Proliferation of cloud-computing-based ID card printing solutions
Market Trends Increasing sustainability trends

Commercial Printer Market:

Attributes Commercial Printer Market
CAGR (2024 to 2034) 2.3%
Growth Factors
  • Growing digitization of industries
  • Rising popularity of digital printing solutions
Future Opportunities Investments in automation and technology improvements
Market Trends Growing need for advertisements by businesses

Industrial Printer Market:

Attributes Industrial Printer Market
CAGR (2024 to 2034) 5.5%
Growth Factors
  • Growing adoption due to expansion of e-commerce sector
  • Rising demand from various end-use industries
Future Opportunities Increased demand for product labeling and packaging
Market Trends Advancements in commercial printing equipment

Get the data you need at a Fraction of the cost

Personalize your report by choosing insights you need
and save 40%!

Category-wise Insights

Double-side Card Printers Dominate as the Top Product Type

Segment Double-sided Card Printers (Product Type)
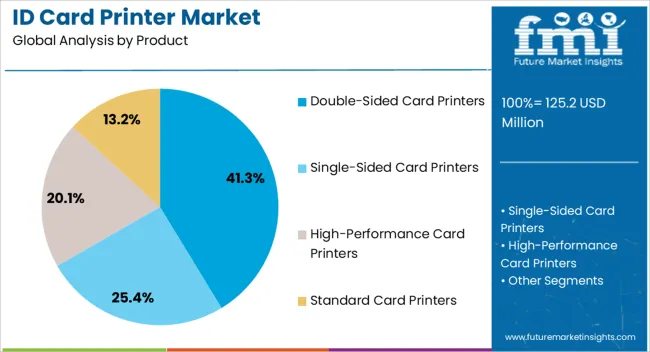
Value Share (2024) 41.30%

Based on product type, the double-sided card printers are set to occupy 41.30% of the product type segment in 2024. Multi-functional cards with extra features and capabilities are becoming popular as applications for ID cards evolve beyond basic identification. Organizations use double-sided card printers to embed magnetic stripes, smart card chips, or RFID technology on cards.

This makes them useful for a variety of purposes, including time monitoring, cashless payments, access control, and more. Double-sided ID card printers are thus becoming essential for businesses.

Direct-to-Direct Card Printer Gains Top Share as the Leading Technology

Segment Direct-to-Direct Card Printer (Technology)
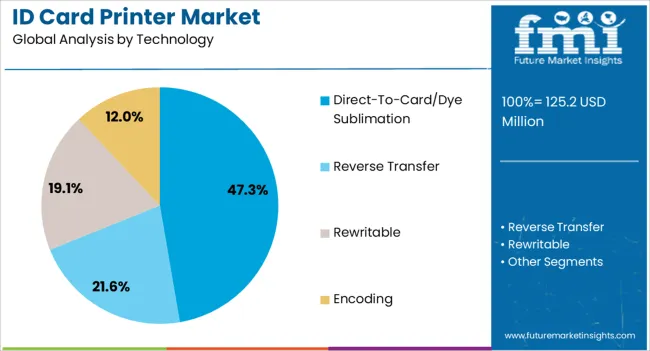
Value Share (2024) 47.30%

Direct-to-direct card printers under the technology segment are set to account for 47.30% of the ID card printer market share in 2024. Organizations are enamored of direct-to-card printers' ability to generate high-quality ID cards with speed and reliability. Direct-to-card printers are proving to be an excellent investment for companies and organizations that need to print large volumes of documents quickly and efficiently.

Country-wise Insights

Countries Value CAGR (2024 to 2034)
United States 0.7%
Germany 0.5%
Japan 1.9%
China 4.9%
India 5.4%

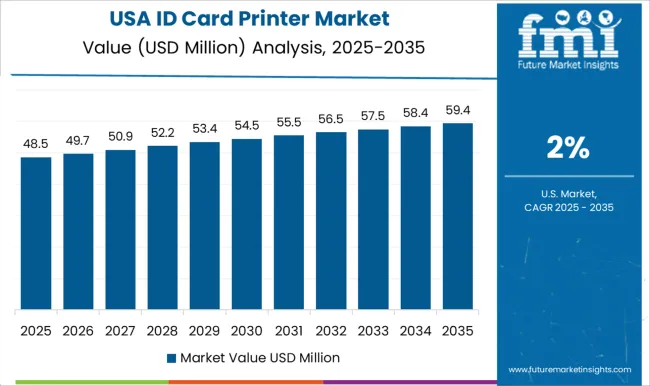
Increasing Adoption in Banking and Education Fuels Growth in the United States

The demand for ID card printers in the United States will surge at 0.7% CAGR through 2034. This growth is attributed to the surge in demand for ID card printers in banks and educational institutions, the dominance of top ID card printer manufacturers, and ongoing technological developments in card printer technology.

Since ID cards are required for several operations, including opening bank accounts, high-performance ID card printers with accessories are becoming more essential. In the United States, over 65% of individuals now own credit cards as a result of their greater disposable income. The banking sector's growing dependence on cashless transactions, such as credit and debit card usage, also sees demand rise.
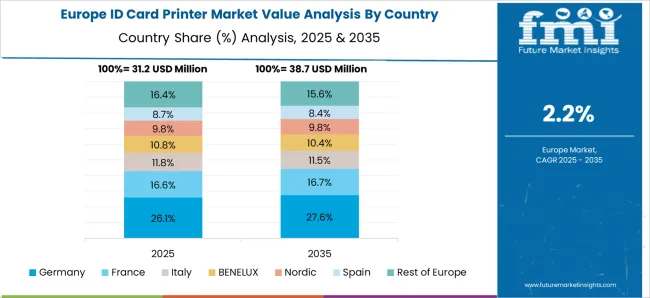
Higher Issuance of ID Cards for Smart City Initiatives Propels Sales in Germany

The sales of ID card printers in Germany are set to increase at 0.5% CAGR through 2034. The German government has provided 820 million euros in financing for model projects that are going to examine Smart City concepts and implementation procedures in German towns and cities.

ID card printers play a critical part in these projects by facilitating the issuing of smart cards for citizens, residents, and visitors. Smart cards have several applications, such as digital services, access control, and public transit, which help create smart cities. Incorporating ID card printers into smart city efforts allows manufacturers to offer customized solutions that cater to the changing requirements of metropolitan settings.
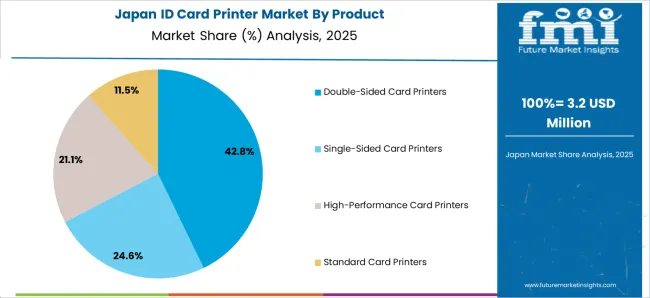
Emphasis on Trust and Security Bolsters Market Growth in Japan

The ID card printer market growth in Japan is estimated at 1.9% CAGR through 2034. ID card printers with advanced safety features and identification capabilities are in high demand in Japan due to the country's strong cultural focus on security, trust, and dependability.

To protect confidential data and stop illegal access, Japanese organizations prioritize security methods, including encryption, biometric authentication, and tamper-evident printing. Organizations looking to maintain integrity, trust, and compliance with laws like the Act on the Protection of Personal Information are particularly interested in ID card printers that can fulfill these strict security criteria.

Japan is set to gain biometric access and payment cards due to a partnership between IDEX Biometrics and KONA I. KONA I anticipates that in the second part of 2024, banks will start providing customers with new biometric ID cards.

Focus on Financial Inclusion and Digital Payments Drives Sales in China

ID card printer sales in China will amplify at 4.9% CAGR through 2034. Due to China's quest for economic integration and digital payments, ID card printers are experiencing more demand in the banking, fintech, and payments industries. To support digital transactions, account opening, and client verification, the country is moving toward a cashless society.

To achieve this, safe and trustworthy identity solutions are required. Financial institutions are looking to improve security, stop fraud, and offer seamless client experiences. As a result, they are demanding ID cards with biometric authentication, magnetic stripe encoding, and embedded EMV chips, necessitating the use of ID card printers.

Government Initiatives for Digital Identity Fuel Demand in India

The demand for ID card printers in India will surge at 5.9% CAGR through 2034. The Indian government has started various projects to improve access to public services and encourage digital identification. There is a high demand for ID card printers due to initiatives like Aadhaar and Digital India, which attempt to make India a digitally enabled nation. These printers are necessary to print voter ID cards, Aadhaar cards, and other government-issued documents and thus their demand in India is being fueled.

Competitive Landscape

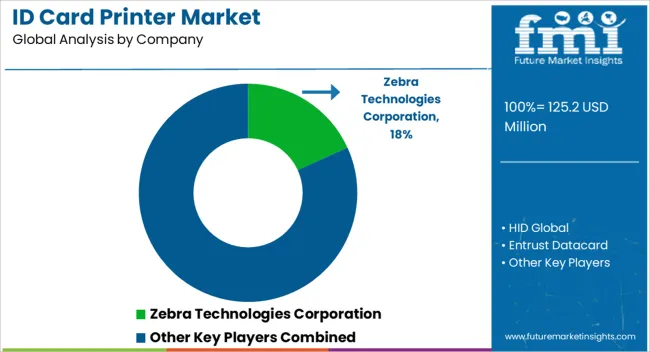
The ID card printer market is extremely competitive, with significant competitors such as HID Global, Zebra Technologies Corporation, and Datacard Group at the forefront. These firms invest in R&D to develop innovative technologies such as biometric authentication and cloud-based printing.

Niche firms such as Evolis and Magicard Ltd. concentrate on specialized applications, but local players and new entrants add variation. Pricing tactics, distribution networks, and after-sales assistance impact competitive dynamics and are essential for market penetration and customer satisfaction.

Recent Developments
  • In January 2024, Agfa, a renowned producer of inkjet printing solutions, introduced the next version of its Anapurna H3200 wide-format hybrid printer, representing a considerable improvement in print speed and quality.
  • In October 2023, Evolis, a leader in direct-to-card printing, introduced its retransfer card printer, which is entirely designed and built in its Beaucouzé facility in France. Evolis hopes to raise its market share by 20% in four years with this new product.
  • Also in October 2023, Canon Canada Inc., a pioneer in digital imaging solutions, introduced a dependable line of inkjet card printers and thermal retransfer card printers for easy on-demand printing.

Key Players in the ID Card Printer Market

  • HID Global
  • Zebra Technologies Corporation
  • Datacard Group
  • Evolis
  • Entrust Datacard
  • Magicard Ltd.
  • Nisca Corporation
  • Matica Technologies AG
  • Fargo Electronics (a subsidiary of HID Global)
  • AlphaCard
  • Polaroid Corporation
  • Swiftcolor
  • NBS Technologies
  • CardPresso
  • CIM USA

Key Coverage in the ID Card Printer Market Report

  • Adjacent Study on the ID Card Printer and Media Market, Card Printer Market, Smart Card Printer Market, and Direct-to-Direct ID Card Printer Market
  • PVC Card Printer Demand in India Analysis
  • Top Manufacturers and Suppliers of Smart ID Card Printers
  • ID Card Printer Market Share, Size, and Forecast Report
  • Global Market Study on ID Card Printers

ID Card Printer Market Segmentation

By Product:

  • Single-sided Card Printers
  • Double-sided Card Printers
  • High-performance Card Printers
  • Standard Card Printers

By Technology:

  • Reverse Transfer
  • Direct-to-Card/Dye Sublimation
  • Rewritable
  • Encoding

By Sales Channel:

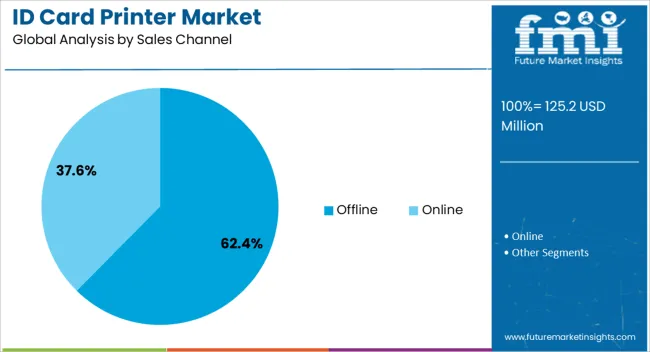
  • Offline
  • Online

By End User:

  • Industrial/Manufacturing
  • Banking
  • Healthcare
  • Government Institutions
  • Educational Institutions

By Region:

  • North America
  • Latin America
  • Western Europe
  • Eastern Europe
  • Asia Pacific (APAC)
  • Middle East & Africa (MEA)
  • Japan

Frequently Asked Questions

What is the ID Card Printer Market Worth?

The ID card printer market is valued at US$ 122.3 million in 2024.

What is the Projected CAGR of the ID Card Printer Market?

The ID card printer market size is estimated to increase at 2.40% CAGR through 2034.

What is the Future Stance for the ID Card Printer Market?

The ID card printer market is expected to be worth US$ 155.1 million by 2034.

Which is the Preferred Product in the ID Card Printer Market?

Double-sided card printers are highly preferred in the market.

Which Country Has High Growth Potential in the ID Card Printer Market?

The Indian ID card printer market is predicted to expand at a 5.9% CAGR through 2034.

Table of Content

1. Executive Summary

    1.1. Global Market Outlook

    1.2. Demand-side Trends

    1.3. Supply-side Trends

    1.4. Technology Roadmap Analysis

    1.5. Analysis and Recommendations

2. Market Overview

    2.1. Market Coverage / Taxonomy

    2.2. Market Definition / Scope / Limitations

3. Market Background

    3.1. Market Dynamics

        3.1.1. Drivers

        3.1.2. Restraints

        3.1.3. Opportunity

        3.1.4. Trends

    3.2. Scenario Forecast

        3.2.1. Demand in Optimistic Scenario

        3.2.2. Demand in Likely Scenario

        3.2.3. Demand in Conservative Scenario

    3.3. Opportunity Map Analysis

    3.4. Product Life Cycle Analysis

    3.5. Supply Chain Analysis

        3.5.1. Supply Side Participants and their Roles

            3.5.1.1. Manufacturer

            3.5.1.2. Mid-Level Participants

            3.5.1.3. Wholesalers and Distributors

        3.5.2. Value Added and Value Created at Node in the Supply Chain

        3.5.3. List of Raw Material Suppliers

        3.5.4. List of Existing and Potential Buyer’s

    3.6. Investment Feasibility Matrix

    3.7. Value Chain Analysis

        3.7.1. Profit Margin Analysis

    3.8. PESTLE and Porter’s Analysis

    3.9. Regulatory Landscape

        3.9.1. By Key Regions

        3.9.2. By Key Countries

    3.10. Regional Parent Market Outlook

    3.11. Production and Consumption Statistics

    3.12. Import and Export Statistics

4. Global Market Analysis 2019 to 2023 and Forecast, 2024 to 2034

    4.1. Historical Market Size Value (US$ Million) & Volume (Units) Analysis, 2019 to 2023

    4.2. Current and Future Market Size Value (US$ Million) & Volume (Units) Projections, 2024 to 2034

        4.2.1. Y-o-Y Growth Trend Analysis

        4.2.2. Absolute $ Opportunity Analysis

5. Global Market Analysis 2019 to 2023 and Forecast 2024 to 2034, By Product

    5.1. Introduction / Key Findings

    5.2. Historical Market Size Value (US$ Million) & Volume (Units) Analysis By Product, 2019 to 2023

    5.3. Current and Future Market Size Value (US$ Million) & Volume (Units) Analysis and Forecast By Product, 2024 to 2034

        5.3.1. Single-sided Card Printers

        5.3.2. Double-sided Card Printers

        5.3.3. High-performance Card Printers

        5.3.4. Standard Card Printers

    5.4. Y-o-Y Growth Trend Analysis By Product, 2019 to 2023

    5.5. Absolute $ Opportunity Analysis By Product, 2024 to 2034

6. Global Market Analysis 2019 to 2023 and Forecast 2024 to 2034, By Technology

    6.1. Introduction / Key Findings

    6.2. Historical Market Size Value (US$ Million) & Volume (Units) Analysis By Technology, 2019 to 2023

    6.3. Current and Future Market Size Value (US$ Million) & Volume (Units) Analysis and Forecast By Technology, 2024 to 2034

        6.3.1. Reverse Transfer

        6.3.2. Direct-to-Card/Dye Sublimation

        6.3.3. Rewritable

        6.3.4. Encoding

    6.4. Y-o-Y Growth Trend Analysis By Technology, 2019 to 2023

    6.5. Absolute $ Opportunity Analysis By Technology, 2024 to 2034

7. Global Market Analysis 2019 to 2023 and Forecast 2024 to 2034, By Sales Channel

    7.1. Introduction / Key Findings

    7.2. Historical Market Size Value (US$ Million) & Volume (Units) Analysis By Sales Channel, 2019 to 2023

    7.3. Current and Future Market Size Value (US$ Million) & Volume (Units) Analysis and Forecast By Sales Channel, 2024 to 2034

        7.3.1. Offline

        7.3.2. Online

    7.4. Y-o-Y Growth Trend Analysis By Sales Channel, 2019 to 2023

    7.5. Absolute $ Opportunity Analysis By Sales Channel, 2024 to 2034

8. Global Market Analysis 2019 to 2023 and Forecast 2024 to 2034, By End User

    8.1. Introduction / Key Findings

    8.2. Historical Market Size Value (US$ Million) & Volume (Units) Analysis By End User, 2019 to 2023

    8.3. Current and Future Market Size Value (US$ Million) & Volume (Units) Analysis and Forecast By End User, 2024 to 2034

        8.3.1. Industrial/Manufacturing

        8.3.2. Banking

        8.3.3. Healthcare

        8.3.4. Government Institutions

        8.3.5. Educational Institutions

    8.4. Y-o-Y Growth Trend Analysis By End User, 2019 to 2023

    8.5. Absolute $ Opportunity Analysis By End User, 2024 to 2034

9. Global Market Analysis 2019 to 2023 and Forecast 2024 to 2034, By Region

    9.1. Introduction

    9.2. Historical Market Size Value (US$ Million) & Volume (Units) Analysis By Region, 2019 to 2023

    9.3. Current Market Size Value (US$ Million) & Volume (Units) Analysis and Forecast By Region, 2024 to 2034

        9.3.1. North America

        9.3.2. Latin America

        9.3.3. Western Europe

        9.3.4. Eastern Europe

        9.3.5. South Asia and Pacific

        9.3.6. East Asia

        9.3.7. Middle East and Africa

    9.4. Market Attractiveness Analysis By Region

10. North America Market Analysis 2019 to 2023 and Forecast 2024 to 2034, By Country

    10.1. Historical Market Size Value (US$ Million) & Volume (Units) Trend Analysis By Market Taxonomy, 2019 to 2023

    10.2. Market Size Value (US$ Million) & Volume (Units) Forecast By Market Taxonomy, 2024 to 2034

        10.2.1. By Country

            10.2.1.1. USA

            10.2.1.2. Canada

        10.2.2. By Product

        10.2.3. By Technology

        10.2.4. By Sales Channel

        10.2.5. By End User

    10.3. Market Attractiveness Analysis

        10.3.1. By Country

        10.3.2. By Product

        10.3.3. By Technology

        10.3.4. By Sales Channel

        10.3.5. By End User

    10.4. Key Takeaways

11. Latin America Market Analysis 2019 to 2023 and Forecast 2024 to 2034, By Country

    11.1. Historical Market Size Value (US$ Million) & Volume (Units) Trend Analysis By Market Taxonomy, 2019 to 2023

    11.2. Market Size Value (US$ Million) & Volume (Units) Forecast By Market Taxonomy, 2024 to 2034

        11.2.1. By Country

            11.2.1.1. Brazil

            11.2.1.2. Mexico

            11.2.1.3. Rest of Latin America

        11.2.2. By Product

        11.2.3. By Technology

        11.2.4. By Sales Channel

        11.2.5. By End User

    11.3. Market Attractiveness Analysis

        11.3.1. By Country

        11.3.2. By Product

        11.3.3. By Technology

        11.3.4. By Sales Channel

        11.3.5. By End User

    11.4. Key Takeaways

12. Western Europe Market Analysis 2019 to 2023 and Forecast 2024 to 2034, By Country

    12.1. Historical Market Size Value (US$ Million) & Volume (Units) Trend Analysis By Market Taxonomy, 2019 to 2023

    12.2. Market Size Value (US$ Million) & Volume (Units) Forecast By Market Taxonomy, 2024 to 2034

        12.2.1. By Country

            12.2.1.1. Germany

            12.2.1.2. UK

            12.2.1.3. France

            12.2.1.4. Spain

            12.2.1.5. Italy

            12.2.1.6. Rest of Western Europe

        12.2.2. By Product

        12.2.3. By Technology

        12.2.4. By Sales Channel

        12.2.5. By End User

    12.3. Market Attractiveness Analysis

        12.3.1. By Country

        12.3.2. By Product

        12.3.3. By Technology

        12.3.4. By Sales Channel

        12.3.5. By End User

    12.4. Key Takeaways

13. Eastern Europe Market Analysis 2019 to 2023 and Forecast 2024 to 2034, By Country

    13.1. Historical Market Size Value (US$ Million) & Volume (Units) Trend Analysis By Market Taxonomy, 2019 to 2023

    13.2. Market Size Value (US$ Million) & Volume (Units) Forecast By Market Taxonomy, 2024 to 2034

        13.2.1. By Country

            13.2.1.1. Poland

            13.2.1.2. Russia

            13.2.1.3. Czech Republic

            13.2.1.4. Romania

            13.2.1.5. Rest of Eastern Europe

        13.2.2. By Product

        13.2.3. By Technology

        13.2.4. By Sales Channel

        13.2.5. By End User

    13.3. Market Attractiveness Analysis

        13.3.1. By Country

        13.3.2. By Product

        13.3.3. By Technology

        13.3.4. By Sales Channel

        13.3.5. By End User

    13.4. Key Takeaways

14. South Asia and Pacific Market Analysis 2019 to 2023 and Forecast 2024 to 2034, By Country

    14.1. Historical Market Size Value (US$ Million) & Volume (Units) Trend Analysis By Market Taxonomy, 2019 to 2023

    14.2. Market Size Value (US$ Million) & Volume (Units) Forecast By Market Taxonomy, 2024 to 2034

        14.2.1. By Country

            14.2.1.1. India

            14.2.1.2. Bangladesh

            14.2.1.3. Australia

            14.2.1.4. New Zealand

            14.2.1.5. Rest of South Asia and Pacific

        14.2.2. By Product

        14.2.3. By Technology

        14.2.4. By Sales Channel

        14.2.5. By End User

    14.3. Market Attractiveness Analysis

        14.3.1. By Country

        14.3.2. By Product

        14.3.3. By Technology

        14.3.4. By Sales Channel

        14.3.5. By End User

    14.4. Key Takeaways

15. East Asia Market Analysis 2019 to 2023 and Forecast 2024 to 2034, By Country

    15.1. Historical Market Size Value (US$ Million) & Volume (Units) Trend Analysis By Market Taxonomy, 2019 to 2023

    15.2. Market Size Value (US$ Million) & Volume (Units) Forecast By Market Taxonomy, 2024 to 2034

        15.2.1. By Country

            15.2.1.1. China

            15.2.1.2. Japan

            15.2.1.3. South Korea

        15.2.2. By Product

        15.2.3. By Technology

        15.2.4. By Sales Channel

        15.2.5. By End User

    15.3. Market Attractiveness Analysis

        15.3.1. By Country

        15.3.2. By Product

        15.3.3. By Technology

        15.3.4. By Sales Channel

        15.3.5. By End User

    15.4. Key Takeaways

16. Middle East and Africa Market Analysis 2019 to 2023 and Forecast 2024 to 2034, By Country

    16.1. Historical Market Size Value (US$ Million) & Volume (Units) Trend Analysis By Market Taxonomy, 2019 to 2023

    16.2. Market Size Value (US$ Million) & Volume (Units) Forecast By Market Taxonomy, 2024 to 2034

        16.2.1. By Country

            16.2.1.1. GCC Countries

            16.2.1.2. South Africa

            16.2.1.3. Israel

            16.2.1.4. Rest of MEA

        16.2.2. By Product

        16.2.3. By Technology

        16.2.4. By Sales Channel

        16.2.5. By End User

    16.3. Market Attractiveness Analysis

        16.3.1. By Country

        16.3.2. By Product

        16.3.3. By Technology

        16.3.4. By Sales Channel

        16.3.5. By End User

    16.4. Key Takeaways

17. Key Countries Market Analysis

    17.1. USA

        17.1.1. Pricing Analysis

        17.1.2. Market Share Analysis, 2023

            17.1.2.1. By Product

            17.1.2.2. By Technology

            17.1.2.3. By Sales Channel

            17.1.2.4. By End User

    17.2. Canada

        17.2.1. Pricing Analysis

        17.2.2. Market Share Analysis, 2023

            17.2.2.1. By Product

            17.2.2.2. By Technology

            17.2.2.3. By Sales Channel

            17.2.2.4. By End User

    17.3. Brazil

        17.3.1. Pricing Analysis

        17.3.2. Market Share Analysis, 2023

            17.3.2.1. By Product

            17.3.2.2. By Technology

            17.3.2.3. By Sales Channel

            17.3.2.4. By End User

    17.4. Mexico

        17.4.1. Pricing Analysis

        17.4.2. Market Share Analysis, 2023

            17.4.2.1. By Product

            17.4.2.2. By Technology

            17.4.2.3. By Sales Channel

            17.4.2.4. By End User

    17.5. Germany

        17.5.1. Pricing Analysis

        17.5.2. Market Share Analysis, 2023

            17.5.2.1. By Product

            17.5.2.2. By Technology

            17.5.2.3. By Sales Channel

            17.5.2.4. By End User

    17.6. UK

        17.6.1. Pricing Analysis

        17.6.2. Market Share Analysis, 2023

            17.6.2.1. By Product

            17.6.2.2. By Technology

            17.6.2.3. By Sales Channel

            17.6.2.4. By End User

    17.7. France

        17.7.1. Pricing Analysis

        17.7.2. Market Share Analysis, 2023

            17.7.2.1. By Product

            17.7.2.2. By Technology

            17.7.2.3. By Sales Channel

            17.7.2.4. By End User

    17.8. Spain

        17.8.1. Pricing Analysis

        17.8.2. Market Share Analysis, 2023

            17.8.2.1. By Product

            17.8.2.2. By Technology

            17.8.2.3. By Sales Channel

            17.8.2.4. By End User

    17.9. Italy

        17.9.1. Pricing Analysis

        17.9.2. Market Share Analysis, 2023

            17.9.2.1. By Product

            17.9.2.2. By Technology

            17.9.2.3. By Sales Channel

            17.9.2.4. By End User

    17.10. Poland

        17.10.1. Pricing Analysis

        17.10.2. Market Share Analysis, 2023

            17.10.2.1. By Product

            17.10.2.2. By Technology

            17.10.2.3. By Sales Channel

            17.10.2.4. By End User

    17.11. Russia

        17.11.1. Pricing Analysis

        17.11.2. Market Share Analysis, 2023

            17.11.2.1. By Product

            17.11.2.2. By Technology

            17.11.2.3. By Sales Channel

            17.11.2.4. By End User

    17.12. Czech Republic

        17.12.1. Pricing Analysis

        17.12.2. Market Share Analysis, 2023

            17.12.2.1. By Product

            17.12.2.2. By Technology

            17.12.2.3. By Sales Channel

            17.12.2.4. By End User

    17.13. Romania

        17.13.1. Pricing Analysis

        17.13.2. Market Share Analysis, 2023

            17.13.2.1. By Product

            17.13.2.2. By Technology

            17.13.2.3. By Sales Channel

            17.13.2.4. By End User

    17.14. India

        17.14.1. Pricing Analysis

        17.14.2. Market Share Analysis, 2023

            17.14.2.1. By Product

            17.14.2.2. By Technology

            17.14.2.3. By Sales Channel

            17.14.2.4. By End User

    17.15. Bangladesh

        17.15.1. Pricing Analysis

        17.15.2. Market Share Analysis, 2023

            17.15.2.1. By Product

            17.15.2.2. By Technology

            17.15.2.3. By Sales Channel

            17.15.2.4. By End User

    17.16. Australia

        17.16.1. Pricing Analysis

        17.16.2. Market Share Analysis, 2023

            17.16.2.1. By Product

            17.16.2.2. By Technology

            17.16.2.3. By Sales Channel

            17.16.2.4. By End User

    17.17. New Zealand

        17.17.1. Pricing Analysis

        17.17.2. Market Share Analysis, 2023

            17.17.2.1. By Product

            17.17.2.2. By Technology

            17.17.2.3. By Sales Channel

            17.17.2.4. By End User

    17.18. China

        17.18.1. Pricing Analysis

        17.18.2. Market Share Analysis, 2023

            17.18.2.1. By Product

            17.18.2.2. By Technology

            17.18.2.3. By Sales Channel

            17.18.2.4. By End User

    17.19. Japan

        17.19.1. Pricing Analysis

        17.19.2. Market Share Analysis, 2023

            17.19.2.1. By Product

            17.19.2.2. By Technology

            17.19.2.3. By Sales Channel

            17.19.2.4. By End User

    17.20. South Korea

        17.20.1. Pricing Analysis

        17.20.2. Market Share Analysis, 2023

            17.20.2.1. By Product

            17.20.2.2. By Technology

            17.20.2.3. By Sales Channel

            17.20.2.4. By End User

    17.21. GCC Countries

        17.21.1. Pricing Analysis

        17.21.2. Market Share Analysis, 2023

            17.21.2.1. By Product

            17.21.2.2. By Technology

            17.21.2.3. By Sales Channel

            17.21.2.4. By End User

    17.22. South Africa

        17.22.1. Pricing Analysis

        17.22.2. Market Share Analysis, 2023

            17.22.2.1. By Product

            17.22.2.2. By Technology

            17.22.2.3. By Sales Channel

            17.22.2.4. By End User

    17.23. Israel

        17.23.1. Pricing Analysis

        17.23.2. Market Share Analysis, 2023

            17.23.2.1. By Product

            17.23.2.2. By Technology

            17.23.2.3. By Sales Channel

            17.23.2.4. By End User

18. Market Structure Analysis

    18.1. Competition Dashboard

    18.2. Competition Benchmarking

    18.3. Market Share Analysis of Top Players

        18.3.1. By Regional

        18.3.2. By Product

        18.3.3. By Technology

        18.3.4. By Sales Channel

        18.3.5. By End User

19. Competition Analysis

    19.1. Competition Deep Dive

        19.1.1. Zebra Technologies Corporation

            19.1.1.1. Overview

            19.1.1.2. Product Portfolio

            19.1.1.3. Profitability by Market Segments

            19.1.1.4. Sales Footprint

            19.1.1.5. Strategy Overview

                19.1.1.5.1. Marketing Strategy

                19.1.1.5.2. Product Strategy

                19.1.1.5.3. Channel Strategy

        19.1.2. Evolis

            19.1.2.1. Overview

            19.1.2.2. Product Portfolio

            19.1.2.3. Profitability by Market Segments

            19.1.2.4. Sales Footprint

            19.1.2.5. Strategy Overview

                19.1.2.5.1. Marketing Strategy

                19.1.2.5.2. Product Strategy

                19.1.2.5.3. Channel Strategy

        19.1.3. HP Development Company

            19.1.3.1. Overview

            19.1.3.2. Product Portfolio

            19.1.3.3. Profitability by Market Segments

            19.1.3.4. Sales Footprint

            19.1.3.5. Strategy Overview

                19.1.3.5.1. Marketing Strategy

                19.1.3.5.2. Product Strategy

                19.1.3.5.3. Channel Strategy

        19.1.4. HID Global Corporation

            19.1.4.1. Overview

            19.1.4.2. Product Portfolio

            19.1.4.3. Profitability by Market Segments

            19.1.4.4. Sales Footprint

            19.1.4.5. Strategy Overview

                19.1.4.5.1. Marketing Strategy

                19.1.4.5.2. Product Strategy

                19.1.4.5.3. Channel Strategy

        19.1.5. Entrust Corporation

            19.1.5.1. Overview

            19.1.5.2. Product Portfolio

            19.1.5.3. Profitability by Market Segments

            19.1.5.4. Sales Footprint

            19.1.5.5. Strategy Overview

                19.1.5.5.1. Marketing Strategy

                19.1.5.5.2. Product Strategy

                19.1.5.5.3. Channel Strategy

        19.1.6. Kanematsu USA Inc.

            19.1.6.1. Overview

            19.1.6.2. Product Portfolio

            19.1.6.3. Profitability by Market Segments

            19.1.6.4. Sales Footprint

            19.1.6.5. Strategy Overview

                19.1.6.5.1. Marketing Strategy

                19.1.6.5.2. Product Strategy

                19.1.6.5.3. Channel Strategy

        19.1.7. Magicard NEO

            19.1.7.1. Overview

            19.1.7.2. Product Portfolio

            19.1.7.3. Profitability by Market Segments

            19.1.7.4. Sales Footprint

            19.1.7.5. Strategy Overview

                19.1.7.5.1. Marketing Strategy

                19.1.7.5.2. Product Strategy

                19.1.7.5.3. Channel Strategy

        19.1.8. Seiko Epson Corporation

            19.1.8.1. Overview

            19.1.8.2. Product Portfolio

            19.1.8.3. Profitability by Market Segments

            19.1.8.4. Sales Footprint

            19.1.8.5. Strategy Overview

                19.1.8.5.1. Marketing Strategy

                19.1.8.5.2. Product Strategy

                19.1.8.5.3. Channel Strategy

        19.1.9. IDP Corp

            19.1.9.1. Overview

            19.1.9.2. Product Portfolio

            19.1.9.3. Profitability by Market Segments

            19.1.9.4. Sales Footprint

            19.1.9.5. Strategy Overview

                19.1.9.5.1. Marketing Strategy

                19.1.9.5.2. Product Strategy

                19.1.9.5.3. Channel Strategy

        19.1.10. DASCOM Americas Corporation

            19.1.10.1. Overview

            19.1.10.2. Product Portfolio

            19.1.10.3. Profitability by Market Segments

            19.1.10.4. Sales Footprint

            19.1.10.5. Strategy Overview

                19.1.10.5.1. Marketing Strategy

                19.1.10.5.2. Product Strategy

                19.1.10.5.3. Channel Strategy

        19.1.11. Canon Inc.

            19.1.11.1. Overview

            19.1.11.2. Product Portfolio

            19.1.11.3. Profitability by Market Segments

            19.1.11.4. Sales Footprint

            19.1.11.5. Strategy Overview

                19.1.11.5.1. Marketing Strategy

                19.1.11.5.2. Product Strategy

                19.1.11.5.3. Channel Strategy

20. Assumptions & Acronyms Used

21. Research Methodology

List of Tables

Table 1: Global Market Value (US$ Million) Forecast by Region, 2019 to 2034

Table 2: Global Market Volume (Units) Forecast by Region, 2019 to 2034

Table 3: Global Market Value (US$ Million) Forecast by Product, 2019 to 2034

Table 4: Global Market Volume (Units) Forecast by Product, 2019 to 2034

Table 5: Global Market Value (US$ Million) Forecast by Technology, 2019 to 2034

Table 6: Global Market Volume (Units) Forecast by Technology, 2019 to 2034

Table 7: Global Market Value (US$ Million) Forecast by Sales Channel, 2019 to 2034

Table 8: Global Market Volume (Units) Forecast by Sales Channel, 2019 to 2034

Table 9: Global Market Value (US$ Million) Forecast by End User, 2019 to 2034

Table 10: Global Market Volume (Units) Forecast by End User, 2019 to 2034

Table 11: North America Market Value (US$ Million) Forecast by Country, 2019 to 2034

Table 12: North America Market Volume (Units) Forecast by Country, 2019 to 2034

Table 13: North America Market Value (US$ Million) Forecast by Product, 2019 to 2034

Table 14: North America Market Volume (Units) Forecast by Product, 2019 to 2034

Table 15: North America Market Value (US$ Million) Forecast by Technology, 2019 to 2034

Table 16: North America Market Volume (Units) Forecast by Technology, 2019 to 2034

Table 17: North America Market Value (US$ Million) Forecast by Sales Channel, 2019 to 2034

Table 18: North America Market Volume (Units) Forecast by Sales Channel, 2019 to 2034

Table 19: North America Market Value (US$ Million) Forecast by End User, 2019 to 2034

Table 20: North America Market Volume (Units) Forecast by End User, 2019 to 2034

Table 21: Latin America Market Value (US$ Million) Forecast by Country, 2019 to 2034

Table 22: Latin America Market Volume (Units) Forecast by Country, 2019 to 2034

Table 23: Latin America Market Value (US$ Million) Forecast by Product, 2019 to 2034

Table 24: Latin America Market Volume (Units) Forecast by Product, 2019 to 2034

Table 25: Latin America Market Value (US$ Million) Forecast by Technology, 2019 to 2034

Table 26: Latin America Market Volume (Units) Forecast by Technology, 2019 to 2034

Table 27: Latin America Market Value (US$ Million) Forecast by Sales Channel, 2019 to 2034

Table 28: Latin America Market Volume (Units) Forecast by Sales Channel, 2019 to 2034

Table 29: Latin America Market Value (US$ Million) Forecast by End User, 2019 to 2034

Table 30: Latin America Market Volume (Units) Forecast by End User, 2019 to 2034

Table 31: Western Europe Market Value (US$ Million) Forecast by Country, 2019 to 2034

Table 32: Western Europe Market Volume (Units) Forecast by Country, 2019 to 2034

Table 33: Western Europe Market Value (US$ Million) Forecast by Product, 2019 to 2034

Table 34: Western Europe Market Volume (Units) Forecast by Product, 2019 to 2034

Table 35: Western Europe Market Value (US$ Million) Forecast by Technology, 2019 to 2034

Table 36: Western Europe Market Volume (Units) Forecast by Technology, 2019 to 2034

Table 37: Western Europe Market Value (US$ Million) Forecast by Sales Channel, 2019 to 2034

Table 38: Western Europe Market Volume (Units) Forecast by Sales Channel, 2019 to 2034

Table 39: Western Europe Market Value (US$ Million) Forecast by End User, 2019 to 2034

Table 40: Western Europe Market Volume (Units) Forecast by End User, 2019 to 2034

Table 41: Eastern Europe Market Value (US$ Million) Forecast by Country, 2019 to 2034

Table 42: Eastern Europe Market Volume (Units) Forecast by Country, 2019 to 2034

Table 43: Eastern Europe Market Value (US$ Million) Forecast by Product, 2019 to 2034

Table 44: Eastern Europe Market Volume (Units) Forecast by Product, 2019 to 2034

Table 45: Eastern Europe Market Value (US$ Million) Forecast by Technology, 2019 to 2034

Table 46: Eastern Europe Market Volume (Units) Forecast by Technology, 2019 to 2034

Table 47: Eastern Europe Market Value (US$ Million) Forecast by Sales Channel, 2019 to 2034

Table 48: Eastern Europe Market Volume (Units) Forecast by Sales Channel, 2019 to 2034

Table 49: Eastern Europe Market Value (US$ Million) Forecast by End User, 2019 to 2034

Table 50: Eastern Europe Market Volume (Units) Forecast by End User, 2019 to 2034

Table 51: South Asia and Pacific Market Value (US$ Million) Forecast by Country, 2019 to 2034

Table 52: South Asia and Pacific Market Volume (Units) Forecast by Country, 2019 to 2034

Table 53: South Asia and Pacific Market Value (US$ Million) Forecast by Product, 2019 to 2034

Table 54: South Asia and Pacific Market Volume (Units) Forecast by Product, 2019 to 2034

Table 55: South Asia and Pacific Market Value (US$ Million) Forecast by Technology, 2019 to 2034

Table 56: South Asia and Pacific Market Volume (Units) Forecast by Technology, 2019 to 2034

Table 57: South Asia and Pacific Market Value (US$ Million) Forecast by Sales Channel, 2019 to 2034

Table 58: South Asia and Pacific Market Volume (Units) Forecast by Sales Channel, 2019 to 2034

Table 59: South Asia and Pacific Market Value (US$ Million) Forecast by End User, 2019 to 2034

Table 60: South Asia and Pacific Market Volume (Units) Forecast by End User, 2019 to 2034

Table 61: East Asia Market Value (US$ Million) Forecast by Country, 2019 to 2034

Table 62: East Asia Market Volume (Units) Forecast by Country, 2019 to 2034

Table 63: East Asia Market Value (US$ Million) Forecast by Product, 2019 to 2034

Table 64: East Asia Market Volume (Units) Forecast by Product, 2019 to 2034

Table 65: East Asia Market Value (US$ Million) Forecast by Technology, 2019 to 2034

Table 66: East Asia Market Volume (Units) Forecast by Technology, 2019 to 2034

Table 67: East Asia Market Value (US$ Million) Forecast by Sales Channel, 2019 to 2034

Table 68: East Asia Market Volume (Units) Forecast by Sales Channel, 2019 to 2034

Table 69: East Asia Market Value (US$ Million) Forecast by End User, 2019 to 2034

Table 70: East Asia Market Volume (Units) Forecast by End User, 2019 to 2034

Table 71: Middle East and Africa Market Value (US$ Million) Forecast by Country, 2019 to 2034

Table 72: Middle East and Africa Market Volume (Units) Forecast by Country, 2019 to 2034

Table 73: Middle East and Africa Market Value (US$ Million) Forecast by Product, 2019 to 2034

Table 74: Middle East and Africa Market Volume (Units) Forecast by Product, 2019 to 2034

Table 75: Middle East and Africa Market Value (US$ Million) Forecast by Technology, 2019 to 2034

Table 76: Middle East and Africa Market Volume (Units) Forecast by Technology, 2019 to 2034

Table 77: Middle East and Africa Market Value (US$ Million) Forecast by Sales Channel, 2019 to 2034

Table 78: Middle East and Africa Market Volume (Units) Forecast by Sales Channel, 2019 to 2034

Table 79: Middle East and Africa Market Value (US$ Million) Forecast by End User, 2019 to 2034

Table 80: Middle East and Africa Market Volume (Units) Forecast by End User, 2019 to 2034

List of Charts

Figure 1: Global Market Value (US$ Million) by Product, 2024 to 2034

Figure 2: Global Market Value (US$ Million) by Technology, 2024 to 2034

Figure 3: Global Market Value (US$ Million) by Sales Channel, 2024 to 2034

Figure 4: Global Market Value (US$ Million) by End User, 2024 to 2034

Figure 5: Global Market Value (US$ Million) by Region, 2024 to 2034

Figure 6: Global Market Value (US$ Million) Analysis by Region, 2019 to 2034

Figure 7: Global Market Volume (Units) Analysis by Region, 2019 to 2034

Figure 8: Global Market Value Share (%) and BPS Analysis by Region, 2024 to 2034

Figure 9: Global Market Y-o-Y Growth (%) Projections by Region, 2024 to 2034

Figure 10: Global Market Value (US$ Million) Analysis by Product, 2019 to 2034

Figure 11: Global Market Volume (Units) Analysis by Product, 2019 to 2034

Figure 12: Global Market Value Share (%) and BPS Analysis by Product, 2024 to 2034

Figure 13: Global Market Y-o-Y Growth (%) Projections by Product, 2024 to 2034

Figure 14: Global Market Value (US$ Million) Analysis by Technology, 2019 to 2034

Figure 15: Global Market Volume (Units) Analysis by Technology, 2019 to 2034

Figure 16: Global Market Value Share (%) and BPS Analysis by Technology, 2024 to 2034

Figure 17: Global Market Y-o-Y Growth (%) Projections by Technology, 2024 to 2034

Figure 18: Global Market Value (US$ Million) Analysis by Sales Channel, 2019 to 2034

Figure 19: Global Market Volume (Units) Analysis by Sales Channel, 2019 to 2034

Figure 20: Global Market Value Share (%) and BPS Analysis by Sales Channel, 2024 to 2034

Figure 21: Global Market Y-o-Y Growth (%) Projections by Sales Channel, 2024 to 2034

Figure 22: Global Market Value (US$ Million) Analysis by End User, 2019 to 2034

Figure 23: Global Market Volume (Units) Analysis by End User, 2019 to 2034

Figure 24: Global Market Value Share (%) and BPS Analysis by End User, 2024 to 2034

Figure 25: Global Market Y-o-Y Growth (%) Projections by End User, 2024 to 2034

Figure 26: Global Market Attractiveness by Product, 2024 to 2034

Figure 27: Global Market Attractiveness by Technology, 2024 to 2034

Figure 28: Global Market Attractiveness by Sales Channel, 2024 to 2034

Figure 29: Global Market Attractiveness by End User, 2024 to 2034

Figure 30: Global Market Attractiveness by Region, 2024 to 2034

Figure 31: North America Market Value (US$ Million) by Product, 2024 to 2034

Figure 32: North America Market Value (US$ Million) by Technology, 2024 to 2034

Figure 33: North America Market Value (US$ Million) by Sales Channel, 2024 to 2034

Figure 34: North America Market Value (US$ Million) by End User, 2024 to 2034

Figure 35: North America Market Value (US$ Million) by Country, 2024 to 2034

Figure 36: North America Market Value (US$ Million) Analysis by Country, 2019 to 2034

Figure 37: North America Market Volume (Units) Analysis by Country, 2019 to 2034

Figure 38: North America Market Value Share (%) and BPS Analysis by Country, 2024 to 2034

Figure 39: North America Market Y-o-Y Growth (%) Projections by Country, 2024 to 2034

Figure 40: North America Market Value (US$ Million) Analysis by Product, 2019 to 2034

Figure 41: North America Market Volume (Units) Analysis by Product, 2019 to 2034

Figure 42: North America Market Value Share (%) and BPS Analysis by Product, 2024 to 2034

Figure 43: North America Market Y-o-Y Growth (%) Projections by Product, 2024 to 2034

Figure 44: North America Market Value (US$ Million) Analysis by Technology, 2019 to 2034

Figure 45: North America Market Volume (Units) Analysis by Technology, 2019 to 2034

Figure 46: North America Market Value Share (%) and BPS Analysis by Technology, 2024 to 2034

Figure 47: North America Market Y-o-Y Growth (%) Projections by Technology, 2024 to 2034

Figure 48: North America Market Value (US$ Million) Analysis by Sales Channel, 2019 to 2034

Figure 49: North America Market Volume (Units) Analysis by Sales Channel, 2019 to 2034

Figure 50: North America Market Value Share (%) and BPS Analysis by Sales Channel, 2024 to 2034

Figure 51: North America Market Y-o-Y Growth (%) Projections by Sales Channel, 2024 to 2034

Figure 52: North America Market Value (US$ Million) Analysis by End User, 2019 to 2034

Figure 53: North America Market Volume (Units) Analysis by End User, 2019 to 2034

Figure 54: North America Market Value Share (%) and BPS Analysis by End User, 2024 to 2034

Figure 55: North America Market Y-o-Y Growth (%) Projections by End User, 2024 to 2034

Figure 56: North America Market Attractiveness by Product, 2024 to 2034

Figure 57: North America Market Attractiveness by Technology, 2024 to 2034

Figure 58: North America Market Attractiveness by Sales Channel, 2024 to 2034

Figure 59: North America Market Attractiveness by End User, 2024 to 2034

Figure 60: North America Market Attractiveness by Country, 2024 to 2034

Figure 61: Latin America Market Value (US$ Million) by Product, 2024 to 2034

Figure 62: Latin America Market Value (US$ Million) by Technology, 2024 to 2034

Figure 63: Latin America Market Value (US$ Million) by Sales Channel, 2024 to 2034

Figure 64: Latin America Market Value (US$ Million) by End User, 2024 to 2034

Figure 65: Latin America Market Value (US$ Million) by Country, 2024 to 2034

Figure 66: Latin America Market Value (US$ Million) Analysis by Country, 2019 to 2034

Figure 67: Latin America Market Volume (Units) Analysis by Country, 2019 to 2034

Figure 68: Latin America Market Value Share (%) and BPS Analysis by Country, 2024 to 2034

Figure 69: Latin America Market Y-o-Y Growth (%) Projections by Country, 2024 to 2034

Figure 70: Latin America Market Value (US$ Million) Analysis by Product, 2019 to 2034

Figure 71: Latin America Market Volume (Units) Analysis by Product, 2019 to 2034

Figure 72: Latin America Market Value Share (%) and BPS Analysis by Product, 2024 to 2034

Figure 73: Latin America Market Y-o-Y Growth (%) Projections by Product, 2024 to 2034

Figure 74: Latin America Market Value (US$ Million) Analysis by Technology, 2019 to 2034

Figure 75: Latin America Market Volume (Units) Analysis by Technology, 2019 to 2034

Figure 76: Latin America Market Value Share (%) and BPS Analysis by Technology, 2024 to 2034

Figure 77: Latin America Market Y-o-Y Growth (%) Projections by Technology, 2024 to 2034

Figure 78: Latin America Market Value (US$ Million) Analysis by Sales Channel, 2019 to 2034

Figure 79: Latin America Market Volume (Units) Analysis by Sales Channel, 2019 to 2034

Figure 80: Latin America Market Value Share (%) and BPS Analysis by Sales Channel, 2024 to 2034

Figure 81: Latin America Market Y-o-Y Growth (%) Projections by Sales Channel, 2024 to 2034

Figure 82: Latin America Market Value (US$ Million) Analysis by End User, 2019 to 2034

Figure 83: Latin America Market Volume (Units) Analysis by End User, 2019 to 2034

Figure 84: Latin America Market Value Share (%) and BPS Analysis by End User, 2024 to 2034

Figure 85: Latin America Market Y-o-Y Growth (%) Projections by End User, 2024 to 2034

Figure 86: Latin America Market Attractiveness by Product, 2024 to 2034

Figure 87: Latin America Market Attractiveness by Technology, 2024 to 2034

Figure 88: Latin America Market Attractiveness by Sales Channel, 2024 to 2034

Figure 89: Latin America Market Attractiveness by End User, 2024 to 2034

Figure 90: Latin America Market Attractiveness by Country, 2024 to 2034

Figure 91: Western Europe Market Value (US$ Million) by Product, 2024 to 2034

Figure 92: Western Europe Market Value (US$ Million) by Technology, 2024 to 2034

Figure 93: Western Europe Market Value (US$ Million) by Sales Channel, 2024 to 2034

Figure 94: Western Europe Market Value (US$ Million) by End User, 2024 to 2034

Figure 95: Western Europe Market Value (US$ Million) by Country, 2024 to 2034

Figure 96: Western Europe Market Value (US$ Million) Analysis by Country, 2019 to 2034

Figure 97: Western Europe Market Volume (Units) Analysis by Country, 2019 to 2034

Figure 98: Western Europe Market Value Share (%) and BPS Analysis by Country, 2024 to 2034

Figure 99: Western Europe Market Y-o-Y Growth (%) Projections by Country, 2024 to 2034

Figure 100: Western Europe Market Value (US$ Million) Analysis by Product, 2019 to 2034

Figure 101: Western Europe Market Volume (Units) Analysis by Product, 2019 to 2034

Figure 102: Western Europe Market Value Share (%) and BPS Analysis by Product, 2024 to 2034

Figure 103: Western Europe Market Y-o-Y Growth (%) Projections by Product, 2024 to 2034

Figure 104: Western Europe Market Value (US$ Million) Analysis by Technology, 2019 to 2034

Figure 105: Western Europe Market Volume (Units) Analysis by Technology, 2019 to 2034

Figure 106: Western Europe Market Value Share (%) and BPS Analysis by Technology, 2024 to 2034

Figure 107: Western Europe Market Y-o-Y Growth (%) Projections by Technology, 2024 to 2034

Figure 108: Western Europe Market Value (US$ Million) Analysis by Sales Channel, 2019 to 2034

Figure 109: Western Europe Market Volume (Units) Analysis by Sales Channel, 2019 to 2034

Figure 110: Western Europe Market Value Share (%) and BPS Analysis by Sales Channel, 2024 to 2034

Figure 111: Western Europe Market Y-o-Y Growth (%) Projections by Sales Channel, 2024 to 2034

Figure 112: Western Europe Market Value (US$ Million) Analysis by End User, 2019 to 2034

Figure 113: Western Europe Market Volume (Units) Analysis by End User, 2019 to 2034

Figure 114: Western Europe Market Value Share (%) and BPS Analysis by End User, 2024 to 2034

Figure 115: Western Europe Market Y-o-Y Growth (%) Projections by End User, 2024 to 2034

Figure 116: Western Europe Market Attractiveness by Product, 2024 to 2034

Figure 117: Western Europe Market Attractiveness by Technology, 2024 to 2034

Figure 118: Western Europe Market Attractiveness by Sales Channel, 2024 to 2034

Figure 119: Western Europe Market Attractiveness by End User, 2024 to 2034

Figure 120: Western Europe Market Attractiveness by Country, 2024 to 2034

Figure 121: Eastern Europe Market Value (US$ Million) by Product, 2024 to 2034

Figure 122: Eastern Europe Market Value (US$ Million) by Technology, 2024 to 2034

Figure 123: Eastern Europe Market Value (US$ Million) by Sales Channel, 2024 to 2034

Figure 124: Eastern Europe Market Value (US$ Million) by End User, 2024 to 2034

Figure 125: Eastern Europe Market Value (US$ Million) by Country, 2024 to 2034

Figure 126: Eastern Europe Market Value (US$ Million) Analysis by Country, 2019 to 2034

Figure 127: Eastern Europe Market Volume (Units) Analysis by Country, 2019 to 2034

Figure 128: Eastern Europe Market Value Share (%) and BPS Analysis by Country, 2024 to 2034

Figure 129: Eastern Europe Market Y-o-Y Growth (%) Projections by Country, 2024 to 2034

Figure 130: Eastern Europe Market Value (US$ Million) Analysis by Product, 2019 to 2034

Figure 131: Eastern Europe Market Volume (Units) Analysis by Product, 2019 to 2034

Figure 132: Eastern Europe Market Value Share (%) and BPS Analysis by Product, 2024 to 2034

Figure 133: Eastern Europe Market Y-o-Y Growth (%) Projections by Product, 2024 to 2034

Figure 134: Eastern Europe Market Value (US$ Million) Analysis by Technology, 2019 to 2034

Figure 135: Eastern Europe Market Volume (Units) Analysis by Technology, 2019 to 2034

Figure 136: Eastern Europe Market Value Share (%) and BPS Analysis by Technology, 2024 to 2034

Figure 137: Eastern Europe Market Y-o-Y Growth (%) Projections by Technology, 2024 to 2034

Figure 138: Eastern Europe Market Value (US$ Million) Analysis by Sales Channel, 2019 to 2034

Figure 139: Eastern Europe Market Volume (Units) Analysis by Sales Channel, 2019 to 2034

Figure 140: Eastern Europe Market Value Share (%) and BPS Analysis by Sales Channel, 2024 to 2034

Figure 141: Eastern Europe Market Y-o-Y Growth (%) Projections by Sales Channel, 2024 to 2034

Figure 142: Eastern Europe Market Value (US$ Million) Analysis by End User, 2019 to 2034

Figure 143: Eastern Europe Market Volume (Units) Analysis by End User, 2019 to 2034

Figure 144: Eastern Europe Market Value Share (%) and BPS Analysis by End User, 2024 to 2034

Figure 145: Eastern Europe Market Y-o-Y Growth (%) Projections by End User, 2024 to 2034

Figure 146: Eastern Europe Market Attractiveness by Product, 2024 to 2034

Figure 147: Eastern Europe Market Attractiveness by Technology, 2024 to 2034

Figure 148: Eastern Europe Market Attractiveness by Sales Channel, 2024 to 2034

Figure 149: Eastern Europe Market Attractiveness by End User, 2024 to 2034

Figure 150: Eastern Europe Market Attractiveness by Country, 2024 to 2034

Figure 151: South Asia and Pacific Market Value (US$ Million) by Product, 2024 to 2034

Figure 152: South Asia and Pacific Market Value (US$ Million) by Technology, 2024 to 2034

Figure 153: South Asia and Pacific Market Value (US$ Million) by Sales Channel, 2024 to 2034

Figure 154: South Asia and Pacific Market Value (US$ Million) by End User, 2024 to 2034

Figure 155: South Asia and Pacific Market Value (US$ Million) by Country, 2024 to 2034

Figure 156: South Asia and Pacific Market Value (US$ Million) Analysis by Country, 2019 to 2034

Figure 157: South Asia and Pacific Market Volume (Units) Analysis by Country, 2019 to 2034

Figure 158: South Asia and Pacific Market Value Share (%) and BPS Analysis by Country, 2024 to 2034

Figure 159: South Asia and Pacific Market Y-o-Y Growth (%) Projections by Country, 2024 to 2034

Figure 160: South Asia and Pacific Market Value (US$ Million) Analysis by Product, 2019 to 2034

Figure 161: South Asia and Pacific Market Volume (Units) Analysis by Product, 2019 to 2034

Figure 162: South Asia and Pacific Market Value Share (%) and BPS Analysis by Product, 2024 to 2034

Figure 163: South Asia and Pacific Market Y-o-Y Growth (%) Projections by Product, 2024 to 2034

Figure 164: South Asia and Pacific Market Value (US$ Million) Analysis by Technology, 2019 to 2034

Figure 165: South Asia and Pacific Market Volume (Units) Analysis by Technology, 2019 to 2034

Figure 166: South Asia and Pacific Market Value Share (%) and BPS Analysis by Technology, 2024 to 2034

Figure 167: South Asia and Pacific Market Y-o-Y Growth (%) Projections by Technology, 2024 to 2034

Figure 168: South Asia and Pacific Market Value (US$ Million) Analysis by Sales Channel, 2019 to 2034

Figure 169: South Asia and Pacific Market Volume (Units) Analysis by Sales Channel, 2019 to 2034

Figure 170: South Asia and Pacific Market Value Share (%) and BPS Analysis by Sales Channel, 2024 to 2034

Figure 171: South Asia and Pacific Market Y-o-Y Growth (%) Projections by Sales Channel, 2024 to 2034

Figure 172: South Asia and Pacific Market Value (US$ Million) Analysis by End User, 2019 to 2034

Figure 173: South Asia and Pacific Market Volume (Units) Analysis by End User, 2019 to 2034

Figure 174: South Asia and Pacific Market Value Share (%) and BPS Analysis by End User, 2024 to 2034

Figure 175: South Asia and Pacific Market Y-o-Y Growth (%) Projections by End User, 2024 to 2034

Figure 176: South Asia and Pacific Market Attractiveness by Product, 2024 to 2034

Figure 177: South Asia and Pacific Market Attractiveness by Technology, 2024 to 2034

Figure 178: South Asia and Pacific Market Attractiveness by Sales Channel, 2024 to 2034

Figure 179: South Asia and Pacific Market Attractiveness by End User, 2024 to 2034

Figure 180: South Asia and Pacific Market Attractiveness by Country, 2024 to 2034

Figure 181: East Asia Market Value (US$ Million) by Product, 2024 to 2034

Figure 182: East Asia Market Value (US$ Million) by Technology, 2024 to 2034

Figure 183: East Asia Market Value (US$ Million) by Sales Channel, 2024 to 2034

Figure 184: East Asia Market Value (US$ Million) by End User, 2024 to 2034

Figure 185: East Asia Market Value (US$ Million) by Country, 2024 to 2034

Figure 186: East Asia Market Value (US$ Million) Analysis by Country, 2019 to 2034

Figure 187: East Asia Market Volume (Units) Analysis by Country, 2019 to 2034

Figure 188: East Asia Market Value Share (%) and BPS Analysis by Country, 2024 to 2034

Figure 189: East Asia Market Y-o-Y Growth (%) Projections by Country, 2024 to 2034

Figure 190: East Asia Market Value (US$ Million) Analysis by Product, 2019 to 2034

Figure 191: East Asia Market Volume (Units) Analysis by Product, 2019 to 2034

Figure 192: East Asia Market Value Share (%) and BPS Analysis by Product, 2024 to 2034

Figure 193: East Asia Market Y-o-Y Growth (%) Projections by Product, 2024 to 2034

Figure 194: East Asia Market Value (US$ Million) Analysis by Technology, 2019 to 2034

Figure 195: East Asia Market Volume (Units) Analysis by Technology, 2019 to 2034

Figure 196: East Asia Market Value Share (%) and BPS Analysis by Technology, 2024 to 2034

Figure 197: East Asia Market Y-o-Y Growth (%) Projections by Technology, 2024 to 2034

Figure 198: East Asia Market Value (US$ Million) Analysis by Sales Channel, 2019 to 2034

Figure 199: East Asia Market Volume (Units) Analysis by Sales Channel, 2019 to 2034

Figure 200: East Asia Market Value Share (%) and BPS Analysis by Sales Channel, 2024 to 2034

Figure 201: East Asia Market Y-o-Y Growth (%) Projections by Sales Channel, 2024 to 2034

Figure 202: East Asia Market Value (US$ Million) Analysis by End User, 2019 to 2034

Figure 203: East Asia Market Volume (Units) Analysis by End User, 2019 to 2034

Figure 204: East Asia Market Value Share (%) and BPS Analysis by End User, 2024 to 2034

Figure 205: East Asia Market Y-o-Y Growth (%) Projections by End User, 2024 to 2034

Figure 206: East Asia Market Attractiveness by Product, 2024 to 2034

Figure 207: East Asia Market Attractiveness by Technology, 2024 to 2034

Figure 208: East Asia Market Attractiveness by Sales Channel, 2024 to 2034

Figure 209: East Asia Market Attractiveness by End User, 2024 to 2034

Figure 210: East Asia Market Attractiveness by Country, 2024 to 2034

Figure 211: Middle East and Africa Market Value (US$ Million) by Product, 2024 to 2034

Figure 212: Middle East and Africa Market Value (US$ Million) by Technology, 2024 to 2034

Figure 213: Middle East and Africa Market Value (US$ Million) by Sales Channel, 2024 to 2034

Figure 214: Middle East and Africa Market Value (US$ Million) by End User, 2024 to 2034

Figure 215: Middle East and Africa Market Value (US$ Million) by Country, 2024 to 2034

Figure 216: Middle East and Africa Market Value (US$ Million) Analysis by Country, 2019 to 2034

Figure 217: Middle East and Africa Market Volume (Units) Analysis by Country, 2019 to 2034

Figure 218: Middle East and Africa Market Value Share (%) and BPS Analysis by Country, 2024 to 2034

Figure 219: Middle East and Africa Market Y-o-Y Growth (%) Projections by Country, 2024 to 2034

Figure 220: Middle East and Africa Market Value (US$ Million) Analysis by Product, 2019 to 2034

Figure 221: Middle East and Africa Market Volume (Units) Analysis by Product, 2019 to 2034

Figure 222: Middle East and Africa Market Value Share (%) and BPS Analysis by Product, 2024 to 2034

Figure 223: Middle East and Africa Market Y-o-Y Growth (%) Projections by Product, 2024 to 2034

Figure 224: Middle East and Africa Market Value (US$ Million) Analysis by Technology, 2019 to 2034

Figure 225: Middle East and Africa Market Volume (Units) Analysis by Technology, 2019 to 2034

Figure 226: Middle East and Africa Market Value Share (%) and BPS Analysis by Technology, 2024 to 2034

Figure 227: Middle East and Africa Market Y-o-Y Growth (%) Projections by Technology, 2024 to 2034

Figure 228: Middle East and Africa Market Value (US$ Million) Analysis by Sales Channel, 2019 to 2034

Figure 229: Middle East and Africa Market Volume (Units) Analysis by Sales Channel, 2019 to 2034

Figure 230: Middle East and Africa Market Value Share (%) and BPS Analysis by Sales Channel, 2024 to 2034

Figure 231: Middle East and Africa Market Y-o-Y Growth (%) Projections by Sales Channel, 2024 to 2034

Figure 232: Middle East and Africa Market Value (US$ Million) Analysis by End User, 2019 to 2034

Figure 233: Middle East and Africa Market Volume (Units) Analysis by End User, 2019 to 2034

Figure 234: Middle East and Africa Market Value Share (%) and BPS Analysis by End User, 2024 to 2034

Figure 235: Middle East and Africa Market Y-o-Y Growth (%) Projections by End User, 2024 to 2034

Figure 236: Middle East and Africa Market Attractiveness by Product, 2024 to 2034

Figure 237: Middle East and Africa Market Attractiveness by Technology, 2024 to 2034

Figure 238: Middle East and Africa Market Attractiveness by Sales Channel, 2024 to 2034

Figure 239: Middle East and Africa Market Attractiveness by End User, 2024 to 2034

Figure 240: Middle East and Africa Market Attractiveness by Country, 2024 to 2034

Recommendations

Packaging

Industrial Printer Market

Published : November 2023

Packaging

Inkjet Printers Market

Published : June 2023

Packaging

Printing Machinery Market

Published : May 2023

Technology

Commercial Printer Market

Published : July 2022

Explore Packaging Insights

View Reports