
- Market Size (2026)
- USD 7.6 Bn
- Forecast (2036)
- USD 21.6 Bn
- CAGR (2026 to 2036)
- 11.0%
How big is Identity Threat Detection and Response Software Market in 2026?
Between 2026 and 2036, the identity threat detection and response software market is projected to compound at an 11.0% CAGR, as global software billings scale beyond USD 6.8 billion (2025) and an estimated USD 7.6 billion (2026) to reach an anticipated USD 21.6 billion (2036).
Cyber adversaries armed with infostealer logs and reverse-proxy phishing kits increasingly bypass perimeter firewalls by logging in with valid employee credentials, prompting 87.0% of surveyed U.S. and UK enterprises in a February 2025 FIDO Alliance study to deploy or pilot phishing-resistant passkeys for workforce sign-ins. When compared with static network perimeter defenses, identity threat detection and response software inspects live Kerberos authentications and Active Directory domain controller telemetry alongside identity verification controls to halt in-memory privilege escalation before lateral movement occurs. Because security operations centers require immediate visibility into Golden Ticket forging and credential dumping, identity threat detection is predicted to account for 41.2% of capability spending in 2026. After generating USD 6.8 billion (2025) before posting an estimated USD 7.6 billion (2026), annual identity threat detection and response software outlays are anticipated to touch USD 21.6 billion (2036) via an 11.0% CAGR projected to add USD 14.0 billion in annual net bookings. Even so, high cloud event-log storage expenses and synchronization delays across fragmented legacy Active Directory forests remain key restraining factors slowing adoption across mid-sized security teams.
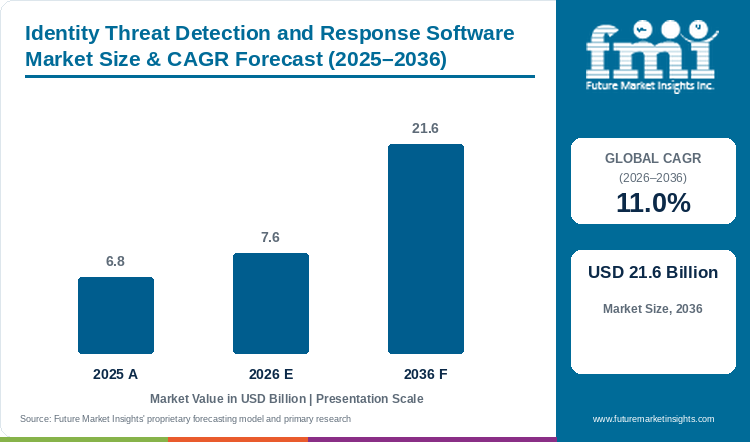
Key Market Trends & Insights
- By capability: Identity threat detection is predicted to secure 41.2% of 2026 capability spending because domain controller packet inspection exposes credential dumping and Golden Ticket forging in real time.
- By identity environment: Workforce identity is projected to account for 42.8% of 2026 environment revenue as remote employees authenticate across unmanaged residential networks vulnerable to session token theft.
- By deployment: Cloud architectures are expected to claim 43.8% of 2026 deployment billings through elastic event ingestion pipelines that correlate federated Entra ID and Okta logs without on-premises appliances.
- By end use: BFSI is anticipated to represent 43.0% of 2026 vertical outlays as commercial banks automate session revocation to protect wire-transfer gateways and core settlement ledgers.
Regional Highlights
- Top national expansion rate: Australian security operations centers are anticipated to head regional growth with an 11.8% yearly expansion to 2036 under Security of Critical Infrastructure Act Enhanced CIRMP rules addressing credential compromise and lateral movement hazards.
- Additional country projections: Canadian directory defense budgets are forecast to climb at an 11.7% CAGR and American enterprise bookings are expected to advance at 11.4%, while British deployments (11.2%) are projected to precede Japanese (10.7%) and German (10.6%) outlays.
Market Size & Forecast
Table 1: Market Size and Forecast for the Identity Threat Detection and Response Software Market (USD billion and CAGR percentage), 2025 to 2036
| Metric | Value |
|---|---|
| 2025 Market Size | USD 6.8 billion |
| Estimated Market Size in 2026 | USD 7.6 billion |
| Projected Market Size by 2036 | USD 21.6 billion |
| CAGR, 2026 to 2036 | 11.0% |
| Added Revenue, 2026 to 2036 | USD 14.0 billion |
Security operations teams struggle to correlate fragmented on-premises domain controller event logs with cloud single sign-on telemetry during live credential intrusions. Computer Security Resource Center advisories in August 2025 announced Special Publication 800-63-4 updating federal subscriber authentication and federation assurance controls. To satisfy these assurance mandates, enterprise defenders integrate directory sensors directly into identity and access management workflows so compromised user tokens are quarantined before lateral movement reaches production databases.
Domain Controller Telemetry and Identity Ingestion Sizing
Table 2: Domain Controller Telemetry and Identity Ingestion Sizing Indicators for the Identity Threat Detection and Response Software Market (USD billion and operational ranges), mixed historical and forecast years from 2025 to 2036
| Metric | 2025 | 2026 | 2036 |
|---|---|---|---|
| Market size (USD billion) | 6.8 | 7.6 | 21.6 |
| Active Directory domain controller event ingestion rate (billion events/day) | 48.0 to 62.0 | 54.0 to 70.0 | 145.0 to 190.0 |
| Typical non-human machine identity ratio per human user | 12:1 to 18:1 | 15:1 to 22:1 | 35:1 to 55:1 |
| Average credential exposure detection latency (minutes) | 120 to 180 | 45 to 90 | 2 to 10 |
Operational note: Ingestion volume ranges reflect aggregate Kerberos authentications and NTLM challenges alongside LDAP directory queries processed by enterprise domain controller sensors. Machine identity multipliers measure API tokens and automated service principals relative to active employee headcount across Fortune 2000 infrastructures.
Enterprise SOC Deployment and ITDR Agent Procurement Sizing
Hybrid corporate identity fabrics span legacy on-premises Active Directory forests alongside multi-cloud directory tenants. Chief information security officers evaluate software suppliers on low-overhead domain controller sensors that inspect Kerberos ticket-granting requests without degrading authentication latency during peak login hours.
Table 3: Enterprise SOC Deployment and ITDR Agent Procurement Indicators for the Identity Threat Detection and Response Software Market (USD and environment counts), mixed historical and forecast years from 2025 to 2036
| Metric | 2025 | 2026 | 2036 |
|---|---|---|---|
| Qualified enterprise and government IT environments (thousand) | 28.5 | 31.0 | 58.0 |
| Average annual ITDR software spend per enterprise (USD) | 238,600 | 245,160 | 372,410 |
| Cloud ITDR subscription license price band per user/month (USD) | 4.5 to 9.2 | 4.2 to 8.8 | 3.1 to 6.5 |
| Domain controller sensor licensing price band per server/year (USD) | 1,850 to 3,400 | 1,800 to 3,300 | 1,400 to 2,600 |
Table 4: End-Use Sector Revenue Indicators for the Identity Threat Detection and Response Software Market (USD billion and percentages), 2026
| Metric | Value | Basis |
|---|---|---|
| Market size, 2026 | USD 7.6 billion | Report value |
| BFSI sector revenue, 2026 | USD 3.3 billion | 43.0% share |
| Workforce identity environment revenue, 2026 | USD 3.3 billion | 42.8% share |
| Identity threat detection capability revenue, 2026 | USD 3.1 billion | 41.2% share |
Analyst Perspective
"Enterprise security architects no longer treat identity directories as passive administrative databases. Defenders require real-time domain controller telemetry and instant session revocation to halt credential-based intrusions before lateral movement reaches cloud production workloads."
- Sudip Saha, Co-founder, FMI
How is the identity threat detection and response software market segmented?
The identity threat detection and response software market is segmented by capability, identity environment, deployment, and end use. In 2026, identity threat detection is projected at 41.2%, workforce identity at 42.8%, cloud at 43.8%, and BFSI at 43.0%.
By capability: identity threat detection, credential exposure analytics, privilege abuse detection, and automated response.
By identity environment: workforce identity, privileged identity, machine identity, and customer identity.
By deployment: cloud, on-premises, hybrid, and managed service.
By end use: BFSI, government, healthcare, and technology.
Why does identity threat detection lead the capability category?
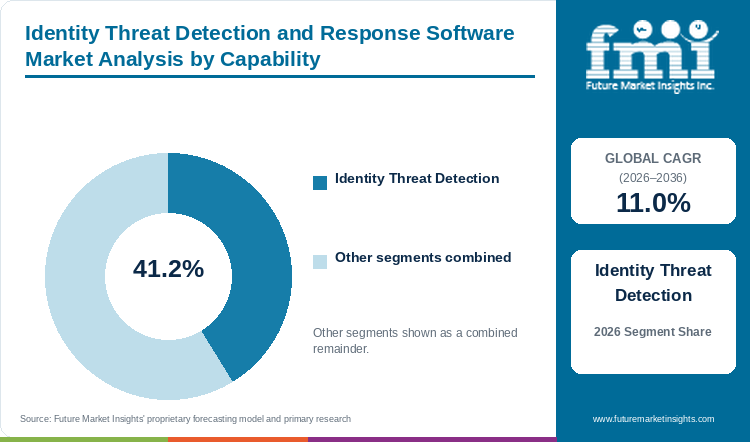
Live Kerberos ticket inspection is predicted to assign identity threat detection 41.2% of 2026 capability outlays, reflecting enterprise defense against credential dumping.
Table 5: Capability Share for the Identity Threat Detection and Response Software Market (percentage share), 2026
| Capability | Share (2026) |
|---|---|
| Identity Threat Detection | 41.2% |
| Other Segments Combined | 58.8%* |
| Total | 100.0% |
*Note: Aggregate share across all other capability classifications completes the 100.0% 2026 ITDR total.
Table 6: Capability Leadership and Market Growth for the Identity Threat Detection and Response Software Market (segment and CAGR percentage), 2026 to 2036
| Metric | Value |
|---|---|
| Global CAGR (2026 to 2036) | 11.0% |
| Leading Segment | Identity Threat Detection |
Parsing live authentication traffic across enterprise domain controllers is the only reliable method to catch in-memory credential abuse before attackers escalate privileges. Enterprise audits by FMI reveal that security directors are expected to allocate leading budget share to identity threat detection sensors that flag DCSync and Kerberoasting ticket extractions in milliseconds. Defenders correlate this directory packet telemetry with AI security platforms to link anomalous LDAP reconnaissance directly to compromised workstation processes.
- Real-time domain controller event monitoring that exposes credential dumping is predicted to secure 41.2% of 2026 capability revenue for identity threat detection.
- CrowdStrike was named the overall leader in the November 2025 KuppingerCole Identity Threat Detection and Response Leadership Compass for its unified endpoint and hybrid directory telemetry.
What drives workforce identity to the forefront of the identity environment segment?
Remote employee session hijacking risks are projected to position workforce identity at 42.8% of 2026 identity environment bookings, aided by browser token telemetry.
Hybrid corporate employees authenticate into dozens of SaaS portals from residential networks where infostealer malware and reverse-proxy phishing kits harvest active browser cookies. When threat actors replay stolen session tokens to bypass multi-factor prompts, standard perimeter firewalls register the traffic as legitimate employee activity. Security teams are anticipated to deploy workforce identity monitoring alongside a phishing-resistant authentication solution to detect impossible-travel logins and terminate hijacked browser sessions automatically.
- Protecting distributed employee accounts from session cookie replay is projected to give workforce identity 42.8% of 2026 identity environment spending.
- The February 2026 CyberArk Identity Security Landscape report surveying over 2,900 security decision-makers revealed that 90.0% of organizations experienced an identity-related breach as machine identities outnumbered humans 109 to 1.
How does cloud maintain its 43.8% share in the deployment segment?
Agentless federated directory collectors are expected to propel cloud architectures to 43.8% of 2026 deployment billings, benefiting from elastic event stream ingestion.
Multi-tenant cloud security planes allow enterprise defenders to ingest hundreds of millions of daily authentication events without provisioning dedicated on-premises log collector hardware. Agentless API connectors stream Entra ID and Okta telemetry into graph analytics engines that map cross-cloud privilege escalation paths continuously. Elastic cloud ingestion is forecast to enable lean security teams to maintain unified visibility across federated subsidiaries while avoiding local server maintenance overhead.
- Elastic telemetry ingestion and agentless directory API integrations are expected to lift cloud deployments to 43.8% of 2026 platform revenue.
- CrowdStrike unveiled Falcon Next-Gen Identity Security in August 2025 to protect workforce accounts alongside non-human and AI agent identities across hybrid directories.
What positions BFSI as the leading end use category in 2026?
Core banking wire-transfer protections are anticipated to allocate 43.0% of 2026 end use subscriptions to BFSI institutions, accompanied by privileged session containment.
Commercial banks and capital-market clearing houses face severe financial exposure whenever compromised administrative credentials reach SWIFT wire gateways or core settlement databases. Banking regulators enforce continuous auditing of privileged directory entitlements and mandate immediate containment of anomalous teller or administrator sessions. Financial institutions are therefore expected to pair identity threat detection with enterprise fraud detection and prevention systems to block lateral privilege escalation across branch and cloud networks.
- Mandatory regulatory audits and automated containment of compromised banking accounts are anticipated to give BFSI 43.0% of 2026 industry sector subscriptions.
- Microsoft Security reported in July 2025 that identity threat detection systems blocked more than 7,000 password attacks per second amid a 146.0% surge in adversary-in-the-middle phishing.
What are the drivers, restraints, and opportunities in the identity threat detection and response software market?
Escalating credential theft and hybrid cloud directory sprawl are anticipated to propel identity threat detection and response software deployments through 2036, whereas legacy Active Directory forest complexity slows rollout and non-human machine identity protection opens new enterprise budgets.
- Driver: Widespread infostealer credential harvesting and MFA-bypass attacks compel enterprise CISOs to deploy continuous directory and session telemetry monitoring.
- Restraint: High cloud log ingestion fees and fragmented legacy Active Directory forests with unpatched trust relationships complicate enterprise rollouts.
- Opportunity: Discovering and containing non-human machine identities and automated API service principals generates substantial DevOps and cloud security spending.
Growth Analysis and Future Potential: Credential Defense and Lateral Movement Prevention
Widespread remote work and multi-cloud federation have made valid user credentials the primary initial access vector for enterprise ransomware groups. Instead of deploying noisy exploit code, threat actors purchase harvested session tokens to authenticate directly into corporate single sign-on portals and execute domain controller reconnaissance. SOC assessments by Future Market Insights indicate that security leaders are expected to pair directory telemetry with industrial cybersecurity platforms to spot Golden Ticket and pass-the-hash lateral movement in milliseconds. In October 2025, the European Union Agency for Cybersecurity published its ENISA Threat Landscape 2025 report examining 4,875 cyber incidents across European critical sectors where phishing and credential abuse served as leading intrusion vectors.
Risk Assessment and Operational Hurdles: Legacy Forest Complexity and Event Ingestion Expenses
Integrating modern identity sensors across fragmented legacy Active Directory forests acquired through decades of corporate mergers creates substantial engineering friction. Many multinational enterprises operate legacy domain controllers with undocumented cross-forest trusts and outdated schema permissions that trigger false-positive behavioral alerts. Streaming billions of daily directory events into cloud SIEM repositories also generates heavy bandwidth and log retention bills. Unrefined behavioral rules can disrupt legitimate security screening and identity workflows when administrators tune anomaly thresholds too aggressively. In October 2025, Microsoft Security documented that 66.0% of analyzed attack paths involved identity compromise across disconnected hybrid directory tools.
Commercial Opportunity Analysis: Non-Human Machine Identities and Autonomous Containment
Proliferation of containerized microservices and automated CI/CD pipelines has created non-human machine identities that outnumber human employees by more than fifteen to one. Application developers frequently leave long-lived API tokens and OAuth service principals unrotated in cloud repositories, creating high-privilege lateral movement paths for attackers. Software vendors that combine automated service-account discovery with extended detection and response playbooks are projected to revoke compromised machine tokens autonomously without breaking production builds. In April 2025, BeyondTrust launched its Identity Security Risk Assessment to uncover hidden Paths to Privilege across Active Directory and Entra ID alongside Okta and Ping environments within 24 hours.
Identity Threat Detection and Response Software Market by Country (2026 to 2036)
Enhanced Critical Infrastructure Risk Management Program obligations under the SOCI Act are anticipated to put Australia on an 11.8% compound annual trajectory to 2036, just ahead of Canadian Bill C-8 critical cyber systems rollouts (forecast at 11.7%) and United States zero-trust federal deployments (predicted at 11.4%) as well as British financial hubs (11.2%) and Japanese supply-chain defenses (10.7%) while German NIS2 deployments are projected to achieve 10.6%. Critical infrastructure statutes and worker privacy rules shape telemetry architecture across these markets.
Table 7: Country CAGR and Primary Growth Levers for the Identity Threat Detection and Response Software Market (CAGR percentage and operational drivers), 2026 to 2036
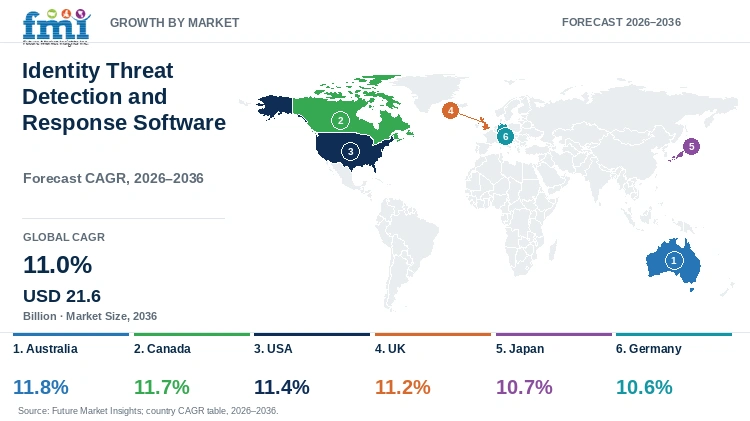
| Country | CAGR (2026 to 2036) | Primary Growth Lever |
|---|---|---|
| Australia | 11.8% | SOCI Act Enhanced CIRMP credential-compromise hazard mitigation across eligible cyber frameworks |
| Canada | 11.7% | Enacted 2026 Bill C-8 critical cyber systems protection rules and hybrid cloud public sector defense |
| USA | 11.4% | Federal zero-trust executive directives and financial sector Kerberoasting mitigation |
| UK | 11.2% | Cyber Assessment Framework compliance and City of London fintech credential defense |
| Japan | 10.7% | Cross-border supply chain authentication and Tokyo manufacturing Active Directory defense |
| Germany | 10.6% | NIS2 industrial compliance and automotive supplier machine identity governance |
Source: Future Market Insights analysis
Australia Identity Threat Detection and Response Software Market Outlook (2026 to 2036)
What sets Australia apart from global identity security markets is the Security of Critical Infrastructure Act risk management regime, which requires board-approved annual reporting while letting asset owners align with ISO 27001 or NIST CSF alongside AESCSF or Essential Eight frameworks depending on asset class. Under Cyber and Infrastructure Security Centre rules updated in June 2026, Enhanced CIRMP obligations commenced on 10 June 2026 requiring designated energy and communications operators alongside water utilities to mitigate credential compromise and lateral movement hazard vectors. Australian identity threat detection and response software bookings are consequently anticipated to progress at an 11.8% compound annual clip to 2036. Acute SOC analyst shortages in Sydney and Melbourne still favor 24/7 managed detection subscriptions.
Key takeaway: In Australia, Enhanced CIRMP credential-compromise hazard rules under the SOCI Act and local SOC staffing gaps accelerate managed identity security adoption.
Canada Identity Threat Detection and Response Software Market Outlook (2026 to 2036)
Canadian identity threat detection and response software deployments are forecast to climb by an 11.7% compound annual clip through 2036 after Bill C-8 received Royal Assent on June 15, 2026 to establish the Critical Cyber Systems Protection Act framework while phased sector regulations roll out. Unlike single-regulator national markets, Canadian telecom and energy operators must align federal critical cyber system readiness with provincial public-sector privacy governance across Quebec and Ontario alongside British Columbia. Federal cyber defense officials warned in the January 2026 CCCS Ransomware Threat Outlook 2025-2027 that ransomware actors routinely exploit stolen VPN and Active Directory credentials to infiltrate Canadian critical infrastructure. Cross-border directory log governance still prompts vendors to operate domestic Montreal and Toronto cloud instances.
Key takeaway: In Canada, enacted Bill C-8 critical cyber systems oversight and provincial privacy governance require identity security vendors to operate domestic cloud pods.
USA Identity Threat Detection and Response Software Market Outlook (2026 to 2036)
Updated August 2025 NIST SP 800-63-4 Digital Identity Guidelines established stricter multi-factor authentication and federated session assurance rules across United States federal and commercial networks. Whereas overseas organizations typically operate a single centralized directory, United States Fortune 500 corporations manage sprawling multi-forest Active Directory estates accumulated through decades of mergers alongside high-density DevOps machine identities. Federal zero-trust token verification mandates and commercial Kerberoasting defenses are predicted to grow United States identity threat detection and response software outlays at an 11.4% annual pace over the decade. Correlating legacy on-premises forests with modern private cloud services still creates schema conflicts, driving CISOs toward agentless identity graph platforms.
Key takeaway: In the USA, federal zero-trust token directives and complex post-merger directory estates drive spending toward agentless identity graph platforms.
UK Identity Threat Detection and Response Software Market Outlook (2026 to 2036)
High concentration of global clearing banks and international insurance syndicates in the City of London makes the United Kingdom uniquely focused on privileged wire-transfer session containment and NCSC Cyber Assessment Framework audits. British financial institutions deploy continuous directory telemetry to intercept anomalous service-account ticket requests and terminate hijacked administrative sessions within seconds. Continuous Kerberos ticket inspection across London clearing banks is estimated to advance British identity threat detection and response software licensing at an 11.2% annual clip through 2036. In October 2025, the UK National Cyber Security Centre Annual Review 2025 documented 204 nationally significant cyber incidents over twelve months driven heavily by credential theft and ransomware. Tight municipal and NHS trust IT budgets still favor modular per-seat licensing.
Key takeaway: In the UK, City of London banking oversight and NCSC Cyber Assessment Framework audits prioritize automated Active Directory privilege monitoring.
Japan Identity Threat Detection and Response Software Market Outlook (2026 to 2036)
Japan diverges from Western cloud-first identity markets because domestic keiretsu manufacturing groups operate multi-tier overseas supplier networks that connect back into on-premises Tokyo headquarters directories. After attackers repeatedly exploited Southeast Asian subsidiary VPN credentials to pivot into domestic automotive plants, Japanese corporations began supplementing perimeter firewalls with behavioral directory monitoring. Although the Information-technology Promotion Agency launched STAR-1 applications under the Japan Cyber STAR IoT product conformance labeling scheme on March 25, 2025, device-level labels do not govern enterprise Active Directory credentials. Securing cross-border supplier directories is expected to register a 10.7% CAGR for Japanese identity threat detection and response software billings through 2036, while bilingual SOC skill shortages favor integrator-managed playbooks.
Key takeaway: In Japan, manufacturing supply-chain credential breaches and bilingual SOC skill gaps drive demand for integrator-managed identity defense suites.
Germany Identity Threat Detection and Response Software Market Outlook (2026 to 2036)
Mandatory European Union NIS2 critical-sector rules and strict Betriebsrat works-council co-determination laws make Germany structurally distinct from Anglo-American SOC environments where raw employee activity logging is routine. German industrial manufacturers must block compromised office Active Directory accounts from reaching factory operational technology networks without violating statutory employee privacy protections. In November 2025, the Federal Office for Information Security published its annual report on the State of IT Security in Germany highlighting escalating identity-based ransomware and supply-chain intrusions across industrial operators. Segregating office directories from plant networks is projected to generate a 10.6% yearly expansion in German identity threat detection and response software budgets through 2036. Works-council surveillance restrictions require vendors to embed automated identity pseudonymization engines.
Key takeaway: In Germany, NIS2 critical-sector compliance and strict works-council employee privacy rules compel enterprises to deploy pseudonymized identity telemetry.
Full report country CAGRs cover: North America; Latin America; Western Europe; Eastern Europe; East Asia; South Asia and Pacific; Middle East and Africa.
Who are the notable companies in the identity threat detection and response software market?
CrowdStrike Holdings, Inc. (Falcon Identity Protection), Microsoft Corporation (Microsoft Defender for Identity), SentinelOne, Inc. (Singularity Identity), CyberArk Software Ltd., Palo Alto Networks, Inc., BeyondTrust, Inc., Zscaler, Inc., and Delinea Inc. (Authomize) are the notable companies in the identity threat detection and response software market.
Competitive tracking by Future Market Insights shows that vendor positioning divides between cloud-native endpoint security leaders and privileged access specialists alongside zero-trust cloud directory providers. Endpoint detection vendors extend lightweight kernel and domain controller sensors to correlate host process execution with live Kerberos authentication requests. Simultaneously, privileged access vendors add continuous entitlement graph analytics across cloud computing estates to revoke standing administrative permissions, while cloud security providers instrument federated directories directly. Enterprise CISOs evaluate suppliers on domain controller CPU overhead and sub-second blast-radius session quarantine.
- Endpoint & Extended Detection Specialists: CrowdStrike (Falcon Identity Protection) and SentinelOne (Singularity Identity) alongside Palo Alto Networks unify endpoint process telemetry with live Active Directory attack interception.
- Privileged Access & Identity Security Giants: CyberArk Software and BeyondTrust together with Delinea Inc. (Authomize) deliver privileged session monitoring and cross-cloud entitlement risk analytics.
- Zero-Trust & Cloud Security Pioneers: Microsoft Corporation (Microsoft Defender for Identity) and Zscaler protect hybrid cloud directories through native domain controller instrumentation and inline decoy deployment.
Competitive Benchmarking: Identity Threat Detection and Response Software Market
Table 8: Competitive Benchmarking for the Identity Threat Detection and Response Software Market (qualitative capability ratings), 2026
| Company | Domain Controller Telemetry Depth | Machine Identity & Service Principal Coverage | Blast-Radius Revocation Speed | Global Enterprise Footprint |
|---|---|---|---|---|
| CrowdStrike Holdings, Inc. (Falcon Identity Protection) | High | High | High | High |
| Microsoft Corporation (Microsoft Defender for Identity) | High | High | High | High |
| SentinelOne, Inc. (Singularity Identity) | High | High | High | High |
| CyberArk Software Ltd. | High | High | High | High |
| Palo Alto Networks, Inc. | High | Medium | High | High |
| BeyondTrust, Inc. | High | High | Medium | High |
| Zscaler, Inc. | Medium | High | High | High |
| Delinea Inc. (Authomize) | High | High | Medium | High |
Scoring basis: Domain controller telemetry depth earns a High mark when vendor sensors inspect low-level Kerberos ticket grants and NTLM challenges alongside LDAP queries without server rebooting. Machine identity and service principal coverage is rated High where the platform discovers shadow API keys and unmanaged OAuth tokens across cloud tenants. Blast-radius revocation speed receives a High rating when the software enforces conditional access lockouts within seconds across multinational enterprise estates.
Key Developments in the Identity Threat Detection and Response Software Market
- In January 2026, Microsoft Corporation outlined its 2026 AI-powered identity security priorities highlighting Microsoft Entra Agent ID and the Conditional Access Optimization Agent that completes policy updates 43.0% faster.
- In April 2025, Palo Alto Networks introduced Cortex XSIAM 3.0 integrating identity threat detection with proactive exposure management to cut vulnerability noise by up to 99.0%.
- In October 2025, SentinelOne released its Singularity Identity Security Platform combining Autonomous Security Intelligence with active identity deception across Active Directory alongside Entra ID and Okta.
Key Players in the Identity Threat Detection and Response Software Market
Endpoint & Extended Detection Specialists
- CrowdStrike Holdings, Inc. (Falcon Identity Protection)
- SentinelOne, Inc. (Singularity Identity)
- Palo Alto Networks, Inc.
Privileged Access & Identity Security Giants
- CyberArk Software Ltd.
- BeyondTrust, Inc.
- Delinea Inc. (Authomize)
Zero-Trust & Cloud Security Pioneers
- Microsoft Corporation (Microsoft Defender for Identity)
- Zscaler, Inc.
Identity Threat Detection and Response Software Market - Report Scope
Table 9: Report Scope for the Identity Threat Detection and Response Software Market (coverage fields and definitions), 2026 to 2036
| Coverage field | Report scope |
|---|---|
| Market breakdown | Capability; Identity Environment; Deployment; End Use; Region |
| Quantitative Units | USD Billion |
| Market Definition | Includes B2B enterprise software subscription and licensing revenue from identity threat detection and response platforms providing live Active Directory and cloud directory telemetry ingestion, credential dumping detection, privilege escalation analysis, identity decoys, and automated session containment. Category Scope Note: The valuation strictly covers active identity-layer threat detection and response modules, excluding standalone consumer password managers, basic single sign-on (SSO) utility licenses without behavioral threat telemetry, and traditional signature-based endpoint antivirus software. |
| Regions Covered | North America; Latin America; Western Europe; Eastern Europe; East Asia; South Asia and Pacific; Middle East and Africa |
| Countries Covered | Australia, Canada, USA, UK, Japan, Germany, and additional countries in the full report |
| Key Companies Covered | CrowdStrike Holdings, Inc. (Falcon Identity Protection), Microsoft Corporation (Microsoft Defender for Identity), SentinelOne, Inc. (Singularity Identity), CyberArk Software Ltd., Palo Alto Networks, Inc., BeyondTrust, Inc., Zscaler, Inc., Delinea Inc. (Authomize) |
| Forecast Period | 2026 to 2036 |
| Approach | Primary and secondary research with top-down and bottom-up market triangulation. |
Identity Threat Detection and Response Software Market - Research Methodology
Table 10: Research Methodology for the Identity Threat Detection and Response Software Market (research methods and approach), 2026 edition
| Method | Approach |
|---|---|
| Primary Research | Primary interviews were conducted with enterprise chief information security officers, Active Directory architects, SOC incident response directors, and identity security engineers to validate licensing bands and deployment models. |
| Secondary Research | Secondary research included vendor financial filings, NIST SP 800-63-4 digital identity guidelines, FIDO Alliance passkey deployment studies, ENISA and CISC critical infrastructure reports, NCSC annual reviews, and BSI IT security publications. |
| Market Sizing and Forecasting | Market sizing and forecasting for the 2026 to 2036 period were developed using top-down and bottom-up models reconciling qualified enterprise IT environments, per-user cloud ITDR seat prices, and domain controller sensor licenses. |
| Data Triangulation and Validation | Revenue estimates were triangulated against enterprise cybersecurity software budgets and Active Directory domain controller deployment densities while strictly excluding general endpoint antivirus and basic IAM utility revenues. |
| Country Forecasting Model | Country-level CAGRs were calibrated against the 11.0% global baseline by weighting national zero-trust government directives, critical infrastructure legislation (EU NIS2, Canada Bill C-8, Australia SOCI Act Enhanced CIRMP), financial sector credential breach rates, and SOC automation maturity. |
| Operational Benchmark Traceability | Operational indicators in Tables 2, 3, and 4 (domain controller event ingestion rates, machine-to-human identity ratios, credential exposure detection latency, and per-seat licensing bands) are synthesized from FIDO Alliance, NIST, ENISA, CISC, NCSC, and vendor telemetry disclosures. |
Identity Threat Detection and Response Software Market by Segments
Identity Threat Detection and Response Software Market segmented by Capability:
- Identity Threat Detection
- Credential Exposure Analytics
- Privilege Abuse Detection
- Automated Response
Identity Threat Detection and Response Software Market segmented by Identity Environment:
- Workforce Identity
- Privileged Identity
- Machine Identity
- Customer Identity
Identity Threat Detection and Response Software Market segmented by Deployment:
- Cloud
- On-Premises
- Hybrid
- Managed Service
Identity Threat Detection and Response Software Market segmented by End Use:
- BFSI
- Government
- Healthcare
- Technology
Identity Threat Detection and Response Software Market by Region
- North America
- United States
- Canada
- Latin America
- Brazil
- Mexico
- Argentina
- Chile
- Western Europe
- Germany
- France
- United Kingdom
- Italy
- Spain
- Benelux
- Nordics
- Eastern Europe
- Poland
- Czech Republic
- Romania
- Hungary
- East Asia
- China
- Japan
- South Korea
- South Asia and Pacific
- India
- ASEAN
- Australia and New Zealand
- Middle East and Africa
- GCC Countries
- South Africa
- Türkiye
- Israel
Research Sources and Bibliography
- [1] FIDO Alliance. (2025, February 26). The State of Passkey Deployment in the Enterprise: A Snapshot of Passkey Deployments for Employee Sign-ins in the U.S. and UK. FIDO Alliance Research.
- [2] National Institute of Standards and Technology (NIST). (2025, August 1). NIST Revises Digitial Identity Guidelines | Special Publication 800-63-4. Computer Security Resource Center (CSRC).
- [3] CrowdStrike Holdings, Inc. (2025, November 10). CrowdStrike Named the Overall Leader in 2025 KuppingerCole Identity Threat Detection and Response Leadership Compass. CrowdStrike Press Releases.
- [4] Palo Alto Networks, Inc. & CyberArk. (2026, February 10). 2026 Identity Security Landscape. CyberArk Threat Landscape Research.
- [5] CrowdStrike Holdings, Inc. (2025, August 14). CrowdStrike Unveils Falcon Next-Gen Identity Security, the First Unified Solution to Protect Every Identity Across the Attack Chain. CrowdStrike Press Releases.
- [6] Microsoft Corporation. (2025, July 31). Modernize your identity defense with Microsoft Identity Threat Detection and Response. Microsoft Security Blog.
- [7] European Union Agency for Cybersecurity (ENISA). (2025, October 1). ENISA Threat Landscape 2025. ENISA Publications.
- [8] Microsoft Corporation. (2025, October 23). Harden your identity defense with improved protection, deeper correlation, and richer context. Microsoft Security Blog.
- [9] BeyondTrust Corporation. (2025, April 28). BeyondTrust Launches Free Identity Security Risk Assessment to Reveal Hidden Paths to Privilege. BeyondTrust Press & Media.
- [10] Cyber and Infrastructure Security Centre (CISC). (2026, June 30). SOCI Act regulatory obligations. Department of Home Affairs, Australian Government.
- [11] Canadian Centre for Cyber Security (CCCS). (2026, January 28). Ransomware Threat Outlook 2025-2027. Government of Canada.
- [12] National Institute of Standards and Technology (NIST). (2025, August 1). NIST SP 800-63-4: Digital Identity Guidelines. U.S. Department of Commerce.
- [13] National Cyber Security Centre (NCSC). (2025, October 14). NCSC Annual Review 2025. UK National Cyber Security Centre.
- [14] Information-technology Promotion Agency, Japan (IPA). (2025, March 25). Japan Cyber STAR (JC-STAR) | Enhancing information security. Information-technology Promotion Agency, Japan.
- [15] Federal Office for Information Security (BSI). (2025, November 12). The State of IT Security in Germany. Bundesamt für Sicherheit in der Informationstechnik.
- [16] Microsoft Corporation. (2026, January 20). Four priorities for AI-powered identity and network access security in 2026. Microsoft Security Blog.
- [17] Palo Alto Networks, Inc. (2025, April 28). Introducing XSIAM 3.0. Palo Alto Networks Blog.
- [18] SentinelOne, Inc. (2025, October 22). Singularity Identity Security Platform. SentinelOne Platform.
- [19] BeyondTrust Corporation. (2025, September 16). BeyondTrust Delivers Identity Security Controls for AI, Turning Agent Visibility into Action. BeyondTrust Press & Media.
- [20] Zscaler, Inc. (2026, January 27). Zscaler Unveils New Innovations to Secure Enterprise AI Adoption. Zscaler Press Releases.
- [21] Delinea Inc. (2026, March 18). Delinea Report Finds 90% of Organizations Pressure Security Teams to Loosen Identity Controls for AI. Delinea News.
This bibliography is provided for reader reference and is not exhaustive. The full report contains the complete reference list and detailed citations.
This Report Answers
- How large is the identity threat detection and response software market in 2026 and what is forecast for 2036?
- Which credential theft and cloud migration pressures drive enterprise software adoption?
- Why does identity threat detection lead the capability category?
- Why does workforce identity lead the environment category globally?
- How do growth rates differ across Australia, Canada, the USA, the UK, Japan, and Germany?
- Which leading companies provide specialized domain controller sensors and identity response tools today?
- What limits adoption or software replacement in hybrid Active Directory environments?
- What technical requirements should CISOs evaluate before purchasing identity threat detection platforms?
Table of Content
- Key Takeaways
- Market Size and CAGR
- Top Growth Driver
- Fastest Growing Segment
- Leading Region
- Key Companies
- Emerging Opportunities
- Executive Summary
- Global Market Outlook
- Demand-side Trends
- Supply-side Trends
- Technology Roadmap Analysis
- Analysis and Recommendations
- Analyst Perspective (What is happening? Why now? What should investors know?)
- Key Questions Answered
- How large is the market?
- What is the CAGR?
- What are key trends?
- Which region dominates?
- Who are the leaders?
Read More...
- Market Overview
- Market Coverage / Taxonomy
- Market Definition / Scope / Limitations
- Research Methodology
- Chapter Orientation
- Analytical Lens and Working Hypotheses
- Market Structure, Signals, and Trend Drivers
- Benchmarking and Cross-market Comparability
- Market Sizing, Forecasting, and Opportunity Mapping
- Research Design and Evidence Framework
- Desk Research Programme (Secondary Evidence)
- Expert Input and Fieldwork (Primary Evidence)
- Tooling, Models, and Reference Databases
- Data Engineering and Model Build
- Quality Assurance and Audit Trail
- Market Background
- Market Dynamics (Drivers, Restraints, Opportunity, Trends)
- Scenario Forecast (Optimistic, Likely, Conservative)
- Impact Analysis
- AI Impact
- Sustainability Impact
- Regulatory Impact
- Technology Impact
- Consumer / Buyer Analysis
- Purchase Drivers
- Adoption Barriers
- Buyer Journey
- Opportunity Map Analysis
- Product Life Cycle Analysis
- Supply Chain Analysis
- Investment Feasibility Matrix
- Value Chain Analysis
- PESTLE and Porter's Analysis
- Regulatory Landscape
- Regional Parent Market Outlook
- Production and Consumption Statistics
- Import and Export Statistics
- Global Market Analysis and Forecast, 2021 to 2036
- Historical Market Size Value (USD Billion) Analysis, 2021 to 2025
- Current and Future Market Size Value (USD Billion) Projections, 2026 to 2036
- Y-o-Y Growth Trend Analysis
- Absolute $ Opportunity Analysis
- Global Market Pricing Analysis, 2021 to 2036
- Global Market Analysis and Forecast, By Capability, 2021 to 2036
- Introduction / Key Findings
- Historical Market Size Value (USD Billion) Analysis By Capability, 2021 to 2025
- Current and Future Market Size Value (USD Billion) Analysis and Forecast By Capability, 2026 to 2036
- Identity Threat Detection
- Credential Exposure Analytics
- Privilege Abuse Detection
- Automated Response
- Y-o-Y Growth Trend Analysis By Capability, 2021 to 2025
- Absolute $ Opportunity Analysis By Capability, 2026 to 2036
- Global Market Analysis and Forecast, By Identity Environment, 2021 to 2036
- Introduction / Key Findings
- Historical Market Size Value (USD Billion) Analysis By Identity Environment, 2021 to 2025
- Current and Future Market Size Value (USD Billion) Analysis and Forecast By Identity Environment, 2026 to 2036
- Workforce Identity
- Privileged Identity
- Machine Identity
- Customer Identity
- Y-o-Y Growth Trend Analysis By Identity Environment, 2021 to 2025
- Absolute $ Opportunity Analysis By Identity Environment, 2026 to 2036
- Global Market Analysis and Forecast, By Deployment, 2021 to 2036
- Introduction / Key Findings
- Historical Market Size Value (USD Billion) Analysis By Deployment, 2021 to 2025
- Current and Future Market Size Value (USD Billion) Analysis and Forecast By Deployment, 2026 to 2036
- Cloud
- On-Premises
- Hybrid
- Managed Service
- Y-o-Y Growth Trend Analysis By Deployment, 2021 to 2025
- Absolute $ Opportunity Analysis By Deployment, 2026 to 2036
- Global Market Analysis and Forecast, By End Use, 2021 to 2036
- Introduction / Key Findings
- Historical Market Size Value (USD Billion) Analysis By End Use, 2021 to 2025
- Current and Future Market Size Value (USD Billion) Analysis and Forecast By End Use, 2026 to 2036
- BFSI
- Government
- Healthcare
- Technology
- Y-o-Y Growth Trend Analysis By End Use, 2021 to 2025
- Absolute $ Opportunity Analysis By End Use, 2026 to 2036
- Global Market Analysis and Forecast, By Region, 2021 to 2036
- Introduction
- Historical Market Size Value (USD Billion) Analysis By Region, 2021 to 2025
- Current Market Size Value (USD Billion) Analysis and Forecast By Region, 2026 to 2036
- North America
- Latin America
- Western Europe
- Eastern Europe
- East Asia
- South Asia and Pacific
- Middle East and Africa
- Market Attractiveness Analysis By Region
- North America Market Analysis and Forecast, By Country, 2021 to 2036
- Historical Market Size Value (USD Billion) Trend Analysis By Market Taxonomy, 2021 to 2025
- Market Size Value (USD Billion) Forecast By Market Taxonomy, 2026 to 2036
- By Country
- United States
- Canada
- By Capability
- By Identity Environment
- By Deployment
- By End Use
- By Country
- Market Attractiveness Analysis
- By Country
- By Capability
- By Identity Environment
- By Deployment
- By End Use
- Key Takeaways
- Latin America Market Analysis and Forecast, By Country
- Historical Market Size Value (USD Billion) Trend Analysis By Market Taxonomy, 2021 to 2025
- Market Size Value (USD Billion) Forecast By Market Taxonomy, 2026 to 2036
- By Country
- Brazil
- Mexico
- Argentina
- Chile
- By Capability
- By Identity Environment
- By Deployment
- By End Use
- By Country
- Market Attractiveness Analysis
- By Country
- By Capability
- By Identity Environment
- By Deployment
- By End Use
- Key Takeaways
- Western Europe Market Analysis and Forecast, By Country
- Historical Market Size Value (USD Billion) Trend Analysis By Market Taxonomy, 2021 to 2025
- Market Size Value (USD Billion) Forecast By Market Taxonomy, 2026 to 2036
- By Country
- Germany
- France
- United Kingdom
- Italy
- Spain
- Benelux
- Nordics
- By Capability
- By Identity Environment
- By Deployment
- By End Use
- By Country
- Market Attractiveness Analysis
- By Country
- By Capability
- By Identity Environment
- By Deployment
- By End Use
- Key Takeaways
- Eastern Europe Market Analysis and Forecast, By Country
- Historical Market Size Value (USD Billion) Trend Analysis By Market Taxonomy, 2021 to 2025
- Market Size Value (USD Billion) Forecast By Market Taxonomy, 2026 to 2036
- By Country
- Poland
- Czech Republic
- Romania
- Hungary
- By Capability
- By Identity Environment
- By Deployment
- By End Use
- By Country
- Market Attractiveness Analysis
- By Country
- By Capability
- By Identity Environment
- By Deployment
- By End Use
- Key Takeaways
- East Asia Market Analysis and Forecast, By Country
- Historical Market Size Value (USD Billion) Trend Analysis By Market Taxonomy, 2021 to 2025
- Market Size Value (USD Billion) Forecast By Market Taxonomy, 2026 to 2036
- By Country
- China
- Japan
- South Korea
- By Capability
- By Identity Environment
- By Deployment
- By End Use
- By Country
- Market Attractiveness Analysis
- By Country
- By Capability
- By Identity Environment
- By Deployment
- By End Use
- Key Takeaways
- South Asia and Pacific Market Analysis and Forecast, By Country
- Historical Market Size Value (USD Billion) Trend Analysis By Market Taxonomy, 2021 to 2025
- Market Size Value (USD Billion) Forecast By Market Taxonomy, 2026 to 2036
- By Country
- India
- ASEAN
- Australia and New Zealand
- By Capability
- By Identity Environment
- By Deployment
- By End Use
- By Country
- Market Attractiveness Analysis
- By Country
- By Capability
- By Identity Environment
- By Deployment
- By End Use
- Key Takeaways
- Middle East and Africa Market Analysis and Forecast, By Country
- Historical Market Size Value (USD Billion) Trend Analysis By Market Taxonomy, 2021 to 2025
- Market Size Value (USD Billion) Forecast By Market Taxonomy, 2026 to 2036
- By Country
- GCC Countries
- South Africa
- Türkiye
- Israel
- By Capability
- By Identity Environment
- By Deployment
- By End Use
- By Country
- Market Attractiveness Analysis
- By Country
- By Capability
- By Identity Environment
- By Deployment
- By End Use
- Key Takeaways
- Key Countries Market Analysis
- United States
- Pricing Analysis
- Market Share Analysis, 2025
- By Capability
- By Identity Environment
- By Deployment
- By End Use
- Canada
- Pricing Analysis
- Market Share Analysis, 2025
- By Capability
- By Identity Environment
- By Deployment
- By End Use
- Mexico
- Pricing Analysis
- Market Share Analysis, 2025
- By Capability
- By Identity Environment
- By Deployment
- By End Use
- Brazil
- Pricing Analysis
- Market Share Analysis, 2025
- By Capability
- By Identity Environment
- By Deployment
- By End Use
- Chile
- Pricing Analysis
- Market Share Analysis, 2025
- By Capability
- By Identity Environment
- By Deployment
- By End Use
- Germany
- Pricing Analysis
- Market Share Analysis, 2025
- By Capability
- By Identity Environment
- By Deployment
- By End Use
- United Kingdom
- Pricing Analysis
- Market Share Analysis, 2025
- By Capability
- By Identity Environment
- By Deployment
- By End Use
- Italy
- Pricing Analysis
- Market Share Analysis, 2025
- By Capability
- By Identity Environment
- By Deployment
- By End Use
- Spain
- Pricing Analysis
- Market Share Analysis, 2025
- By Capability
- By Identity Environment
- By Deployment
- By End Use
- France
- Pricing Analysis
- Market Share Analysis, 2025
- By Capability
- By Identity Environment
- By Deployment
- By End Use
- India
- Pricing Analysis
- Market Share Analysis, 2025
- By Capability
- By Identity Environment
- By Deployment
- By End Use
- ASEAN
- Pricing Analysis
- Market Share Analysis, 2025
- By Capability
- By Identity Environment
- By Deployment
- By End Use
- Australia and New Zealand
- Pricing Analysis
- Market Share Analysis, 2025
- By Capability
- By Identity Environment
- By Deployment
- By End Use
- China
- Pricing Analysis
- Market Share Analysis, 2025
- By Capability
- By Identity Environment
- By Deployment
- By End Use
- Japan
- Pricing Analysis
- Market Share Analysis, 2025
- By Capability
- By Identity Environment
- By Deployment
- By End Use
- South Korea
- Pricing Analysis
- Market Share Analysis, 2025
- By Capability
- By Identity Environment
- By Deployment
- By End Use
- Poland
- Pricing Analysis
- Market Share Analysis, 2025
- By Capability
- By Identity Environment
- By Deployment
- By End Use
- Hungary
- Pricing Analysis
- Market Share Analysis, 2025
- By Capability
- By Identity Environment
- By Deployment
- By End Use
- Türkiye
- Pricing Analysis
- Market Share Analysis, 2025
- By Capability
- By Identity Environment
- By Deployment
- By End Use
- South Africa
- Pricing Analysis
- Market Share Analysis, 2025
- By Capability
- By Identity Environment
- By Deployment
- By End Use
- Australia
- Pricing Analysis
- Market Share Analysis, 2025
- By Capability
- By Identity Environment
- By Deployment
- By End Use
- United States
- Market Structure Analysis
- Competition Dashboard
- Competition Benchmarking
- Market Share Analysis of Top Players
- By Regional
- By Capability
- By Identity Environment
- By Deployment
- By End Use
- Emerging Startups
- Innovation Benchmarking
- Competition Analysis
- Competition Deep Dive
- CrowdStrike Holdings, Inc. (Falcon Identity Protection)
- Overview
- Product Portfolio
- Profitability by Market Segments
- Sales Footprint
- Strategy Overview
- Marketing Strategy
- Product Strategy
- Channel Strategy
- Microsoft Corporation (Microsoft Defender for Identity)
- SentinelOne, Inc. (Singularity Identity)
- CyberArk Software Ltd.
- Palo Alto Networks, Inc.
- BeyondTrust, Inc.
- Zscaler, Inc.
- Delinea Inc. (Authomize)
- CrowdStrike Holdings, Inc. (Falcon Identity Protection)
- Case Studies
- Success Stories
- Recent Developments
- Competition Deep Dive
- Assumptions & Acronyms Used
List of Tables
- Table 1: Global Market Value (USD Billion) Forecast by Region, 2021 to 2036
- Table 2: Global Market Value (USD Billion) Forecast by Capability, 2021 to 2036
- Table 3: Global Market Value (USD Billion) Forecast by Identity Environment, 2021 to 2036
- Table 4: Global Market Value (USD Billion) Forecast by Deployment, 2021 to 2036
- Table 5: Global Market Value (USD Billion) Forecast by End Use, 2021 to 2036
- Table 6: North America Market Value (USD Billion) Forecast by Country, 2021 to 2036
- Table 7: North America Market Value (USD Billion) Forecast by Capability, 2021 to 2036
- Table 8: North America Market Value (USD Billion) Forecast by Identity Environment, 2021 to 2036
- Table 9: North America Market Value (USD Billion) Forecast by Deployment, 2021 to 2036
- Table 10: North America Market Value (USD Billion) Forecast by End Use, 2021 to 2036
- Table 11: Latin America Market Value (USD Billion) Forecast by Country, 2021 to 2036
- Table 12: Latin America Market Value (USD Billion) Forecast by Capability, 2021 to 2036
- Table 13: Latin America Market Value (USD Billion) Forecast by Identity Environment, 2021 to 2036
- Table 14: Latin America Market Value (USD Billion) Forecast by Deployment, 2021 to 2036
- Table 15: Latin America Market Value (USD Billion) Forecast by End Use, 2021 to 2036
- Table 16: Western Europe Market Value (USD Billion) Forecast by Country, 2021 to 2036
- Table 17: Western Europe Market Value (USD Billion) Forecast by Capability, 2021 to 2036
- Table 18: Western Europe Market Value (USD Billion) Forecast by Identity Environment, 2021 to 2036
- Table 19: Western Europe Market Value (USD Billion) Forecast by Deployment, 2021 to 2036
- Table 20: Western Europe Market Value (USD Billion) Forecast by End Use, 2021 to 2036
- Table 21: Eastern Europe Market Value (USD Billion) Forecast by Country, 2021 to 2036
- Table 22: Eastern Europe Market Value (USD Billion) Forecast by Capability, 2021 to 2036
- Table 23: Eastern Europe Market Value (USD Billion) Forecast by Identity Environment, 2021 to 2036
- Table 24: Eastern Europe Market Value (USD Billion) Forecast by Deployment, 2021 to 2036
- Table 25: Eastern Europe Market Value (USD Billion) Forecast by End Use, 2021 to 2036
- Table 26: East Asia Market Value (USD Billion) Forecast by Country, 2021 to 2036
- Table 27: East Asia Market Value (USD Billion) Forecast by Capability, 2021 to 2036
- Table 28: East Asia Market Value (USD Billion) Forecast by Identity Environment, 2021 to 2036
- Table 29: East Asia Market Value (USD Billion) Forecast by Deployment, 2021 to 2036
- Table 30: East Asia Market Value (USD Billion) Forecast by End Use, 2021 to 2036
- Table 31: South Asia and Pacific Market Value (USD Billion) Forecast by Country, 2021 to 2036
- Table 32: South Asia and Pacific Market Value (USD Billion) Forecast by Capability, 2021 to 2036
- Table 33: South Asia and Pacific Market Value (USD Billion) Forecast by Identity Environment, 2021 to 2036
- Table 34: South Asia and Pacific Market Value (USD Billion) Forecast by Deployment, 2021 to 2036
- Table 35: South Asia and Pacific Market Value (USD Billion) Forecast by End Use, 2021 to 2036
- Table 36: Middle East and Africa Market Value (USD Billion) Forecast by Country, 2021 to 2036
- Table 37: Middle East and Africa Market Value (USD Billion) Forecast by Capability, 2021 to 2036
- Table 38: Middle East and Africa Market Value (USD Billion) Forecast by Identity Environment, 2021 to 2036
- Table 39: Middle East and Africa Market Value (USD Billion) Forecast by Deployment, 2021 to 2036
- Table 40: Middle East and Africa Market Value (USD Billion) Forecast by End Use, 2021 to 2036
List of Figures
- Figure 1: Global Market Pricing Analysis
- Figure 2: Global Market Value (USD Billion) Forecast 2021-2036
- Figure 3: Global Market Value Share and BPS Analysis by Capability, 2026 and 2036
- Figure 4: Global Market Y-o-Y Growth Comparison by Capability, 2026-2036
- Figure 5: Global Market Attractiveness Analysis by Capability
- Figure 6: Global Market Value Share and BPS Analysis by Identity Environment, 2026 and 2036
- Figure 7: Global Market Y-o-Y Growth Comparison by Identity Environment, 2026-2036
- Figure 8: Global Market Attractiveness Analysis by Identity Environment
- Figure 9: Global Market Value Share and BPS Analysis by Deployment, 2026 and 2036
- Figure 10: Global Market Y-o-Y Growth Comparison by Deployment, 2026-2036
- Figure 11: Global Market Attractiveness Analysis by Deployment
- Figure 12: Global Market Value Share and BPS Analysis by End Use, 2026 and 2036
- Figure 13: Global Market Y-o-Y Growth Comparison by End Use, 2026-2036
- Figure 14: Global Market Attractiveness Analysis by End Use
- Figure 15: Global Market Value (USD Billion) Share and BPS Analysis by Region, 2026 and 2036
- Figure 16: Global Market Y-o-Y Growth Comparison by Region, 2026-2036
- Figure 17: Global Market Attractiveness Analysis by Region
- Figure 18: North America Market Incremental Dollar Opportunity, 2026-2036
- Figure 19: Latin America Market Incremental Dollar Opportunity, 2026-2036
- Figure 20: Western Europe Market Incremental Dollar Opportunity, 2026-2036
- Figure 21: Eastern Europe Market Incremental Dollar Opportunity, 2026-2036
- Figure 22: East Asia Market Incremental Dollar Opportunity, 2026-2036
- Figure 23: South Asia and Pacific Market Incremental Dollar Opportunity, 2026-2036
- Figure 24: Middle East and Africa Market Incremental Dollar Opportunity, 2026-2036
- Figure 25: North America Market Value Share and BPS Analysis by Country, 2026 and 2036
- Figure 26: North America Market Value Share and BPS Analysis by Capability, 2026 and 2036
- Figure 27: North America Market Y-o-Y Growth Comparison by Capability, 2026-2036
- Figure 28: North America Market Attractiveness Analysis by Capability
- Figure 29: North America Market Value Share and BPS Analysis by Identity Environment, 2026 and 2036
- Figure 30: North America Market Y-o-Y Growth Comparison by Identity Environment, 2026-2036
- Figure 31: North America Market Attractiveness Analysis by Identity Environment
- Figure 32: North America Market Value Share and BPS Analysis by Deployment, 2026 and 2036
- Figure 33: North America Market Y-o-Y Growth Comparison by Deployment, 2026-2036
- Figure 34: North America Market Attractiveness Analysis by Deployment
- Figure 35: North America Market Value Share and BPS Analysis by End Use, 2026 and 2036
- Figure 36: North America Market Y-o-Y Growth Comparison by End Use, 2026-2036
- Figure 37: North America Market Attractiveness Analysis by End Use
- Figure 38: Latin America Market Value Share and BPS Analysis by Country, 2026 and 2036
- Figure 39: Latin America Market Value Share and BPS Analysis by Capability, 2026 and 2036
- Figure 40: Latin America Market Y-o-Y Growth Comparison by Capability, 2026-2036
- Figure 41: Latin America Market Attractiveness Analysis by Capability
- Figure 42: Latin America Market Value Share and BPS Analysis by Identity Environment, 2026 and 2036
- Figure 43: Latin America Market Y-o-Y Growth Comparison by Identity Environment, 2026-2036
- Figure 44: Latin America Market Attractiveness Analysis by Identity Environment
- Figure 45: Latin America Market Value Share and BPS Analysis by Deployment, 2026 and 2036
- Figure 46: Latin America Market Y-o-Y Growth Comparison by Deployment, 2026-2036
- Figure 47: Latin America Market Attractiveness Analysis by Deployment
- Figure 48: Latin America Market Value Share and BPS Analysis by End Use, 2026 and 2036
- Figure 49: Latin America Market Y-o-Y Growth Comparison by End Use, 2026-2036
- Figure 50: Latin America Market Attractiveness Analysis by End Use
- Figure 51: Western Europe Market Value Share and BPS Analysis by Country, 2026 and 2036
- Figure 52: Western Europe Market Value Share and BPS Analysis by Capability, 2026 and 2036
- Figure 53: Western Europe Market Y-o-Y Growth Comparison by Capability, 2026-2036
- Figure 54: Western Europe Market Attractiveness Analysis by Capability
- Figure 55: Western Europe Market Value Share and BPS Analysis by Identity Environment, 2026 and 2036
- Figure 56: Western Europe Market Y-o-Y Growth Comparison by Identity Environment, 2026-2036
- Figure 57: Western Europe Market Attractiveness Analysis by Identity Environment
- Figure 58: Western Europe Market Value Share and BPS Analysis by Deployment, 2026 and 2036
- Figure 59: Western Europe Market Y-o-Y Growth Comparison by Deployment, 2026-2036
- Figure 60: Western Europe Market Attractiveness Analysis by Deployment
- Figure 61: Western Europe Market Value Share and BPS Analysis by End Use, 2026 and 2036
- Figure 62: Western Europe Market Y-o-Y Growth Comparison by End Use, 2026-2036
- Figure 63: Western Europe Market Attractiveness Analysis by End Use
- Figure 64: Eastern Europe Market Value Share and BPS Analysis by Country, 2026 and 2036
- Figure 65: Eastern Europe Market Value Share and BPS Analysis by Capability, 2026 and 2036
- Figure 66: Eastern Europe Market Y-o-Y Growth Comparison by Capability, 2026-2036
- Figure 67: Eastern Europe Market Attractiveness Analysis by Capability
- Figure 68: Eastern Europe Market Value Share and BPS Analysis by Identity Environment, 2026 and 2036
- Figure 69: Eastern Europe Market Y-o-Y Growth Comparison by Identity Environment, 2026-2036
- Figure 70: Eastern Europe Market Attractiveness Analysis by Identity Environment
- Figure 71: Eastern Europe Market Value Share and BPS Analysis by Deployment, 2026 and 2036
- Figure 72: Eastern Europe Market Y-o-Y Growth Comparison by Deployment, 2026-2036
- Figure 73: Eastern Europe Market Attractiveness Analysis by Deployment
- Figure 74: Eastern Europe Market Value Share and BPS Analysis by End Use, 2026 and 2036
- Figure 75: Eastern Europe Market Y-o-Y Growth Comparison by End Use, 2026-2036
- Figure 76: Eastern Europe Market Attractiveness Analysis by End Use
- Figure 77: East Asia Market Value Share and BPS Analysis by Country, 2026 and 2036
- Figure 78: East Asia Market Value Share and BPS Analysis by Capability, 2026 and 2036
- Figure 79: East Asia Market Y-o-Y Growth Comparison by Capability, 2026-2036
- Figure 80: East Asia Market Attractiveness Analysis by Capability
- Figure 81: East Asia Market Value Share and BPS Analysis by Identity Environment, 2026 and 2036
- Figure 82: East Asia Market Y-o-Y Growth Comparison by Identity Environment, 2026-2036
- Figure 83: East Asia Market Attractiveness Analysis by Identity Environment
- Figure 84: East Asia Market Value Share and BPS Analysis by Deployment, 2026 and 2036
- Figure 85: East Asia Market Y-o-Y Growth Comparison by Deployment, 2026-2036
- Figure 86: East Asia Market Attractiveness Analysis by Deployment
- Figure 87: East Asia Market Value Share and BPS Analysis by End Use, 2026 and 2036
- Figure 88: East Asia Market Y-o-Y Growth Comparison by End Use, 2026-2036
- Figure 89: East Asia Market Attractiveness Analysis by End Use
- Figure 90: South Asia and Pacific Market Value Share and BPS Analysis by Country, 2026 and 2036
- Figure 91: South Asia and Pacific Market Value Share and BPS Analysis by Capability, 2026 and 2036
- Figure 92: South Asia and Pacific Market Y-o-Y Growth Comparison by Capability, 2026-2036
- Figure 93: South Asia and Pacific Market Attractiveness Analysis by Capability
- Figure 94: South Asia and Pacific Market Value Share and BPS Analysis by Identity Environment, 2026 and 2036
- Figure 95: South Asia and Pacific Market Y-o-Y Growth Comparison by Identity Environment, 2026-2036
- Figure 96: South Asia and Pacific Market Attractiveness Analysis by Identity Environment
- Figure 97: South Asia and Pacific Market Value Share and BPS Analysis by Deployment, 2026 and 2036
- Figure 98: South Asia and Pacific Market Y-o-Y Growth Comparison by Deployment, 2026-2036
- Figure 99: South Asia and Pacific Market Attractiveness Analysis by Deployment
- Figure 100: South Asia and Pacific Market Value Share and BPS Analysis by End Use, 2026 and 2036
- Figure 101: South Asia and Pacific Market Y-o-Y Growth Comparison by End Use, 2026-2036
- Figure 102: South Asia and Pacific Market Attractiveness Analysis by End Use
- Figure 103: Middle East and Africa Market Value Share and BPS Analysis by Country, 2026 and 2036
- Figure 104: Middle East and Africa Market Value Share and BPS Analysis by Capability, 2026 and 2036
- Figure 105: Middle East and Africa Market Y-o-Y Growth Comparison by Capability, 2026-2036
- Figure 106: Middle East and Africa Market Attractiveness Analysis by Capability
- Figure 107: Middle East and Africa Market Value Share and BPS Analysis by Identity Environment, 2026 and 2036
- Figure 108: Middle East and Africa Market Y-o-Y Growth Comparison by Identity Environment, 2026-2036
- Figure 109: Middle East and Africa Market Attractiveness Analysis by Identity Environment
- Figure 110: Middle East and Africa Market Value Share and BPS Analysis by Deployment, 2026 and 2036
- Figure 111: Middle East and Africa Market Y-o-Y Growth Comparison by Deployment, 2026-2036
- Figure 112: Middle East and Africa Market Attractiveness Analysis by Deployment
- Figure 113: Middle East and Africa Market Value Share and BPS Analysis by End Use, 2026 and 2036
- Figure 114: Middle East and Africa Market Y-o-Y Growth Comparison by End Use, 2026-2036
- Figure 115: Middle East and Africa Market Attractiveness Analysis by End Use
- Figure 116: Global Market - Tier Structure Analysis
- Figure 117: Global Market - Company Share Analysis
Frequently Asked Questions
How big is the identity threat detection and response software market in 2026, and what is forecast for 2036?
Starting at USD 6.8 billion in 2025, global identity threat detection and response software outlays are estimated at USD 7.6 billion for 2026 and are anticipated to touch USD 21.6 billion by 2036 as enterprises defend directory servers against credential theft.
What is the CAGR for the identity threat detection and response software market from 2026 to 2036?
As per FMI, worldwide software billings are projected to expand at an 11.0% CAGR through 2036, expected to deliver an increase in annual market revenue of USD 14.0 billion between 2026 and 2036 as zero-trust token validation replaces static perimeter rules.
Which capability segment leads the identity threat detection and response software market?
Identity threat detection is predicted to command 41.2% of 2026 capability outlays because continuous Kerberos and LDAP packet inspection exposes credential dumping and lateral privilege abuse in milliseconds.
Which identity environment segment leads the market?
Workforce identity is projected to capture 42.8% of 2026 environment revenue owing to widespread remote employee authentication exposure and adversary-in-the-middle browser cookie hijacking.
Which country has a notable growth outlook during the assessment period?
Future Market Insights projects that Australia will pace Asia-Pacific demand at an 11.8% CAGR through 2036, driven by Enhanced CIRMP credential-compromise and lateral-movement mitigation duties under the SOCI Act.
Who are the key players in the market?
Notable software suppliers include CrowdStrike Holdings, Inc. (Falcon Identity Protection), Microsoft Corporation (Microsoft Defender for Identity), SentinelOne, Inc. (Singularity Identity), CyberArk Software Ltd., Palo Alto Networks, Inc., BeyondTrust, Inc., Zscaler, Inc., and Delinea Inc. (Authomize), competing across domain controller telemetry and machine identity protection.
Preview the report firsthand - request a free sample
Get SampleGet the brochure for pricing and purchase details.
Get PDF
