Reports

- Global Locations -

Headquarters

Future Market Insights, Inc.

Christiana Corporate, 200
Continental Drive, Suite 401,
Newark, Delaware - 19713,
United States

T: +1-845-579-5705

Americas

Future Market Insights, Inc.

616 Corporate Way, Suite 2-9018,
Valley Cottage, NY 10989, United States

T: +1-347-918-3531

MEA

Future Market Insights

1602-6 Jumeirah Bay X2 Tower, Plot No: JLT-PH2-X2A,
Jumeirah Lakes Towers, Dubai,
United Arab Emirates

Europe

Future Market Insights

3rd Floor, 207 Regent Street,
W1B 3HH London
United Kingdom

T: + 44 (0) 20 8123 9659
D: +44 (0) 20 3287 4268

Asia Pacific

Future Market Insights

IndiaLand Global Tech Park, Unit UG-1, Behind Grand HighStreet, Phase 1, Hinjawadi, MH, Pune – 411057, India

Industrial Microbiology Market Outlook (2023 to 2033)

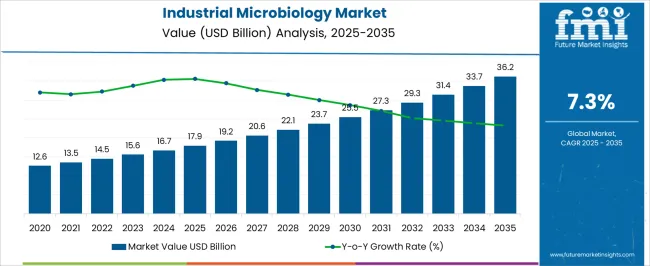
The global industrial microbiology market has reached a valuation of US$ 15.49 billion in 2023, with a projected CAGR of 7.6% from 2023 to 2033. By 2033, the market is anticipated to reach US$ 32.12 billion.

With advancements in biotechnology, genetic engineering, and microbial cultivation techniques, the market offers a plethora of opportunities for industries to optimize their operations, enhance product quality, and reduce environmental impact. Given that fermentation applications are gaining popularity in syrup formulations, the market is anticipated to register rising demand in the pharmaceutical & biotechnology sector.

Attributes Details
Industrial Microbiology Market Estimated Value (2023) US$ 15.49 billion
Industrial Microbiology Market Estimated Value (2033) US$ 32.12 billion
Industrial Microbiology Market Value CAGR (2023 to 2033) 7.6%

Don't pay for what you don't need

Customize your report by selecting specific countries or regions and save 30%!

Industrial Microbiology Market Historic Sales (2018 to 2022) Compared to 2023 to 2033 Forecast Outlook

The market for industrial microbiology secured a CAGR of 7.5% from 2018 to 2022 owing to the expansion of the pharmaceutical industry and increasing preference for automation, which are in turn bolstering the adoption of sterility testing within the pharmaceutical industry.

As per FMI, increasing adoption of testing procedures within the food & beverage industry is expected to bolster the market growth over the forecast period. Due to the growing demand for consumer products and the rise in the population worldwide, the adoption of sterility testing for product quality and safety testing is surging.

Emphasis on industrial safety and food & hygiene is likely to improve the demand over the coming years. Moreover, the rising application of industrial microbiology within agriculture, food & beverages, cosmetics, and pharmaceutical industries is also expected to open up a wide array of opportunities in the market.

The consumption of prescription antibiotics continues to increase the adoption of industrial microbiology among generic drug makers, despite the threat of rising anti-microbial drug resistance, especially across India and China.

The demand for industrial microbiology is set to expand at 7.6% CAGR during the assessment period from 2023 to 2033 based on the factors contributing to the market.

Focus on process automation of traditional industrial methods, aimed at reducing overall cost of production quite is likely to aid the expansion of the market further.
How is the Lack of Skilled Professionals and High-Cost Production Expected to Hamper Sales?

  • The lack of skilled professionals in industrial microbiology may lead to delays in product development and innovation, affecting the ability of companies to introduce new and improved offerings to the market.
  • The high cost of production, including expenses related to equipment, facilities, and quality control measures, can put pressure on profit margins and pricing strategies, potentially impacting sales volume and market competitiveness.
  • Limited availability of skilled professionals and high production costs may deter new entrants from entering the industrial microbiology market, reducing overall market competition and innovation.
  • The lack of skilled professionals can also result in suboptimal utilization of available technologies and resources, leading to inefficiencies in production processes and potentially affecting product quality and customer satisfaction.
  • The high cost of production may result in high prices for industrial microbiology products, making them less accessible to certain customer segments and potentially limiting market demand.
  • Addressing the challenges of skill shortage and high production costs requires
  • Investment in education and training programs.
  • Fostering collaborations between academia and industry.
  • Exploring cost-effective manufacturing processes.
  • Promoting awareness about the importance of industrial microbiology and its benefits.
  • Overcoming these challenges presents opportunities for companies to differentiate themselves by investing in talent development, and leveraging technology advancements to streamline production processes and improve overall operational efficiency.
Sabyasachi Ghosh
Sabyasachi Ghosh

Principal Consultant

Talk to Analyst

Find your sweet spots for generating winning opportunities in this market.

How does Application as Excipients Drive Industrial Microbiology Sales?

  • Anionic linear polysaccharide, belonging to the glycosaminoglycans family is hyaluronic acid, which has become highly sought-after in dermatology applications.
  • Thanks to better access to the internet, consumers are rendered aware of the uses of various potent chemicals in skincare and dermatology.
  • Demand for better-performing skin care products continues to create opportunities for growth in the market.
  • The application of industrial microbiology in the production of excipients, which are essential components in pharmaceutical formulations, can drive sales in the market.
  • Excipients play a crucial role in drug delivery systems, enhancing the stability, solubility, and bioavailability of active pharmaceutical ingredients (APIs).
  • Industrial microbiology techniques are utilized in the production of excipients, such as polysaccharides, microbial enzymes, and fermentation products.
  • The demand for excipients is driven by the growing pharmaceutical industry and the need for specialized formulations, creating opportunities for industrial microbiology companies to offer tailored solutions.
  • Industrial microbiology enables the development of innovative excipients with improved functionalities, leading to increased adoption and sales.
  • The application of industrial microbiology in excipient production contributes to the overall growth of the market by catering to the specific requirements of pharmaceutical manufacturers and supporting the development of advanced drug formulations

Comparative View of the Industrial Microbiology Market

Industrial Microbiology Market:

Attributes Industrial Microbiology Market
CAGR (2023 to 2033) 7.6%
Market Value (2033) US$ 32.12 billion
Opportunity The increasing demand for microbial products in various industries, such as healthcare, food and beverages, and agriculture, presents a significant opportunity for industrial microbiology companies to develop innovative solutions and expand their market presence.
Key Trends The rising adoption of synthetic biology techniques, including genetic engineering and metabolic engineering, is a notable trend in the industrial microbiology market.

Microbial Fermentation Technology Market:

Attributes Microbial Fermentation Technology Market
CAGR (2023 to 2033) 5.7%
Market Value (2033) US$ 56.97 billion
Opportunity This industry is projected to experience significant growth over the course of the projected period thanks to developments in bio-processing and the creation of novel microbial strains.
Key Trends The creation of new microbial strains using CRISPR-Cas9 technology and the utilization of those strains to produce uncommon chemicals.

Microbial Identification Market:

Attributes Microbial Identification Market
CAGR (2023 to 2033) 11.3%
Market Value (2033) US$ 11.91 billion
Opportunity Increasing demand for rapid and accurate microbial identification methods in various industries, including pharmaceuticals, food and beverages, and clinical diagnostics, presents a significant opportunity for companies offering microbial identification solutions.
Key Trends The adoption of advanced technologies, such as molecular diagnostics, genomics, and proteomics, is a key trend in the microbial identification market.

Get the data you need at a Fraction of the cost

Personalize your report by choosing insights you need
and save 40%!

Country-wise Insights

How the United States of America is at the Forefront of the Market for Industrial Microbiology?

The United States of America is quite likely to lead North America’s industrial microbiology market over the forecast period, where North America held a value share of 27.8% in 2022.

The expansion of the pharmaceutical & biotechnology industry has paved the way for increased adoption of sterility testing across the country. Moreover, increased research & development activities in the field of the pharmaceutical industry along with drug discovery have propelled the industrial microbiology market growth.

Industrial microbiology applications across the United States of America are gaining popularity in the pharmaceutical excipients industry. The significantly growing food & beverage industry has also boosted the growth of industrial microbiology.

The increasing usage of microorganisms in the syrup formulations has improved the adoption of sterility as well as bio-burden testing. Further, the rising drug development and growing demand for pathogen testing in food products have significantly improved growth opportunities.

Stringent regulatory frameworks associated with anti-microbial food additives and favorable policies supporting the adoption of sterility testing have accelerated the demand for industrial microbiology, especially within the food & beverage industry. For instance,

In a 2020 report of the USA Food and Drug Administration for pharmaceutical microbiology, the government made it mandatory to go through a sterility and bio-burden test to examine the toxicity level of a drug or additive.

The United States of America market is expected to post substantial gains over the forecast period with a value share of 21.4% in 2022 on a global level, with the rapid adoption of sterility testing within the food & beverage industry,

What are the Factors Driving Industrial Microbiology Demand in China?

The expansion of the biopharmaceutical industry and increasing adoption of sterility testing within the pharmaceutical & food and beverage industry have improved the demand for industrial microbiology.

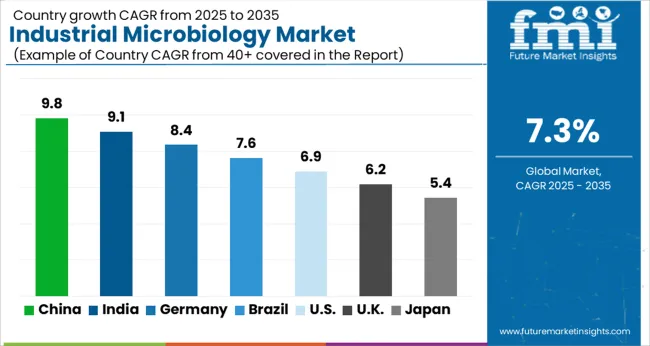
As per Future Market Insights, China is expected to be the notable market, accounting for a significant share in the global industrial microbiology industry, and is likely to secure a 7.6% CAGR from 2023 to 2033.

With the growing population and rising disposable income, the demand for consumer products is expected to surge, which requires safety and quality testing of the products. Hence, increased adoption of sterility and bio-burden testing within the pharmaceutical industry can improve the demand.

Favorable government regulations and growing public concerns about the products’ safety are likely to accelerate the growth of China’s industrial microbiology market over the coming years.

How does the Industrial Microbiology Industry Growth Unfold in India?

Surging research and development activities within the pharmaceutical industry across India have improved the market demand for industrial microbiology, facilitating the country’s projected growth rate of 7.2% from 2023 to 2033.

The rising population and increasing demand for consumer products such as food additives and growing drug discovery push forward the adoption of sterility testing within the pharmaceutical and food & beverage industry.

The development and production of products rich in hyaluronic acid within dermatology applications have boosted revenue growth. Moreover, favorable regulatory policies and increasing investment from the government in research & development activities bolster the market growth during the forecast period.

Spiking healthcare spending and expansion of the pharmaceutical industry create growth opportunities. Furthermore, leading companies in the industrial microbiology market are shifting their production base with research & development activities across India for industrial microbiology applications due to additional benefits such as low labor, production, and land cost.

Category-wise Insights

Which Product Type in Industrial Microbiology is Gaining Popularity?

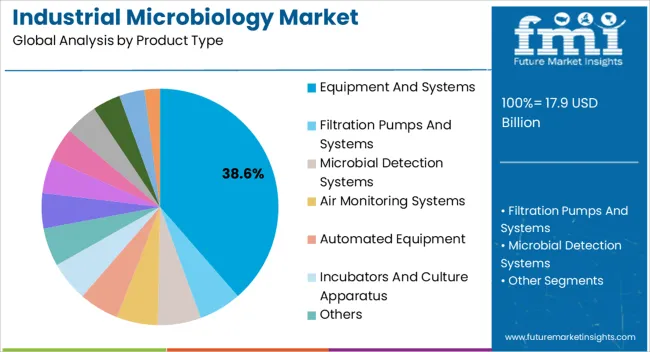
In terms of product type, the market is segmented into equipment & systems, reaction consumables, and others. As per FMI’s analysis, reaction consumables acquired a market share of 61.07% in 2022.

The soaring usage of reagents in the research and development activities on drug delivery is likely to improve the segment as well as market growth. Besides this, application in the biotechnological industry has improved the adoption of automated equipment and microbial detection systems.

Filtration pumps & systems, and air monitoring systems are extensively adopted, thereby improving the segment’s growth, with the rise in drug-related discovery in the pharmaceutical industry,

What Test Type is Expected to Gain Preference in the Industrial Microbiology Industry?

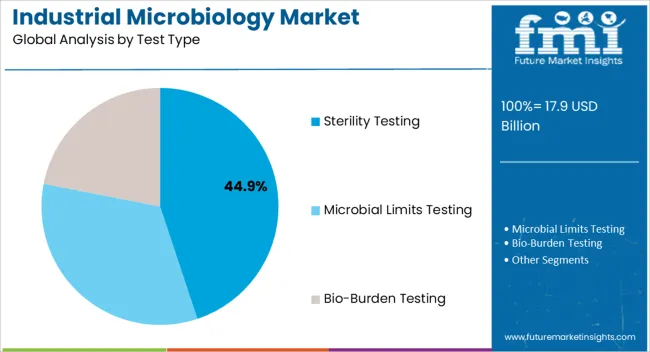
Sterility test type in industrial microbiology plays an important role in the food & beverage and pharmaceutical industries for quality check of products. Further, with extensive adoption of sterility tests in the pharmaceutical and food & beverages industry, the segment is expected to witness high demand over the forecast period.

Bio-burden, environment, and water tests are conducted on a large scale in the pharmaceutical industries. Moreover, industrial microbiology applications such as bio-burden tests are performed for aerobic or anaerobic organism testing, which is prompting growth within the segment. With the bio-pharmaceutical industry witnessing an upsurge, the adoption of sterility and bio-burden testing has gained prevalence.

By the FMI study, the sterility test type garnered a value share of 34.21% in 2022 on a global level.

Who is the Leading End User of Industrial Microbiology?

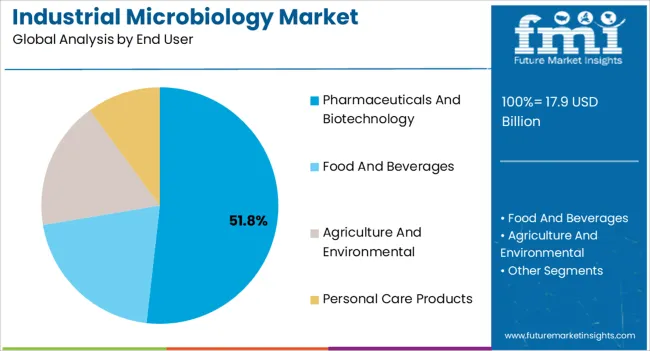
Future Market Insights have sub-segmented the end user segment into pharmaceuticals & biotechnology, food & beverages, agriculture & environmental, and personal care products. As per the study, the pharmaceutical & biotechnology segment is anticipated to witness high growth during the forecast period and accounted for 51.7% market share in 2022.

The uptick in research & development activities within the pharmaceutical industry related to industrial microbiology has augmented over the years and is expected to propel in the future. As per the report by the Association of British Pharmaceutical Industry (ABPI), increased investment in research & development activities aimed at developing industrial microbiology products has increased the expenditure on healthcare.

As per ABPI, the pharmaceutical industry invested around US$ 156.7 billion in 2016 and is expected to invest more in the upcoming years, accelerating market growth.
What is the Competitive Landscape in the Industrial Microbiology Market?

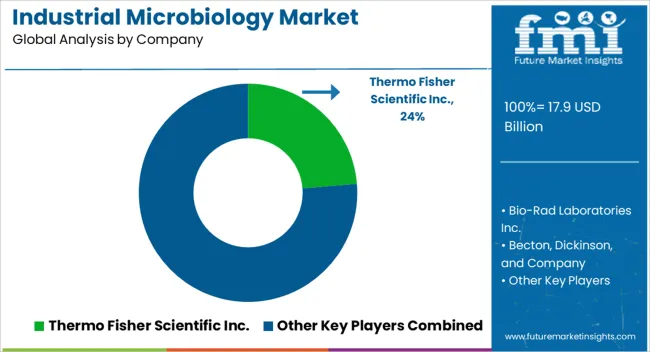
With a few top tier-1 players such as Thermo Fisher Scientific Inc., Merck KGaA, and BioMerieuxx dominating the market, the market is consolidated in nature, opines market study by FMI.

As per the study, the market for industrial microbiology is almost monopolistic with leading players expanding their existing wide product portfolio to maintain their lead in the industry.

These leading players have a strong presence and hold a significant market share in the industrial microbiology industry.

Their extensive product portfolios, technological advancements, and robust distribution networks contribute to their market dominance. However, the market also offers opportunities for small players to enter niche segments and cater to specific customer requirements, fostering competition and innovation within the industry.

Strategic mergers and acquisitions are sought-after among top healthcare companies. Stringent government regulations thwart the entry of new players, making the top players dominant in the industry. Leading players are relying on new product launches and other inorganic strategies to generate large revenues.

Key Players Operating in the Market

  • Thermo Fisher Scientific Inc.
  • Bio-Rad Laboratories Inc.
  • Becton, Dickinson, and Company
  • Asiagel Corporation
  • Eppendorf AG
  • BioMerieuxx SA
  • Novamed
  • QIAGEN
  • Sartorius AG
  • 3M
  • Merck KGaA
  • Danaher Corporation
  • Others

Developments in the Market:

  • In 2018, BioMerieuxx, a world leader in the field of industrial microbiological control, announced the launch of ENDOZYME® II GO, a new endotoxin test in the BioMerieuxx ENDONEXT™ range of recombinant horseshoe crab Factor C assays.
  • Aberdeen-based microbiology, another leading player, in 2019, and biological material storage company NCIMB Ltd announced the collaboration with German distributor Doenitz Prolab to expand their consumer base and offer microbiology products & services.

Market Segmentation by Category

By Product Type:

  • Equipment and Systems
    • Filtration Pumps and Systems
    • Microbial Detection Systems
    • Air Monitoring Systems
    • Automated Equipment
    • Incubators and Culture Apparatus
    • Others
  • Reaction Consumables
    • Media
    • Simple Media
    • Complex Media
    • Defined Media
    • Specialty Media
    • Reagents and Strains
  • Others
    • Laboratory Supplies
    • Bags and Bottles
    • Loop and Needles
    • Petri Dishes, Racks, Seals, Plates, and Holders
    • Filtration Disc and Membranes
    • Others

By End User:

  • Pharmaceuticals and Biotechnology
  • Food and Beverages
  • Agriculture and Environmental
  • Personal Care Products

By Test Type:

  • Sterility Testing
  • Microbial Limits Testing
  • Bio-burden Testing

By Region:

  • North America
  • Latin America
  • Western Europe
  • Eastern Europe
  • Japan
  • Asia Pacific Excluding Japan (APEJ)
  • The Middle East & Africa (MEA)

Frequently Asked Questions

What is the Forecasted Growth Rate for the Global Industrial Microbiology Market?

The global market is forecasted to develop at an impressive 7.6% CAGR until 2033.

Which is the Leading Regional Market for Industrial Microbiology Products and Services?

The total demand for in the United States alone accounted for 27.8% of the global market share in 2022.

What is the Growth Trend in Asian Countries in Adoption of Industrial Microbiology?

China is likely to secure 7.6% CAGR through 2033 followed by India at 7.2% CAGR.

Which End User Segment Creates a Higher Demand for Industrial Microbiology?

The pharmaceutical and biotechnology segment generated almost 51.7% of the total demand in 2022.

Which Product Type Remains a Promising Segment for the Global Industrial Microbiology Market?

The reaction consumables acquired nearly 61% of the global market share in 2022.

Table of Content

1. Executive Summary

    1.1. Global Market Outlook

    1.2. Demand-side Trends

    1.3. Supply-side Trends

    1.4. Technology Roadmap Analysis

    1.5. Analysis and Recommendations

2. Market Overview

    2.1. Market Coverage / Taxonomy

    2.2. Market Definition / Scope / Limitations

3. Market Background

    3.1. Market Dynamics

        3.1.1. Drivers

        3.1.2. Restraints

        3.1.3. Opportunity

        3.1.4. Trends

    3.2. Scenario Forecast

        3.2.1. Demand in Optimistic Scenario

        3.2.2. Demand in Likely Scenario

        3.2.3. Demand in Conservative Scenario

    3.3. Opportunity Map Analysis

    3.4. Investment Feasibility Matrix

    3.5. PESTLE and Porter’s Analysis

    3.6. Regulatory Landscape

        3.6.1. By Key Regions

        3.6.2. By Key Countries

    3.7. Regional Parent Market Outlook

4. Global Market  Analysis 2018 to 2022 and Forecast, 2023 to 2033

    4.1. Historical Market Size Value (US$ Million) Analysis, 2018 to 2022

    4.2. Current and Future Market Size Value (US$ Million) Projections, 2023 to 2033

        4.2.1. Y-o-Y Growth Trend Analysis

        4.2.2. Absolute $ Opportunity Analysis

5. Global Market  Analysis 2018 to 2022 and Forecast 2023 to 2033, By Product Type

    5.1. Introduction / Key Findings

    5.2. Historical Market Size Value (US$ Million) Analysis By Product Type, 2018 to 2022

    5.3. Current and Future Market Size Value (US$ Million) Analysis and Forecast By Product Type, 2023 to 2033

        5.3.1. Equipment and Systems

            5.3.1.1. Filtration Pumps and Systems

            5.3.1.2. Microbial Detection Systems

            5.3.1.3. Air Monitoring Systems

            5.3.1.4. Automated Equipment

            5.3.1.5. Incubators and Culture Apparatus

            5.3.1.6. Others

        5.3.2. Reaction Consumables

            5.3.2.1. Media

            5.3.2.2. Simple Media

            5.3.2.3. Complex Media

            5.3.2.4. Defined Media

            5.3.2.5. Specialty Media

            5.3.2.6. Reagents and Strains

        5.3.3. Others

            5.3.3.1. Laboratory Supplies

            5.3.3.2. Bags and Bottles

            5.3.3.3. Loop and Needles

            5.3.3.4. Petri Dishes, Racks, Seals, Plates and Holders

            5.3.3.5. Others

    5.4. Y-o-Y Growth Trend Analysis By Product Type, 2018 to 2022

    5.5. Absolute $ Opportunity Analysis By Product Type, 2023 to 2033

6. Global Market  Analysis 2018 to 2022 and Forecast 2023 to 2033, By End User

    6.1. Introduction / Key Findings

    6.2. Historical Market Size Value (US$ Million) Analysis By End User, 2018 to 2022

    6.3. Current and Future Market Size Value (US$ Million) Analysis and Forecast By End User, 2023 to 2033

        6.3.1. Pharmaceuticals and Biotechnology

        6.3.2. Food and Beverages

        6.3.3. Agriculture and Environmental

        6.3.4. Personal Care Products

    6.4. Y-o-Y Growth Trend Analysis By End User, 2018 to 2022

    6.5. Absolute $ Opportunity Analysis By End User, 2023 to 2033

7. Global Market  Analysis 2018 to 2022 and Forecast 2023 to 2033, By Test Type

    7.1. Introduction / Key Findings

    7.2. Historical Market Size Value (US$ Million) Analysis By Test Type, 2018 to 2022

    7.3. Current and Future Market Size Value (US$ Million) Analysis and Forecast By Test Type, 2023 to 2033

        7.3.1. Sterility Testing

        7.3.2. Microbial Limits Testing

        7.3.3. Bio-burden Testing

    7.4. Y-o-Y Growth Trend Analysis By Test Type, 2018 to 2022

    7.5. Absolute $ Opportunity Analysis By Test Type, 2023 to 2033

8. Global Market  Analysis 2018 to 2022 and Forecast 2023 to 2033, By Region

    8.1. Introduction

    8.2. Historical Market Size Value (US$ Million) Analysis By Region, 2018 to 2022

    8.3. Current Market Size Value (US$ Million) Analysis and Forecast By Region, 2023 to 2033

        8.3.1. North America

        8.3.2. Latin America

        8.3.3. Western Europe

        8.3.4. Eastern Europe

        8.3.5. South Asia and Pacific

        8.3.6. East Asia

        8.3.7. Middle East & Africa

    8.4. Market Attractiveness Analysis By Region

9. North America Market  Analysis 2018 to 2022 and Forecast 2023 to 2033, By Country

    9.1. Historical Market Size Value (US$ Million) Trend Analysis By Market Taxonomy, 2018 to 2022

    9.2. Market Size Value (US$ Million) Forecast By Market Taxonomy, 2023 to 2033

        9.2.1. By Country

            9.2.1.1. USA

            9.2.1.2. Canada

        9.2.2. By Product Type

        9.2.3. By End User

        9.2.4. By Test Type

    9.3. Market Attractiveness Analysis

        9.3.1. By Country

        9.3.2. By Product Type

        9.3.3. By End User

        9.3.4. By Test Type

    9.4. Key Takeaways

10. Latin America Market  Analysis 2018 to 2022 and Forecast 2023 to 2033, By Country

    10.1. Historical Market Size Value (US$ Million) Trend Analysis By Market Taxonomy, 2018 to 2022

    10.2. Market Size Value (US$ Million) Forecast By Market Taxonomy, 2023 to 2033

        10.2.1. By Country

            10.2.1.1. Brazil

            10.2.1.2. Mexico

            10.2.1.3. Argentina

            10.2.1.4. Rest of Latin America

        10.2.2. By Product Type

        10.2.3. By End User

        10.2.4. By Test Type

    10.3. Market Attractiveness Analysis

        10.3.1. By Country

        10.3.2. By Product Type

        10.3.3. By End User

        10.3.4. By Test Type

    10.4. Key Takeaways

11. Western Europe  Market  Analysis 2018 to 2022 and Forecast 2023 to 2033, By Country

    11.1. Historical Market Size Value (US$ Million) Trend Analysis By Market Taxonomy, 2018 to 2022

    11.2. Market Size Value (US$ Million) Forecast By Market Taxonomy, 2023 to 2033

        11.2.1. By Country

            11.2.1.1. UK

            11.2.1.2. Germany

            11.2.1.3. France

            11.2.1.4. Italy

            11.2.1.5. Spain

            11.2.1.6. Rest of Western Europe

        11.2.2. By Product Type

        11.2.3. By End User

        11.2.4. By Test Type

    11.3. Market Attractiveness Analysis

        11.3.1. By Country

        11.3.2. By Product Type

        11.3.3. By End User

        11.3.4. By Test Type

    11.4. Key Takeaways

12. Eastern Europe  Market  Analysis 2018 to 2022 and Forecast 2023 to 2033, By Country

    12.1. Historical Market Size Value (US$ Million) Trend Analysis By Market Taxonomy, 2018 to 2022

    12.2. Market Size Value (US$ Million) Forecast By Market Taxonomy, 2023 to 2033

        12.2.1. By Country

            12.2.1.1. Russia

            12.2.1.2. Poland

            12.2.1.3. Czech Republic

            12.2.1.4. Romania

            12.2.1.5. Rest of Eastern Europe

        12.2.2. By Product Type

        12.2.3. By End User

        12.2.4. By Test Type

    12.3. Market Attractiveness Analysis

        12.3.1. By Country

        12.3.2. By Product Type

        12.3.3. By End User

        12.3.4. By Test Type

    12.4. Key Takeaways

13. South Asia and Pacific  Market  Analysis 2018 to 2022 and Forecast 2023 to 2033, By Country

    13.1. Historical Market Size Value (US$ Million) Trend Analysis By Market Taxonomy, 2018 to 2022

    13.2. Market Size Value (US$ Million) Forecast By Market Taxonomy, 2023 to 2033

        13.2.1. By Country

            13.2.1.1. India

            13.2.1.2. Bangladesh

            13.2.1.3. Australia

            13.2.1.4. New Zealand

            13.2.1.5. Rest of South Asia and Pacific

        13.2.2. By Product Type

        13.2.3. By End User

        13.2.4. By Test Type

    13.3. Market Attractiveness Analysis

        13.3.1. By Country

        13.3.2. By Product Type

        13.3.3. By End User

        13.3.4. By Test Type

    13.4. Key Takeaways

14. East Asia  Market  Analysis 2018 to 2022 and Forecast 2023 to 2033, By Country

    14.1. Historical Market Size Value (US$ Million) Trend Analysis By Market Taxonomy, 2018 to 2022

    14.2. Market Size Value (US$ Million) Forecast By Market Taxonomy, 2023 to 2033

        14.2.1. By Country

            14.2.1.1. China

            14.2.1.2. Japan

            14.2.1.3. South Korea

        14.2.2. By Product Type

        14.2.3. By End User

        14.2.4. By Test Type

    14.3. Market Attractiveness Analysis

        14.3.1. By Country

        14.3.2. By Product Type

        14.3.3. By End User

        14.3.4. By Test Type

    14.4. Key Takeaways

15. Middle East & Africa Market  Analysis 2018 to 2022 and Forecast 2023 to 2033, By Country

    15.1. Historical Market Size Value (US$ Million) Trend Analysis By Market Taxonomy, 2018 to 2022

    15.2. Market Size Value (US$ Million) Forecast By Market Taxonomy, 2023 to 2033

        15.2.1. By Country

            15.2.1.1. Iran

            15.2.1.2. Turkey

            15.2.1.3. Rest of MEA

        15.2.2. By Product Type

        15.2.3. By End User

        15.2.4. By Test Type

    15.3. Market Attractiveness Analysis

        15.3.1. By Country

        15.3.2. By Product Type

        15.3.3. By End User

        15.3.4. By Test Type

    15.4. Key Takeaways

16. Key Countries Market  Analysis

    16.1. USA

        16.1.1. Pricing Analysis

        16.1.2. Market Share Analysis, 2022

            16.1.2.1. By Product Type

            16.1.2.2. By End User

            16.1.2.3. By Test Type

    16.2. Canada

        16.2.1. Pricing Analysis

        16.2.2. Market Share Analysis, 2022

            16.2.2.1. By Product Type

            16.2.2.2. By End User

            16.2.2.3. By Test Type

    16.3. Brazil

        16.3.1. Pricing Analysis

        16.3.2. Market Share Analysis, 2022

            16.3.2.1. By Product Type

            16.3.2.2. By End User

            16.3.2.3. By Test Type

    16.4. Mexico

        16.4.1. Pricing Analysis

        16.4.2. Market Share Analysis, 2022

            16.4.2.1. By Product Type

            16.4.2.2. By End User

            16.4.2.3. By Test Type

    16.5. Argentina

        16.5.1. Pricing Analysis

        16.5.2. Market Share Analysis, 2022

            16.5.2.1. By Product Type

            16.5.2.2. By End User

            16.5.2.3. By Test Type

    16.6. UK

        16.6.1. Pricing Analysis

        16.6.2. Market Share Analysis, 2022

            16.6.2.1. By Product Type

            16.6.2.2. By End User

            16.6.2.3. By Test Type

    16.7. Germany

        16.7.1. Pricing Analysis

        16.7.2. Market Share Analysis, 2022

            16.7.2.1. By Product Type

            16.7.2.2. By End User

            16.7.2.3. By Test Type

    16.8. France

        16.8.1. Pricing Analysis

        16.8.2. Market Share Analysis, 2022

            16.8.2.1. By Product Type

            16.8.2.2. By End User

            16.8.2.3. By Test Type

    16.9. Italy

        16.9.1. Pricing Analysis

        16.9.2. Market Share Analysis, 2022

            16.9.2.1. By Product Type

            16.9.2.2. By End User

            16.9.2.3. By Test Type

    16.10. Spain

        16.10.1. Pricing Analysis

        16.10.2. Market Share Analysis, 2022

            16.10.2.1. By Product Type

            16.10.2.2. By End User

            16.10.2.3. By Test Type

    16.11. Russia

        16.11.1. Pricing Analysis

        16.11.2. Market Share Analysis, 2022

            16.11.2.1. By Product Type

            16.11.2.2. By End User

            16.11.2.3. By Test Type

    16.12. Poland

        16.12.1. Pricing Analysis

        16.12.2. Market Share Analysis, 2022

            16.12.2.1. By Product Type

            16.12.2.2. By End User

            16.12.2.3. By Test Type

    16.13. Czech Republic

        16.13.1. Pricing Analysis

        16.13.2. Market Share Analysis, 2022

            16.13.2.1. By Product Type

            16.13.2.2. By End User

            16.13.2.3. By Test Type

    16.14. Romania

        16.14.1. Pricing Analysis

        16.14.2. Market Share Analysis, 2022

            16.14.2.1. By Product Type

            16.14.2.2. By End User

            16.14.2.3. By Test Type

    16.15. India

        16.15.1. Pricing Analysis

        16.15.2. Market Share Analysis, 2022

            16.15.2.1. By Product Type

            16.15.2.2. By End User

            16.15.2.3. By Test Type

    16.16. Bangladesh

        16.16.1. Pricing Analysis

        16.16.2. Market Share Analysis, 2022

            16.16.2.1. By Product Type

            16.16.2.2. By End User

            16.16.2.3. By Test Type

    16.17. Australia

        16.17.1. Pricing Analysis

        16.17.2. Market Share Analysis, 2022

            16.17.2.1. By Product Type

            16.17.2.2. By End User

            16.17.2.3. By Test Type

    16.18. New Zealand

        16.18.1. Pricing Analysis

        16.18.2. Market Share Analysis, 2022

            16.18.2.1. By Product Type

            16.18.2.2. By End User

            16.18.2.3. By Test Type

    16.19. China

        16.19.1. Pricing Analysis

        16.19.2. Market Share Analysis, 2022

            16.19.2.1. By Product Type

            16.19.2.2. By End User

            16.19.2.3. By Test Type

    16.20. Japan

        16.20.1. Pricing Analysis

        16.20.2. Market Share Analysis, 2022

            16.20.2.1. By Product Type

            16.20.2.2. By End User

            16.20.2.3. By Test Type

    16.21. South Korea

        16.21.1. Pricing Analysis

        16.21.2. Market Share Analysis, 2022

            16.21.2.1. By Product Type

            16.21.2.2. By End User

            16.21.2.3. By Test Type

    16.22. Iran

        16.22.1. Pricing Analysis

        16.22.2. Market Share Analysis, 2022

            16.22.2.1. By Product Type

            16.22.2.2. By End User

            16.22.2.3. By Test Type

    16.23. Turkey

        16.23.1. Pricing Analysis

        16.23.2. Market Share Analysis, 2022

            16.23.2.1. By Product Type

            16.23.2.2. By End User

            16.23.2.3. By Test Type

17. Market Structure Analysis

    17.1. Competition Dashboard

    17.2. Competition Benchmarking

    17.3. Market Share Analysis of Top Players

        17.3.1. By Regional

        17.3.2. By Product Type

        17.3.3. By End User

        17.3.4. By Test Type

18. Competition Analysis

    18.1. Competition Deep Dive

        18.1.1. Thermo Fisher Scientific Inc.

            18.1.1.1. Overview

            18.1.1.2. Product Portfolio

            18.1.1.3. Profitability by Market Segments

            18.1.1.4. Sales Footprint

            18.1.1.5. Strategy Overview

                18.1.1.5.1. Marketing Strategy

        18.1.2. Bio-Rad laboratories Inc.

            18.1.2.1. Overview

            18.1.2.2. Product Portfolio

            18.1.2.3. Profitability by Market Segments

            18.1.2.4. Sales Footprint

            18.1.2.5. Strategy Overview

                18.1.2.5.1. Marketing Strategy

        18.1.3. Becton, Dickinson and Company

            18.1.3.1. Overview

            18.1.3.2. Product Portfolio

            18.1.3.3. Profitability by Market Segments

            18.1.3.4. Sales Footprint

            18.1.3.5. Strategy Overview

                18.1.3.5.1. Marketing Strategy

        18.1.4. Asiagel Corporation

            18.1.4.1. Overview

            18.1.4.2. Product Portfolio

            18.1.4.3. Profitability by Market Segments

            18.1.4.4. Sales Footprint

            18.1.4.5. Strategy Overview

                18.1.4.5.1. Marketing Strategy

        18.1.5. Eppendorf AG

            18.1.5.1. Overview

            18.1.5.2. Product Portfolio

            18.1.5.3. Profitability by Market Segments

            18.1.5.4. Sales Footprint

            18.1.5.5. Strategy Overview

                18.1.5.5.1. Marketing Strategy

        18.1.6. BioMerieuxx SA

            18.1.6.1. Overview

            18.1.6.2. Product Portfolio

            18.1.6.3. Profitability by Market Segments

            18.1.6.4. Sales Footprint

            18.1.6.5. Strategy Overview

                18.1.6.5.1. Marketing Strategy

        18.1.7. Novamed

            18.1.7.1. Overview

            18.1.7.2. Product Portfolio

            18.1.7.3. Profitability by Market Segments

            18.1.7.4. Sales Footprint

            18.1.7.5. Strategy Overview

                18.1.7.5.1. Marketing Strategy

        18.1.8. QIAGEN

            18.1.8.1. Overview

            18.1.8.2. Product Portfolio

            18.1.8.3. Profitability by Market Segments

            18.1.8.4. Sales Footprint

            18.1.8.5. Strategy Overview

                18.1.8.5.1. Marketing Strategy

        18.1.9. Sartorius AG

            18.1.9.1. Overview

            18.1.9.2. Product Portfolio

            18.1.9.3. Profitability by Market Segments

            18.1.9.4. Sales Footprint

            18.1.9.5. Strategy Overview

                18.1.9.5.1. Marketing Strategy

        18.1.10. 3M

            18.1.10.1. Overview

            18.1.10.2. Product Portfolio

            18.1.10.3. Profitability by Market Segments

            18.1.10.4. Sales Footprint

            18.1.10.5. Strategy Overview

                18.1.10.5.1. Marketing Strategy

        18.1.11. Merck KGaA

            18.1.11.1. Overview

            18.1.11.2. Product Portfolio

            18.1.11.3. Profitability by Market Segments

            18.1.11.4. Sales Footprint

            18.1.11.5. Strategy Overview

                18.1.11.5.1. Marketing Strategy

        18.1.12. Danaher Corporation

            18.1.12.1. Overview

            18.1.12.2. Product Portfolio

            18.1.12.3. Profitability by Market Segments

            18.1.12.4. Sales Footprint

            18.1.12.5. Strategy Overview

                18.1.12.5.1. Marketing Strategy

19. Assumptions & Acronyms Used

20. Research Methodology

Don't pay for what you don't need

Customize your report by selecting specific countries or regions and save 30%!

List of Tables

Table 1: Global Market Value (US$ Million) Forecast by Region, 2018 to 2033

Table 2: Global Market Value (US$ Million) Forecast by Product Type, 2018 to 2033

Table 3: Global Market Value (US$ Million) Forecast by End User, 2018 to 2033

Table 4: Global Market Value (US$ Million) Forecast by Test Type, 2018 to 2033

Table 5: North America Market Value (US$ Million) Forecast by Country, 2018 to 2033

Table 6: North America Market Value (US$ Million) Forecast by Product Type, 2018 to 2033

Table 7: North America Market Value (US$ Million) Forecast by End User, 2018 to 2033

Table 8: North America Market Value (US$ Million) Forecast by Test Type, 2018 to 2033

Table 9: Latin America Market Value (US$ Million) Forecast by Country, 2018 to 2033

Table 10: Latin America Market Value (US$ Million) Forecast by Product Type, 2018 to 2033

Table 11: Latin America Market Value (US$ Million) Forecast by End User, 2018 to 2033

Table 12: Latin America Market Value (US$ Million) Forecast by Test Type, 2018 to 2033

Table 13: Western Europe Market Value (US$ Million) Forecast by Country, 2018 to 2033

Table 14: Western Europe Market Value (US$ Million) Forecast by Product Type, 2018 to 2033

Table 15: Western Europe Market Value (US$ Million) Forecast by End User, 2018 to 2033

Table 16: Western Europe Market Value (US$ Million) Forecast by Test Type, 2018 to 2033

Table 17: Eastern Europe Market Value (US$ Million) Forecast by Country, 2018 to 2033

Table 18: Eastern Europe Market Value (US$ Million) Forecast by Product Type, 2018 to 2033

Table 19: Eastern Europe Market Value (US$ Million) Forecast by End User, 2018 to 2033

Table 20: Eastern Europe Market Value (US$ Million) Forecast by Test Type, 2018 to 2033

Table 21: South Asia and Pacific Market Value (US$ Million) Forecast by Country, 2018 to 2033

Table 22: South Asia and Pacific Market Value (US$ Million) Forecast by Product Type, 2018 to 2033

Table 23: South Asia and Pacific Market Value (US$ Million) Forecast by End User, 2018 to 2033

Table 24: South Asia and Pacific Market Value (US$ Million) Forecast by Test Type, 2018 to 2033

Table 25: East Asia Market Value (US$ Million) Forecast by Country, 2018 to 2033

Table 26: East Asia Market Value (US$ Million) Forecast by Product Type, 2018 to 2033

Table 27: East Asia Market Value (US$ Million) Forecast by End User, 2018 to 2033

Table 28: East Asia Market Value (US$ Million) Forecast by Test Type, 2018 to 2033

Table 29: Middle East & Africa Market Value (US$ Million) Forecast by Country, 2018 to 2033

Table 30: Middle East & Africa Market Value (US$ Million) Forecast by Product Type, 2018 to 2033

Table 31: Middle East & Africa Market Value (US$ Million) Forecast by End User, 2018 to 2033

Table 32: Middle East & Africa Market Value (US$ Million) Forecast by Test Type, 2018 to 2033

Sabyasachi Ghosh
Sabyasachi Ghosh

Principal Consultant

Talk to Analyst

Find your sweet spots for generating winning opportunities in this market.

List of Charts

Figure 1: Global Market Value (US$ Million) by Product Type, 2023 to 2033

Figure 2: Global Market Value (US$ Million) by End User, 2023 to 2033

Figure 3: Global Market Value (US$ Million) by Test Type, 2023 to 2033

Figure 4: Global Market Value (US$ Million) by Region, 2023 to 2033

Figure 5: Global Market Value (US$ Million) Analysis by Region, 2018 to 2033

Figure 6: Global Market Value Share (%) and BPS Analysis by Region, 2023 to 2033

Figure 7: Global Market Y-o-Y Growth (%) Projections by Region, 2023 to 2033

Figure 8: Global Market Value (US$ Million) Analysis by Product Type, 2018 to 2033

Figure 9: Global Market Value Share (%) and BPS Analysis by Product Type, 2023 to 2033

Figure 10: Global Market Y-o-Y Growth (%) Projections by Product Type, 2023 to 2033

Figure 11: Global Market Value (US$ Million) Analysis by End User, 2018 to 2033

Figure 12: Global Market Value Share (%) and BPS Analysis by End User, 2023 to 2033

Figure 13: Global Market Y-o-Y Growth (%) Projections by End User, 2023 to 2033

Figure 14: Global Market Value (US$ Million) Analysis by Test Type, 2018 to 2033

Figure 15: Global Market Value Share (%) and BPS Analysis by Test Type, 2023 to 2033

Figure 16: Global Market Y-o-Y Growth (%) Projections by Test Type, 2023 to 2033

Figure 17: Global Market Attractiveness by Product Type, 2023 to 2033

Figure 18: Global Market Attractiveness by End User, 2023 to 2033

Figure 19: Global Market Attractiveness by Test Type, 2023 to 2033

Figure 20: Global Market Attractiveness by Region, 2023 to 2033

Figure 21: North America Market Value (US$ Million) by Product Type, 2023 to 2033

Figure 22: North America Market Value (US$ Million) by End User, 2023 to 2033

Figure 23: North America Market Value (US$ Million) by Test Type, 2023 to 2033

Figure 24: North America Market Value (US$ Million) by Country, 2023 to 2033

Figure 25: North America Market Value (US$ Million) Analysis by Country, 2018 to 2033

Figure 26: North America Market Value Share (%) and BPS Analysis by Country, 2023 to 2033

Figure 27: North America Market Y-o-Y Growth (%) Projections by Country, 2023 to 2033

Figure 28: North America Market Value (US$ Million) Analysis by Product Type, 2018 to 2033

Figure 29: North America Market Value Share (%) and BPS Analysis by Product Type, 2023 to 2033

Figure 30: North America Market Y-o-Y Growth (%) Projections by Product Type, 2023 to 2033

Figure 31: North America Market Value (US$ Million) Analysis by End User, 2018 to 2033

Figure 32: North America Market Value Share (%) and BPS Analysis by End User, 2023 to 2033

Figure 33: North America Market Y-o-Y Growth (%) Projections by End User, 2023 to 2033

Figure 34: North America Market Value (US$ Million) Analysis by Test Type, 2018 to 2033

Figure 35: North America Market Value Share (%) and BPS Analysis by Test Type, 2023 to 2033

Figure 36: North America Market Y-o-Y Growth (%) Projections by Test Type, 2023 to 2033

Figure 37: North America Market Attractiveness by Product Type, 2023 to 2033

Figure 38: North America Market Attractiveness by End User, 2023 to 2033

Figure 39: North America Market Attractiveness by Test Type, 2023 to 2033

Figure 40: North America Market Attractiveness by Country, 2023 to 2033

Figure 41: Latin America Market Value (US$ Million) by Product Type, 2023 to 2033

Figure 42: Latin America Market Value (US$ Million) by End User, 2023 to 2033

Figure 43: Latin America Market Value (US$ Million) by Test Type, 2023 to 2033

Figure 44: Latin America Market Value (US$ Million) by Country, 2023 to 2033

Figure 45: Latin America Market Value (US$ Million) Analysis by Country, 2018 to 2033

Figure 46: Latin America Market Value Share (%) and BPS Analysis by Country, 2023 to 2033

Figure 47: Latin America Market Y-o-Y Growth (%) Projections by Country, 2023 to 2033

Figure 48: Latin America Market Value (US$ Million) Analysis by Product Type, 2018 to 2033

Figure 49: Latin America Market Value Share (%) and BPS Analysis by Product Type, 2023 to 2033

Figure 50: Latin America Market Y-o-Y Growth (%) Projections by Product Type, 2023 to 2033

Figure 51: Latin America Market Value (US$ Million) Analysis by End User, 2018 to 2033

Figure 52: Latin America Market Value Share (%) and BPS Analysis by End User, 2023 to 2033

Figure 53: Latin America Market Y-o-Y Growth (%) Projections by End User, 2023 to 2033

Figure 54: Latin America Market Value (US$ Million) Analysis by Test Type, 2018 to 2033

Figure 55: Latin America Market Value Share (%) and BPS Analysis by Test Type, 2023 to 2033

Figure 56: Latin America Market Y-o-Y Growth (%) Projections by Test Type, 2023 to 2033

Figure 57: Latin America Market Attractiveness by Product Type, 2023 to 2033

Figure 58: Latin America Market Attractiveness by End User, 2023 to 2033

Figure 59: Latin America Market Attractiveness by Test Type, 2023 to 2033

Figure 60: Latin America Market Attractiveness by Country, 2023 to 2033

Figure 61: Western Europe Market Value (US$ Million) by Product Type, 2023 to 2033

Figure 62: Western Europe Market Value (US$ Million) by End User, 2023 to 2033

Figure 63: Western Europe Market Value (US$ Million) by Test Type, 2023 to 2033

Figure 64: Western Europe Market Value (US$ Million) by Country, 2023 to 2033

Figure 65: Western Europe Market Value (US$ Million) Analysis by Country, 2018 to 2033

Figure 66: Western Europe Market Value Share (%) and BPS Analysis by Country, 2023 to 2033

Figure 67: Western Europe Market Y-o-Y Growth (%) Projections by Country, 2023 to 2033

Figure 68: Western Europe Market Value (US$ Million) Analysis by Product Type, 2018 to 2033

Figure 69: Western Europe Market Value Share (%) and BPS Analysis by Product Type, 2023 to 2033

Figure 70: Western Europe Market Y-o-Y Growth (%) Projections by Product Type, 2023 to 2033

Figure 71: Western Europe Market Value (US$ Million) Analysis by End User, 2018 to 2033

Figure 72: Western Europe Market Value Share (%) and BPS Analysis by End User, 2023 to 2033

Figure 73: Western Europe Market Y-o-Y Growth (%) Projections by End User, 2023 to 2033

Figure 74: Western Europe Market Value (US$ Million) Analysis by Test Type, 2018 to 2033

Figure 75: Western Europe Market Value Share (%) and BPS Analysis by Test Type, 2023 to 2033

Figure 76: Western Europe Market Y-o-Y Growth (%) Projections by Test Type, 2023 to 2033

Figure 77: Western Europe Market Attractiveness by Product Type, 2023 to 2033

Figure 78: Western Europe Market Attractiveness by End User, 2023 to 2033

Figure 79: Western Europe Market Attractiveness by Test Type, 2023 to 2033

Figure 80: Western Europe Market Attractiveness by Country, 2023 to 2033

Figure 81: Eastern Europe Market Value (US$ Million) by Product Type, 2023 to 2033

Figure 82: Eastern Europe Market Value (US$ Million) by End User, 2023 to 2033

Figure 83: Eastern Europe Market Value (US$ Million) by Test Type, 2023 to 2033

Figure 84: Eastern Europe Market Value (US$ Million) by Country, 2023 to 2033

Figure 85: Eastern Europe Market Value (US$ Million) Analysis by Country, 2018 to 2033

Figure 86: Eastern Europe Market Value Share (%) and BPS Analysis by Country, 2023 to 2033

Figure 87: Eastern Europe Market Y-o-Y Growth (%) Projections by Country, 2023 to 2033

Figure 88: Eastern Europe Market Value (US$ Million) Analysis by Product Type, 2018 to 2033

Figure 89: Eastern Europe Market Value Share (%) and BPS Analysis by Product Type, 2023 to 2033

Figure 90: Eastern Europe Market Y-o-Y Growth (%) Projections by Product Type, 2023 to 2033

Figure 91: Eastern Europe Market Value (US$ Million) Analysis by End User, 2018 to 2033

Figure 92: Eastern Europe Market Value Share (%) and BPS Analysis by End User, 2023 to 2033

Figure 93: Eastern Europe Market Y-o-Y Growth (%) Projections by End User, 2023 to 2033

Figure 94: Eastern Europe Market Value (US$ Million) Analysis by Test Type, 2018 to 2033

Figure 95: Eastern Europe Market Value Share (%) and BPS Analysis by Test Type, 2023 to 2033

Figure 96: Eastern Europe Market Y-o-Y Growth (%) Projections by Test Type, 2023 to 2033

Figure 97: Eastern Europe Market Attractiveness by Product Type, 2023 to 2033

Figure 98: Eastern Europe Market Attractiveness by End User, 2023 to 2033

Figure 99: Eastern Europe Market Attractiveness by Test Type, 2023 to 2033

Figure 100: Eastern Europe Market Attractiveness by Country, 2023 to 2033

Figure 101: South Asia and Pacific Market Value (US$ Million) by Product Type, 2023 to 2033

Figure 102: South Asia and Pacific Market Value (US$ Million) by End User, 2023 to 2033

Figure 103: South Asia and Pacific Market Value (US$ Million) by Test Type, 2023 to 2033

Figure 104: South Asia and Pacific Market Value (US$ Million) by Country, 2023 to 2033

Figure 105: South Asia and Pacific Market Value (US$ Million) Analysis by Country, 2018 to 2033

Figure 106: South Asia and Pacific Market Value Share (%) and BPS Analysis by Country, 2023 to 2033

Figure 107: South Asia and Pacific Market Y-o-Y Growth (%) Projections by Country, 2023 to 2033

Figure 108: South Asia and Pacific Market Value (US$ Million) Analysis by Product Type, 2018 to 2033

Figure 109: South Asia and Pacific Market Value Share (%) and BPS Analysis by Product Type, 2023 to 2033

Figure 110: South Asia and Pacific Market Y-o-Y Growth (%) Projections by Product Type, 2023 to 2033

Figure 111: South Asia and Pacific Market Value (US$ Million) Analysis by End User, 2018 to 2033

Figure 112: South Asia and Pacific Market Value Share (%) and BPS Analysis by End User, 2023 to 2033

Figure 113: South Asia and Pacific Market Y-o-Y Growth (%) Projections by End User, 2023 to 2033

Figure 114: South Asia and Pacific Market Value (US$ Million) Analysis by Test Type, 2018 to 2033

Figure 115: South Asia and Pacific Market Value Share (%) and BPS Analysis by Test Type, 2023 to 2033

Figure 116: South Asia and Pacific Market Y-o-Y Growth (%) Projections by Test Type, 2023 to 2033

Figure 117: South Asia and Pacific Market Attractiveness by Product Type, 2023 to 2033

Figure 118: South Asia and Pacific Market Attractiveness by End User, 2023 to 2033

Figure 119: South Asia and Pacific Market Attractiveness by Test Type, 2023 to 2033

Figure 120: South Asia and Pacific Market Attractiveness by Country, 2023 to 2033

Figure 121: East Asia Market Value (US$ Million) by Product Type, 2023 to 2033

Figure 122: East Asia Market Value (US$ Million) by End User, 2023 to 2033

Figure 123: East Asia Market Value (US$ Million) by Test Type, 2023 to 2033

Figure 124: East Asia Market Value (US$ Million) by Country, 2023 to 2033

Figure 125: East Asia Market Value (US$ Million) Analysis by Country, 2018 to 2033

Figure 126: East Asia Market Value Share (%) and BPS Analysis by Country, 2023 to 2033

Figure 127: East Asia Market Y-o-Y Growth (%) Projections by Country, 2023 to 2033

Figure 128: East Asia Market Value (US$ Million) Analysis by Product Type, 2018 to 2033

Figure 129: East Asia Market Value Share (%) and BPS Analysis by Product Type, 2023 to 2033

Figure 130: East Asia Market Y-o-Y Growth (%) Projections by Product Type, 2023 to 2033

Figure 131: East Asia Market Value (US$ Million) Analysis by End User, 2018 to 2033

Figure 132: East Asia Market Value Share (%) and BPS Analysis by End User, 2023 to 2033

Figure 133: East Asia Market Y-o-Y Growth (%) Projections by End User, 2023 to 2033

Figure 134: East Asia Market Value (US$ Million) Analysis by Test Type, 2018 to 2033

Figure 135: East Asia Market Value Share (%) and BPS Analysis by Test Type, 2023 to 2033

Figure 136: East Asia Market Y-o-Y Growth (%) Projections by Test Type, 2023 to 2033

Figure 137: East Asia Market Attractiveness by Product Type, 2023 to 2033

Figure 138: East Asia Market Attractiveness by End User, 2023 to 2033

Figure 139: East Asia Market Attractiveness by Test Type, 2023 to 2033

Figure 140: East Asia Market Attractiveness by Country, 2023 to 2033

Figure 141: Middle East & Africa Market Value (US$ Million) by Product Type, 2023 to 2033

Figure 142: Middle East & Africa Market Value (US$ Million) by End User, 2023 to 2033

Figure 143: Middle East & Africa Market Value (US$ Million) by Test Type, 2023 to 2033

Figure 144: Middle East & Africa Market Value (US$ Million) by Country, 2023 to 2033

Figure 145: Middle East & Africa Market Value (US$ Million) Analysis by Country, 2018 to 2033

Figure 146: Middle East & Africa Market Value Share (%) and BPS Analysis by Country, 2023 to 2033

Figure 147: Middle East & Africa Market Y-o-Y Growth (%) Projections by Country, 2023 to 2033

Figure 148: Middle East & Africa Market Value (US$ Million) Analysis by Product Type, 2018 to 2033

Figure 149: Middle East & Africa Market Value Share (%) and BPS Analysis by Product Type, 2023 to 2033

Figure 150: Middle East & Africa Market Y-o-Y Growth (%) Projections by Product Type, 2023 to 2033

Figure 151: Middle East & Africa Market Value (US$ Million) Analysis by End User, 2018 to 2033

Figure 152: Middle East & Africa Market Value Share (%) and BPS Analysis by End User, 2023 to 2033

Figure 153: Middle East & Africa Market Y-o-Y Growth (%) Projections by End User, 2023 to 2033

Figure 154: Middle East & Africa Market Value (US$ Million) Analysis by Test Type, 2018 to 2033

Figure 155: Middle East & Africa Market Value Share (%) and BPS Analysis by Test Type, 2023 to 2033

Figure 156: Middle East & Africa Market Y-o-Y Growth (%) Projections by Test Type, 2023 to 2033

Figure 157: Middle East & Africa Market Attractiveness by Product Type, 2023 to 2033

Figure 158: Middle East & Africa Market Attractiveness by End User, 2023 to 2033

Figure 159: Middle East & Africa Market Attractiveness by Test Type, 2023 to 2033

Figure 160: Middle East & Africa Market Attractiveness by Country, 2023 to 2033

Recommendations

Healthcare

Microbial Fermentation Technology Market

Published : April 2023

Healthcare

Microbial Identification Market

Published : October 2022

Explore Healthcare Insights

View Reports

Industrial Microbiology Market