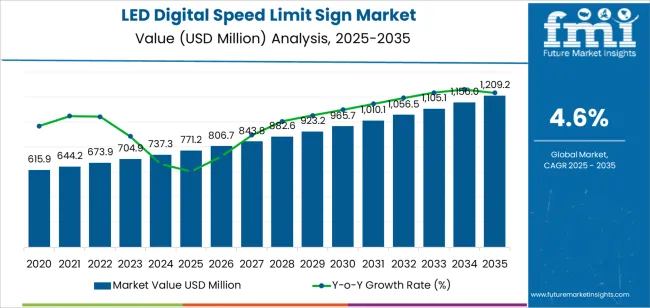
The global LED digital speed limit sign market is projected to reach USD 1,209.2 million by 2035, recording an absolute increase of USD 438.0 million over the forecast period. The LED digital speed limit sign market is valued at USD 771.2 million in 2025 and is set to rise at a CAGR of 4.6% during the assessment period. The overall market size is expected to grow by nearly 1.6 times during the same period, supported by increasing demand for traffic safety solutions worldwide, driving demand for efficient speed management systems and increasing investments in smart city infrastructure and intelligent transportation projects globally.
Between 2025 and 2030, the LED digital speed limit sign market is projected to expand from USD 771.2 million to USD 965.7 million, resulting in a value increase of USD 194.5 million, which represents 44.4% of the total forecast growth for the decade. This phase of development will be shaped by rising demand for traffic calming measures and pedestrian safety solutions, product innovation in solar-powered systems and wireless connectivity features, as well as expanding integration with intelligent transportation management platforms and real-time traffic monitoring infrastructure. Companies are establishing competitive positions through investment in advanced LED display technologies, energy-efficient power management solutions, and strategic market expansion across highway safety, urban traffic management, and work zone protection applications.
From 2030 to 2035, the LED digital speed limit sign market is forecast to grow from USD 965.7 million to USD 1,209.2 million, adding another USD 243.5 million, which constitutes 55.6% of the overall ten-year expansion. This period is expected to be characterized by the expansion of specialized digital signage systems, including variable speed limit displays and integrated radar-feedback solutions tailored for specific traffic management requirements, strategic collaborations between traffic equipment manufacturers and municipal authorities, and an enhanced focus on energy efficiency and operational sustainability. The growing emphasis on vision zero initiatives and connected vehicle infrastructure will drive demand for advanced, high-visibility LED digital speed limit sign solutions across diverse traffic management applications. However, infrastructure budget constraints and maintenance requirements may pose challenges to market expansion.
| Metric | Value |
|---|---|
| Market Value (2025) | USD 771.2 million |
| Market Forecast Value (2035) | USD 1,209.2 million |
| Forecast CAGR (2025-2035) | 4.6% |
The LED digital speed limit sign market grows by enabling traffic authorities to implement dynamic speed management strategies and enhance road safety outcomes while meeting regulatory compliance requirements for traffic control infrastructure. Transportation agencies face mounting pressure to reduce traffic accidents and improve pedestrian safety, with LED digital speed limit sign solutions typically providing 15-30% reduction in speeding violations compared to static signage, making these systems essential for effective speed enforcement and traffic calming programs. The smart city initiative's need for intelligent traffic management creates demand for advanced digital signage solutions that can display variable speed limits, integrate with traffic monitoring systems, and provide real-time driver feedback across diverse roadway conditions.
Government initiatives promoting vision zero strategies and road safety improvement programs drive adoption in highway corridors, urban arterials, and school zone applications, where speed management has a direct impact on accident severity and public safety outcomes. The global shift toward connected transportation infrastructure and data-driven traffic management accelerates LED digital speed limit sign demand as authorities seek alternatives to passive signage that cannot adapt to changing traffic conditions or provide enforcement documentation. Technology advancement trends toward solar-powered systems with integrated radar detection, wireless communication capabilities, and cloud-connected data analytics are enabling next-generation traffic management applications.
Urban congestion challenges and pedestrian safety concerns drive municipalities toward dynamic speed management solutions, with LED digital signs providing 40-60% improvement in driver attention compared to conventional static signs through high-visibility displays and radar-triggered speed feedback. Construction zone safety requirements and work zone protection regulations create sustained demand for portable LED speed limit signs that can be rapidly deployed and relocated as project requirements change. However, high initial capital costs compared to traditional signage and ongoing maintenance requirements may limit adoption rates among smaller municipalities and regions with constrained transportation infrastructure budgets.
| Growth Driver | Description | Impact on Market |
|---|---|---|
| IoT & Connectivity Integration | Incorporation of sensors, wireless modules, and cloud-based monitoring for real-time speed and performance tracking. | Enables smart traffic control, remote updates, and predictive maintenance, improving system efficiency. |
| Radar & AI-based Detection | Use of radar sensors and AI algorithms for accurate vehicle speed measurement and adaptive speed display. | Enhances accuracy, safety response, and compliance in variable traffic conditions. |
| Solar & Energy-efficient Systems | Deployment of solar-powered LED signs with low-energy consumption and auto-dimming controls. | Reduces operational costs and ensures sustainability in remote or power-limited areas. |
| Smart City Integration | Inclusion of digital signs within broader smart transportation networks and safety programs. | Expands deployment potential and supports data-driven urban traffic management. |
| Public-Private Collaborations | Partnerships between governments, transport authorities, and tech providers for co-funded infrastructure projects. | Accelerates large-scale implementation and strengthens ecosystem innovation. |
The LED digital speed limit sign market is segmented by power source, application, and region. By power source, the LED digital speed limit sign market is divided into battery power, AC power, and solar power. Based on application, the LED digital speed limit sign market is categorized into highway, city road, and others. Regionally, the LED digital speed limit sign market is divided into Asia Pacific, Europe, North America, Latin America, and Middle East & Africa.
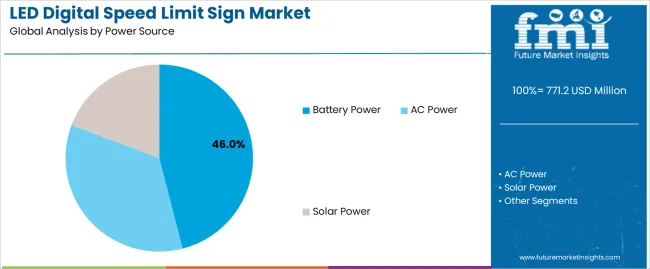
The solar power segment represents the dominant force in the LED digital speed limit sign market, capturing approximately 46% of total market share in 2025. This advanced category encompasses self-contained systems featuring photovoltaic panels, battery storage, and intelligent power management, delivering autonomous operation capabilities with minimal infrastructure requirements. The solar power segment's market leadership stems from its exceptional operational independence, elimination of grid connection costs, and suitability for remote locations where electrical infrastructure is unavailable or prohibitively expensive to install.
The AC power segment maintains a substantial 32.0% market share, serving urban environments and highway corridors where reliable grid connections enable continuous high-brightness operation and integration with centralized traffic management systems. The battery power segment accounts for 22.0% market share, featuring portable configurations ideal for temporary deployments in construction zones and special events requiring flexible positioning. Key advantages driving the solar power segment include elimination of trenching and electrical connection costs reducing installation expenses by 40-60%, operational sustainability through renewable energy utilization supporting environmental objectives, deployment flexibility enabling rapid installation in diverse locations without infrastructure constraints, and reduced ongoing operational costs through elimination of electricity consumption charges making total cost of ownership favorable over 10-15 year service life.
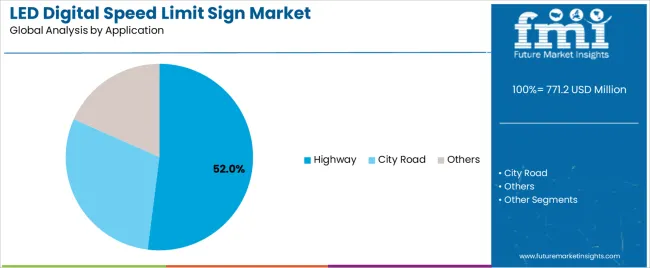
Highway applications dominate the LED digital speed limit sign market with approximately 52% market share in 2025, reflecting the critical importance of speed management on high-speed roadways where velocity differentials create significant accident risks. The highway segment's market leadership is reinforced by widespread adoption across interstate corridors, rural highways, and expressway systems, which require dynamic speed limit adjustment capabilities for adverse weather conditions, traffic congestion, and construction zone management supporting safe traffic flow.
The city road segment represents 35% market share through specialized applications including urban arterials, residential streets, and school zones where speed reduction enhances pedestrian safety and reduces accident severity in high-activity areas. Others account for 13.0% market share, encompassing work zones, parking facilities, and private roadway applications.
Key market dynamics supporting application preferences include highway emphasis on safety outcomes where speed management reduces accident frequency and severity in high-consequence environments, city road focus on pedestrian protection and traffic calming in urban environments with vulnerable road users, growing vision zero initiatives driving comprehensive speed management programs across all roadway types, and regulatory requirements mandating variable speed limits in adverse weather conditions increasing highway segment demand for adaptive signage systems.
The LED digital speed limit sign market is driven by three concrete demand factors tied to safety outcomes and regulatory compliance. First, traffic safety regulations and vision zero initiatives create increasing requirements for speed management infrastructure, with traffic fatality reduction targets of 50% or more by 2030 in major markets worldwide, requiring comprehensive deployment of speed feedback and variable limit signage supporting enforcement and behavioral modification programs. Second, smart city infrastructure investments drive demand for connected traffic management systems, with global smart city spending exceeding USD 150 billion annually in major urban regions, necessitating intelligent signage that integrates with traffic monitoring platforms and provides real-time operational data. Third, construction zone safety regulations and work zone protection standards accelerate adoption of portable speed warning systems, with temporary traffic control requirements in infrastructure projects growing 8-12% annually as aging transportation networks undergo modernization and maintenance activities.
Market restraints include high capital costs affecting deployment scale, particularly for solar-powered systems with integrated radar detection where complete installations range from USD 8,000 to USD 15,000 per sign, creating budget challenges for municipal transportation departments managing extensive roadway networks with limited funding allocations. Maintenance requirements pose operational challenges, as LED displays, solar panels, and electronic components require periodic inspection, cleaning, and component replacement to maintain visibility and functionality over 10-15 year service life, demanding ongoing resource commitments from agencies already stretched by infrastructure maintenance backlogs. Vandalism and theft concerns impact deployment decisions, especially for solar-powered systems in remote locations where photovoltaic panels and batteries represent valuable components vulnerable to damage or removal, necessitating robust mounting systems and sometimes requiring replacement installations.
Key trends indicate accelerated adoption in Asia-Pacific markets, particularly China and India, where rapid urbanization and expanding highway networks drive demand for modern traffic management infrastructure supporting increasing vehicle populations. Technology advancement trends toward integrated systems combining speed limit display with radar speed detection, license plate recognition, and automated enforcement documentation are transforming traditional passive signage into comprehensive speed management platforms. Cloud connectivity enables remote sign management, performance monitoring, and data analytics supporting evidence-based traffic management decisions and optimized sign placement strategies. However, the LED digital speed limit sign market thesis could face disruption if connected vehicle technologies achieve widespread adoption, potentially enabling direct vehicle speed limit communication through in-vehicle displays and automated speed control systems, reducing requirements for external signage infrastructure while maintaining compliance outcomes.
| Country | CAGR (2025-2035) |
|---|---|
| China | 6.2% |
| India | 5.8% |
| Germany | 5.3% |
| Brazil | 4.8% |
| USA | 4.4% |
| UK | 3.9% |
| Japan | 3.5% |
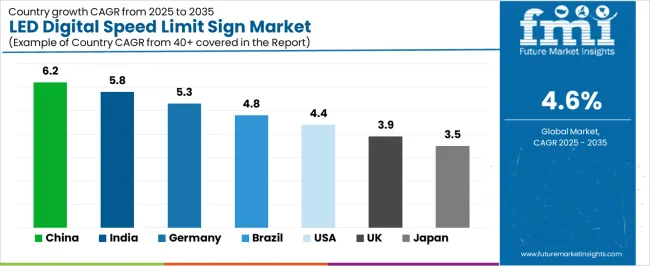
The LED digital speed limit sign market is gaining momentum worldwide, with China taking the lead thanks to aggressive highway expansion programs and smart city traffic management initiatives. Close behind, India benefits from urban road safety campaigns and National Highway Authority modernization programs, positioning itself as a strategic growth hub in the Asia-Pacific region. Germany shows strong advancement, where autobahn variable speed limit implementation and urban traffic calming measures strengthen its role in European intelligent transportation systems.
Brazil demonstrates robust growth through highway concession requirements and urban mobility improvement programs, signaling continued investment in traffic safety infrastructure. The USA maintains solid expansion through Vision Zero initiatives and state DOT safety improvement programs, while the UK records consistent progress driven by smart motorway expansion and 20mph zone implementations. Meanwhile, Japan stands out for its precision traffic management and comprehensive road safety culture. Together, China and India anchor the global expansion story, while established markets build stability and diversity into the LED digital speed limit sign market's growth path.
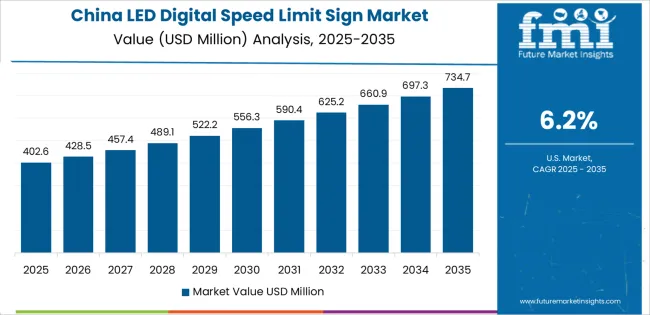
China demonstrates the strongest growth potential in the LED Digital Speed Limit Sign Market with a CAGR of 6.2% through 2035. The country's leadership position stems from comprehensive highway network expansion programs, intensive urban traffic management system deployments, and aggressive smart city development targets driving adoption of intelligent transportation infrastructure.
Growth is concentrated in major urban regions and highway corridors, including Beijing-Tianjin-Hebei, Yangtze River Delta, Pearl River Delta, and Chengdu-Chongqing, where traffic authorities are implementing digital speed limit signage for congestion management, safety enhancement, and regulatory compliance. Distribution channels through transportation equipment suppliers, municipal procurement agencies, and highway management authorities expand deployment across expressway networks and urban arterial systems. The country's Smart City Initiative provides policy support for intelligent transportation development, including subsidies for traffic safety equipment adoption and integrated management platform deployment.
Key market factors include transportation infrastructure intensity with comprehensive highway network expansion and urban road development programs spanning nationwide modernization initiatives, government support through Safe City programs and traffic safety improvement campaigns providing 30-50% funding support for digital signage systems, comprehensive ecosystem including established traffic equipment manufacturers and system integrators with proven deployment capabilities, and technology integration featuring radar speed detection, wireless communication systems, and cloud-connected management platforms deployed across major metropolitan areas and highway corridors supporting centralized traffic management.
In Delhi NCR, Mumbai Metropolitan Region, Bangalore, and Hyderabad, the adoption of LED digital speed limit sign systems is accelerating across national highways, state highways, and urban road networks, driven by road safety improvement initiatives and government infrastructure modernization programs. The LED digital speed limit sign market demonstrates strong growth momentum with a CAGR of 5.8% through 2035, linked to comprehensive highway development expansion and increasing focus on traffic accident reduction solutions. Indian traffic authorities are implementing digital signage systems and speed feedback platforms to reduce accident rates while supporting National Road Safety Policy targets for fatality reduction. The country's Bharatmala highway development program creates sustained demand for modern traffic control infrastructure, while increasing emphasis on pedestrian safety drives adoption of speed management systems in urban areas with high vulnerable road user populations.
Leading infrastructure development regions, including National Capital Region, Maharashtra, Karnataka, and Tamil Nadu, driving LED digital speed limit sign adoption with government funding programs enabling 40-60% cost support for road safety equipment and traffic management system deployment. Technology partnerships with international traffic equipment manufacturers accelerate deployment with knowledge transfer and technical support for sign installation and system integration. Policy support through Ministry of Road Transport and Highways initiatives and state-level road safety action plans linked to accident reduction targets create favorable conditions for digital signage adoption across highway and urban road applications.
Germany's advanced traffic management infrastructure demonstrates sophisticated implementation of LED digital speed limit sign systems, with documented case studies showing 20-35% accident reduction on autobahn sections equipped with variable speed limit displays responding to traffic density and weather conditions.
The country's transportation infrastructure in major regions, including North Rhine-Westphalia, Bavaria, Baden-Württemberg, and Lower Saxony, showcases integration of digital signage technologies with existing traffic management systems, leveraging expertise in automotive engineering and intelligent transportation solutions. German traffic authorities emphasize data-driven speed management and environmental compliance, creating demand for reliable digital signage that supports dynamic traffic control strategies and emissions reduction objectives. The LED digital speed limit sign market maintains strong growth through focus on autobahn modernization and urban traffic calming programs, with a CAGR of 5.3% through 2035.
Key development areas include autobahn variable speed limit systems enabling weather-responsive and congestion-adaptive traffic management with comprehensive coverage across federal highway network, technical excellence in system integration providing reliable operation through harsh weather conditions and high-traffic environments, strategic partnerships between traffic equipment manufacturers and state transportation authorities expanding digital signage deployment across regional road networks, and integration of environmental monitoring and comprehensive traffic data collection supporting evidence-based transportation planning and air quality management initiatives.
Brazil's developing highway infrastructure demonstrates increasing implementation of LED digital speed limit sign systems, with highway concession requirements and urban safety programs driving demand for modern traffic control equipment. The LED digital speed limit sign market shows solid potential with a CAGR of 4.8% through 2035, driven by federal highway modernization and increasing municipal traffic management capabilities across major urban regions, including São Paulo, Rio de Janeiro, Minas Gerais, and Rio Grande do Sul.
Brazilian traffic authorities are adopting digital speed limit signs for compliance with concession agreement safety standards, particularly on toll highways requiring comprehensive traffic management infrastructure and in urban areas implementing speed reduction programs for pedestrian protection. Technology deployment channels through traffic equipment distributors, highway concession operators, and municipal transportation departments expand coverage across diverse roadway applications.
Leading market segments include federal highway concessions requiring comprehensive safety infrastructure meeting contractual obligations, urban arterial systems implementing traffic calming measures for accident reduction, and school zone applications protecting vulnerable road users during peak activity periods. Technology partnerships with international equipment manufacturers provide access to proven signage systems and technical support for installation and maintenance programs, while strategic collaborations between federal, state, and municipal authorities coordinate funding for road safety infrastructure supporting Vision Zero goals.
The USA market demonstrates comprehensive implementation of LED digital speed limit sign systems based on state DOT safety improvement programs and municipal traffic calming initiatives for enhanced community protection. The country shows solid potential with a CAGR of 4.4% through 2035, driven by Vision Zero city commitments, Highway Safety Improvement Program funding, and growing emphasis on vulnerable road user protection across major metropolitan areas, including New York, Los Angeles, Chicago, and Houston. American traffic authorities are adopting digital speed limit signs for compliance with Manual on Uniform Traffic Control Devices provisions, particularly in work zones requiring enhanced warning systems and in residential areas implementing neighborhood traffic management programs. Technology deployment channels through state transportation departments, county road authorities, and municipal public works agencies expand coverage across diverse roadway classifications.
Leading market segments include work zone applications requiring portable speed feedback systems for construction site protection, school zones implementing enhanced pedestrian safety measures during student arrival and dismissal periods, and residential streets deploying traffic calming infrastructure supporting livable community objectives. Technology partnerships with domestic traffic equipment manufacturers ensure MUTCD compliance and rapid support response, while strategic collaborations between state DOTs and local agencies coordinate funding through safety improvement grants and local match programs supporting comprehensive deployment.
The United Kingdom's LED digital speed limit sign market demonstrates focused implementation across smart motorway corridors and urban 20mph zone expansion programs, with documented integration supporting variable speed limits achieving 22% accident reduction on managed motorway sections. The country maintains steady growth momentum with a CAGR of 3.9% through 2035, driven by Highways England smart motorway program continuation and local authority traffic calming initiatives emphasizing vulnerable road user protection. Major metropolitan regions, including London, Birmingham, Manchester, and Leeds, showcase deployment of digital speed limit signage that integrates with existing traffic management infrastructure and supports congestion reduction strategies through dynamic speed management.
Key market characteristics include smart motorway infrastructure enabling responsive speed limit adjustment based on traffic flow and incident management requirements, urban traffic calming emphasis through 20mph zone expansion protecting pedestrians and cyclists in residential areas, technology partnerships between Highways England and equipment suppliers ensuring system reliability and integration with national traffic control center, and collaboration between local authorities implementing consistent speed management approaches across road networks supporting Vision Zero objectives.
Japan's LED digital speed limit sign market demonstrates mature implementation focused on highway safety systems and urban speed management, with documented integration achieving superior visibility and driver compliance through high-quality display technology and strategic placement methodologies. The country maintains steady growth through commitment to traffic safety excellence and technological precision, with a CAGR of 3.5% through 2035, driven by comprehensive road safety culture and continuous improvement approach to traffic management infrastructure. Major urban regions, including Tokyo, Osaka, Nagoya, and Fukuoka, showcase advanced deployment of LED signage systems that integrate seamlessly with existing traffic signal networks and emergency management protocols.
Key market characteristics include expressway management systems incorporating weather-responsive speed limits and incident-adaptive traffic control supporting high-traffic-volume corridors, precision manufacturing emphasis ensuring display visibility and system reliability through harsh environmental conditions, technology partnerships between traffic authorities and domestic equipment manufacturers providing integrated solutions with comprehensive maintenance support, and emphasis on pedestrian protection in urban environments through school zone speed management and residential area traffic calming aligned with community safety priorities.
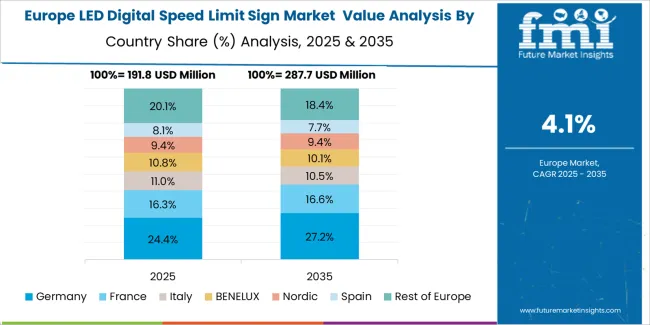
The LED digital speed limit sign market in Europe is projected to grow from USD 223.3 million in 2025 to USD 343.8 million by 2035, registering a CAGR of 4.4% over the forecast period. Germany is expected to maintain its leadership position with a 26.5% market share in 2025, declining slightly to 25.8% by 2035, supported by its extensive autobahn infrastructure and major transportation corridors, including A1, A3, and A5 highway systems.
France follows with a 19.2% share in 2025, projected to reach 19.5% by 2035, driven by comprehensive smart motorway programs and urban speed limit reductions. The United Kingdom holds a 17.8% share in 2025, expected to reach 17.5% by 2035, backed by smart motorway continuation and 20mph zone expansion programs. Italy commands a 12.3% share in both 2025 and 2035, driven by highway concession modernization requirements.
Spain accounts for 9.5% in 2025, rising to 9.7% by 2035 on urban traffic calming expansion and highway safety improvements. The Netherlands maintains 5.4% in 2025, reaching 5.6% by 2035 on intelligent transportation system integration. The Rest of Europe region is anticipated to hold 9.5% in 2025, expanding to 14.4% by 2035, attributed to increasing LED digital speed limit sign adoption in Nordic countries and emerging Central & Eastern European highway modernization programs.
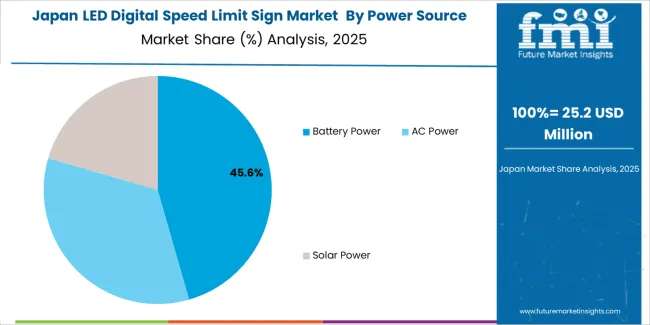
The Japanese LED digital speed limit sign market demonstrates a mature and quality-focused landscape, characterized by sophisticated integration of solar-powered and AC-powered systems with existing traffic management infrastructure across expressway networks, urban arterials, and residential street applications. Japan's emphasis on reliability and operational excellence drives demand for high-quality digital signage that supports comprehensive traffic safety commitments and maintains visibility through diverse weather conditions including heavy rain and snow.
The LED digital speed limit sign market benefits from strong partnerships between traffic authorities and domestic equipment manufacturers, including major electronics companies, creating comprehensive service ecosystems that prioritize product durability and technical support programs. Transportation networks in the Tokyo Metropolitan Area, the Kansai region, the Chubu region, and other major corridors showcase advanced traffic management implementations where digital signage achieves superior driver compliance through strategic placement and high-visibility display technology.
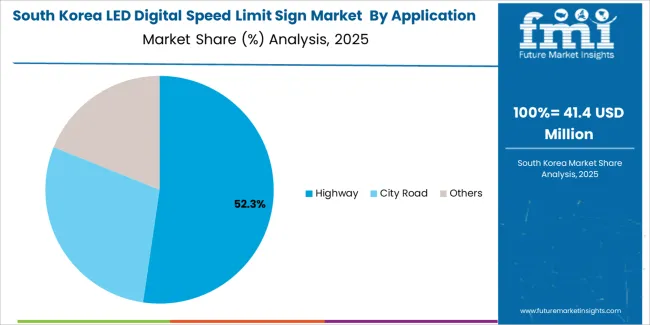
The South Korean LED digital speed limit sign market is characterized by growing emphasis on intelligent transportation infrastructure, with government agencies maintaining significant deployment programs through comprehensive highway modernization and urban traffic management initiatives supporting connected vehicle ecosystem development. The LED digital speed limit sign market demonstrates increasing focus on integrated traffic management platforms and real-time speed adjustment capabilities, as Korean transportation authorities increasingly demand digital signage systems that integrate with domestic traffic control centers and sophisticated monitoring infrastructure deployed across major expressway corridors and metropolitan areas.
Domestic traffic equipment manufacturers are expanding market participation through technology partnerships with international suppliers, offering specialized systems including Korean language displays and integration with national traffic management platforms supporting expressway operation. The competitive landscape shows increasing collaboration between government transportation agencies and equipment manufacturers, creating standardized deployment models that combine proven signage technology with local operational requirements and rapid maintenance response capabilities.
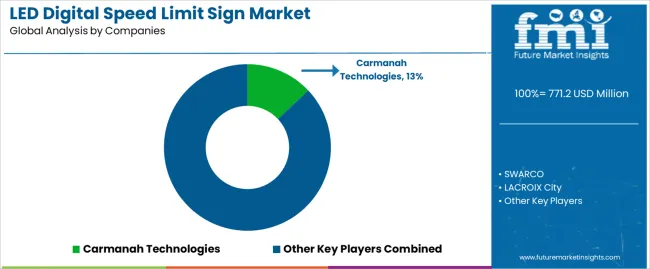
The LED digital speed limit sign market features approximately 30-35 meaningful players with moderate fragmentation, where the top three companies control roughly 25-30% of global market share through established distribution networks and comprehensive product portfolios. Competition centers on display visibility quality, power management efficiency, and system reliability rather than price competition alone. Carmanah Technologies leads with approximately 10.0% market share through its comprehensive solar-powered traffic signage portfolio spanning speed feedback, variable message, and regulatory sign applications.
Market leaders include Carmanah Technologies, SWARCO, and LACROIX City, which maintain competitive advantages through vertical integration in LED display manufacturing, solar power system optimization, and deep expertise in traffic management requirements across multiple jurisdictions, creating reliability and performance advantages with transportation authorities. These companies leverage research and development capabilities in display technology advancement, power consumption reduction, and ongoing technical support relationships to defend market positions while expanding into smart city integration and connected infrastructure applications.
Challengers encompass IRD, MPD Inc., and Wanco, which compete through specialized sign configurations and strong regional presence in key transportation markets supporting highway authorities and municipal agencies. Product specialists, including TAPCO, Ver-Mac, and Solar Technology, focus on specific applications or power sources, offering differentiated capabilities in radar integration technologies, portable deployment systems, and energy harvesting optimization. Traffic Logix, TraffiCalm, and Radarsign maintain positions through traffic calming focus and neighborhood speed management solutions appealing to residential community applications.
Regional players and emerging traffic equipment providers create competitive pressure through localized manufacturing advantages and rapid response capabilities, particularly in high-growth markets including China and India, where domestic manufacturers provide cost-competitive solutions optimized for local roadway conditions and regulatory requirements. Market dynamics favor companies that combine proven display technology with comprehensive mounting systems, reliable solar power management, and responsive technical support that addresses the complete installation cycle from site assessment through long-term maintenance and component replacement programs.
LED digital speed limit signs represent intelligent traffic control infrastructure that enables authorities to achieve 15-30% reduction in speeding violations compared to static signage, delivering enhanced road safety and dynamic speed management with high-visibility displays and real-time feedback capabilities in demanding traffic management applications. With the LED digital speed limit sign market projected to grow from USD 771.2 million in 2025 to USD 1,209.2 million by 2035 at a 4.6% CAGR, these traffic control systems offer compelling advantages - accident reduction, regulatory compliance, and operational flexibility - making them essential for highway safety management, urban traffic calming, and transportation agencies seeking effective speed management solutions that adapt to changing traffic conditions and environmental factors. Scaling market adoption and infrastructure deployment requires coordinated action across transportation policy, traffic safety standards, equipment manufacturers, government agencies, and infrastructure investment capital.
Transportation Safety Programs should include digital speed limit signs in highway safety improvement funding allocations, provide grants for municipal traffic calming equipment supporting vision zero initiatives, and establish regional equipment sharing programs reducing individual agency capital requirements for specialized applications. Research & Innovation Funding must support research on driver behavior response to variable speed limits, visibility optimization studies for diverse weather conditions, and integration methodologies with connected vehicle infrastructure while investing in pilot projects that demonstrate effectiveness of dynamic speed management in high-crash corridors. Infrastructure Development Incentives should provide matching funds for small communities implementing comprehensive speed management programs, offer technical assistance for sign placement optimization and system specification, and support deployment of solar-powered systems in remote locations where grid connection costs prohibit traditional signage installation.
Standardization & Procurement should develop national equipment specifications ensuring minimum performance standards for display visibility and power system reliability, create centralized purchasing contracts enabling volume discounts for small agencies, and establish testing protocols that validate equipment durability through environmental stress and operational longevity requirements. Education & Public Awareness needs to implement driver education campaigns explaining variable speed limit purposes and compliance requirements, support community engagement programs building public acceptance for traffic calming measures, and develop enforcement protocols that leverage digital signage data supporting speed violation documentation and behavioral modification programs.
Technical Standards & Guidelines should define standardized specifications for display brightness, character height, and viewing angles ensuring consistent driver comprehension across jurisdictions, establish power consumption benchmarks for solar system sizing supporting reliable operation through diverse climate conditions, and create mounting standards that ensure structural integrity and wind resistance protecting equipment investments. Best Practices Documentation must develop comprehensive guides for sign placement optimization, spacing requirements, and integration with existing signage supporting effective speed management programs, while establishing maintenance protocols that ensure long-term visibility and functionality through regular inspection and component replacement schedules.
Installation & Maintenance Standards need to create workforce certification programs for technicians performing electrical installation and solar system commissioning, develop troubleshooting guides addressing common failure modes and repair procedures, and establish quality assurance protocols that validate proper installation and system configuration before operational acceptance. Performance Evaluation Frameworks should establish effectiveness measurement methodologies assessing speed reduction outcomes and safety benefits, develop data collection standards enabling cross-jurisdictional performance comparison, and create reporting templates that document operational reliability and maintenance requirements supporting lifecycle cost analysis.
Advanced Display Technology should develop higher-brightness LED arrays maintaining visibility through direct sunlight and adverse weather conditions, create adaptive brightness systems automatically adjusting output based on ambient light while minimizing power consumption, and implement anti-glare coatings and specialized optics enhancing character definition at extended viewing distances supporting driver comprehension. Power Management Innovation must provide optimized solar panel configurations maximizing energy capture in diverse geographic locations, develop intelligent battery management systems extending service life through controlled charge-discharge cycles, and create hybrid power systems combining solar collection with grid backup ensuring continuous operation through extended overcast periods.
Integration Capabilities need to develop wireless communication modules enabling remote monitoring and control through cellular or mesh networks, implement data logging systems documenting traffic speeds and volume supporting transportation planning activities, and create open protocols facilitating integration with traffic management platforms and connected vehicle infrastructure enabling coordinated speed management strategies. Service & Support Programs should build comprehensive training programs for transportation agency personnel on installation procedures and basic troubleshooting, offer extended warranty options and rapid replacement programs minimizing sign downtime, and provide performance monitoring services alerting agencies to maintenance requirements before functionality degradation impacts operational effectiveness.
Application-Focused Product Lines should develop specialized configurations for highway applications emphasizing high-brightness displays and long-range visibility, create traffic calming systems optimized for residential areas with radar feedback and data logging capabilities, and offer portable solutions for work zones featuring rapid deployment and self-contained power systems with formulations optimized for each application's specific operational requirements. Geographic Market Strategy must establish distribution partnerships in high-growth markets like China and India ensuring product availability and local technical support, while maintaining comprehensive inventory and service infrastructure in established markets like USA and Europe through regional warehouses and trained service technicians.
Technology Differentiation should invest in proprietary power management algorithms maximizing solar system efficiency and battery longevity, develop modular designs enabling field component replacement without complete sign removal, and create user-friendly configuration interfaces allowing transportation agencies to program speed schedules and operational modes without specialized technical expertise. Agency Partnership Models need to develop long-term relationships with state DOTs, county road departments, and municipal public works agencies through equipment demonstration programs, performance guarantees demonstrating speed reduction outcomes, and comprehensive maintenance contracts that ensure long-term operational reliability while building customer loyalty and providing market intelligence guiding product development.
Traffic Equipment Manufacturing should finance established LED digital speed limit sign manufacturers for production capacity expansion, technology development programs, and distribution network enhancement serving growing demand in highway and city road markets enabling comprehensive geographic coverage. Installation & Service Infrastructure must provide capital for establishing regional service centers, technician training facilities, and spare parts inventory ensuring rapid response to maintenance requirements and supporting customer satisfaction across diverse transportation agency portfolios.
Innovation & Smart Infrastructure should back technology startups developing next-generation traffic management systems including AI-enhanced speed optimization algorithms, vehicle-to-infrastructure communication platforms, and integrated enforcement documentation capabilities that enhance speed management effectiveness while addressing operational efficiency requirements. Market Integration & Consolidation needs to support strategic partnerships between sign manufacturers and solar technology companies creating optimized power solutions, finance acquisitions that expand product portfolios across complementary traffic control equipment, and enable vertical integration combining component manufacturing with complete system assembly supporting end-to-end quality control and competitive pricing structures.
| Item | Value |
|---|---|
| Quantitative Units | USD 771.2 million |
| Power Source | Battery Power, AC Power, Solar Power |
| Application | Highway, City Road, Others |
| Regions Covered | Asia Pacific, Europe, North America, Latin America, Middle East & Africa |
| Country Covered | China, India, Germany, Brazil, USA, UK, Japan, and 40+ countries |
| Key Companies Profiled | Carmanah Technologies, SWARCO, LACROIX City, IRD, MPD Inc., Wanco, TAPCO, Ver-Mac, Solar Technology, Traffic Logix, TraffiCalm, Radarsign, Elan City |
| Additional Attributes | Dollar sales by power source and application categories, regional adoption trends across Asia Pacific, Europe, and North America, competitive landscape with traffic equipment manufacturers and system integrators, installation requirements and mounting specifications, integration with traffic management systems and intelligent transportation infrastructure, innovations in solar power management and LED display technology, and development of specialized signage solutions with enhanced visibility and connectivity capabilities. |
The global LED digital speed limit sign market is estimated to be valued at USD 771.2 million in 2025.
The market size for the LED digital speed limit sign market is projected to reach USD 1,209.2 million by 2035.
The LED digital speed limit sign market is expected to grow at a 4.6% CAGR between 2025 and 2035.
The key product types in LED digital speed limit sign market are battery power, ac power and solar power.
In terms of application, highway segment to command 52.0% share in the LED digital speed limit sign market in 2025.


Full Research Suite comprises of:
Market outlook & trends analysis
Interviews & case studies
Strategic recommendations
Vendor profiles & capabilities analysis
5-year forecasts
8 regions and 60+ country-level data splits
Market segment data splits
12 months of continuous data updates
DELIVERED AS:
PDF EXCEL ONLINE
LED and OLED lighting Products and Display Market Size and Share Forecast Outlook 2025 to 2035
LED Light Market Size and Share Forecast Outlook 2025 to 2035
LED Loading Dock Light Market Size and Share Forecast Outlook 2025 to 2035
LED Modules and Light Engines Market Size and Share Forecast Outlook 2025 to 2035
LED Control Unit Market Size and Share Forecast Outlook 2025 to 2035
LED Lamp Market Size and Share Forecast Outlook 2025 to 2035
LED Light Tower Market Size and Share Forecast Outlook 2025 to 2035
LED Displays, Lighting and Fixtures Market Size and Share Forecast Outlook 2025 to 2035
LED Tube Market Size and Share Forecast Outlook 2025 to 2035
LED Backlight Driver Market Size and Share Forecast Outlook 2025 to 2035
LEDPackaging Market Size and Share Forecast Outlook 2025 to 2035
LED Neon Lights Market Size and Share Forecast Outlook 2025 to 2035
LED Driver IC Market Analysis - Size, Share, and Forecast Outlook 2025 to 2035
LED Grow Lights Market Analysis by Product, Installation Type, Application and Region Through 2035
LED Backlight Display Driver ICs Market – Growth & Forecast 2025 to 2035
LED Driver for Lighting Market Analysis – Growth & Forecast 2025 to 2035
LED Light Bar Market Analysis - Trends, Growth & Forecast 2025 to 2035
LED Phosphor Material Market
LED Driver Market
LED Modular Display Market

Thank you!
You will receive an email from our Business Development Manager. Please be sure to check your SPAM/JUNK folder too.
Chat With
MaRIA