Global Melamine Beauty Product Market Size and Share Forecast Outlook 2025 to 2035

The Melamine Beauty Product Market is forecast to reach a valuation of USD 218.7 million in 2025 and USD 684.5 million in 2035, marking an increase of approximately USD 465.8 million, or a 3.1X growth across the decade. This expansion reflects a CAGR of 12.1%, driven by innovation in skin microbiome repair and functional beauty formulations.
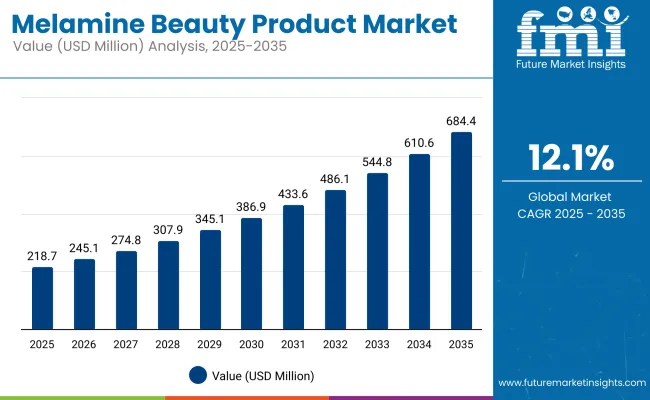
Quick Stats - Global Melamine Beauty Product Market

  • Global Melamine Beauty Product Market Value (2025): USD 218.7 million
  • Global Melamine Beauty Product Market Forecast Value (2035): USD 684.5 million
  • Global Melamine Beauty Product Market CAGR (2025 to 2035): 12.1%
  • Leading Product Segment in Global Melamine Beauty Product Market (2025): Facial Skincare (43.6%)
  • Top Ingredient Segment in Global Melamine Beauty Product Market (2025): Melamine-Formaldehyde Resins (48.7%)
  • Leading End-User Segment in Global Melamine Beauty Product Market (2025): Professional Users (59.2%)
  • Key Growth Regions in Global Melamine Beauty Product Market: Asia-Pacific, North America, Europe
  • Top Companies in Global Melamine Beauty Product Market: L'Oréal Group, Estée Lauder Companies, Shiseido Company, Coty Inc., Revlon Inc., LVMH Moët Hennessy Louis Vuitton SE, Chanel S.A., Unilever PLC, Procter & Gamble Co., Johnson & Johnson, Amorepacific Corporation, Beiersdorf AG, Avon Products, Kao Corporation, Elizabeth Arden

Melamine Beauty Product Market

Global Melamine Beauty Product Market Key Takeaways

Metric Value
Market Estimated Value in (2025E) USD 218.7 million
Market Forecast Value in (2035F) USD 684.5 million
Forecast CAGR (2025 to 2035) 12.1%

During the first half of the forecast period (2025-2030), the market grows from USD 218.7 million to USD 386.9 million, contributing USD 168.2 million, which represents 36.1% of the total decade growth. This growth phase is led by rising demand for facial skincare and body lotions, with multifunctional attributes like hydration and anti-inflammatory properties gaining prominence. Facial skincare continues to dominate this phase with a projected 43.6% segmental share.

From 2030 to 2035, the market expands further from USD 386.9 million to USD 684.5 million, generating USD 297.6 million, which accounts for 63.9% of total growth. The latter half benefits from the adoption of melamine-derived compounds in more sophisticated formulations, including bio-fermented actives and marine extracts. Together, color cosmetics and body lotions are expected to capture a larger cumulative share, crossing the 55% mark by 2035, as demand for soft-finish, sensorial products accelerates.

From 2020 to 2024, the Melamine Beauty Product Market gained momentum, growing steadily on the back of rising demand for multifunctional and sensorial beauty solutions. During this period, leading beauty brands such as L’Oréal and Estée Lauder captured a dominant share of the market revenue.

Their focus on innovative formulations with melamine derivatives created products that combined efficacy with enhanced consumer experience. Consumer preference has shifted toward performance-led texturesvelvety, soft-focus, second-skin finishesdelivered through melamine-integrated product chemistry.

This evolution is challenging traditional beauty formats and paving the way for sensorial cosmetics. The market now witnesses rising competition from digital-first beauty players offering personalized and sustainable solutions. To remain competitive, top-tier brands are increasingly moving toward hybrid innovation models, merging sustainability, biotechnology, and digital engagement.

Why the Global Melamine Beauty Product Market is growing?

Formulation technology developments have enhanced the performance and sensory characteristics of melamine-based beauty products to enable more effective and efficient solutions in varied applications. Increased interest in multifunctionality has promoted consumer satisfaction and loyalty. Skincare and color cosmetics, among other industries, are creating demand for melamine solutions that fit easily into existing beauty regimens.

Growth in clean-label and dermatologist-recommended products has driven market expansion. Advances in product formula and packaging improvements are anticipated to create new areas of application. Segment growth is anticipated to be spearheaded by skincare products, especially those with melamine for enhanced benefits.

Segmental Analysis

The Global Melamine Beauty Product Market is segmented by product type, functional claims, ingredient type, end-user, sales channel, and region. Product types include facial skincare (moisturizers, serums & essences, face masks, toners), color cosmetics (lipsticks & lip tints, foundations & BB/CC creams, eye makeup, blushers & highlighters), body lotions & creams, and fragranceseach representing core categories driving consumer adoption.

Functional claims cover key performance attributes such as film forming & long-lasting wear, gloss & shine enhancement, texture improvement, durability & water resistance, and matte/oil control effects, which shape product innovation and brand positioning. Ingredient types include melamine formaldehyde resins, melamine copolymers (e.g., melamine-tosylamide resins), and crosslinked melamine-based polymers that serve as film formers and texture enhancers in advanced cosmetic formulations.

End-user segments comprise professional users, general consumers, and sensitive skin consumers, reflecting varied application needs and skin tolerability preferences. Sales channels are bifurcated into online channels (e-commerce websites, brand websites) and offline channels (department stores, drugstores/pharmacies, beauty specialty stores, hypermarkets, and pop-up stores), highlighting the omnichannel nature of modern beauty retail. Regionally, the market scope spans North America, Latin America, Europe, East Asia, South Asia, Oceania, and the Middle East & Africa, with varying adoption patterns, regulatory environments, and innovation intensity across geographies.
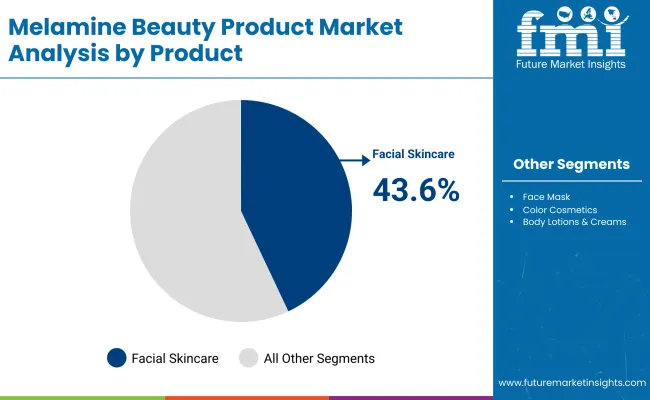
Insights into the Product Segment with Facial Skincare Leading in Market Share

Melamine Beauty Product Market By Product

Product Segment Market Value Share, 2025
Facial Skincare 43.6%
Others 56.4%

The facial skincare segment is projected to contribute 43.6% of the Melamine Beauty Product Market revenue in 2025, establishing itself as the leading product category. This dominance is fueled by persistent demand for multifunctional skincare solutions, including deep hydration, oil regulation, and improved wear performance. The segment’s momentum is further sustained by continuous innovation in formulations that enhance skin texture, appearance, and user satisfaction, particularly among consumers seeking high-performance yet sensorial beauty products.
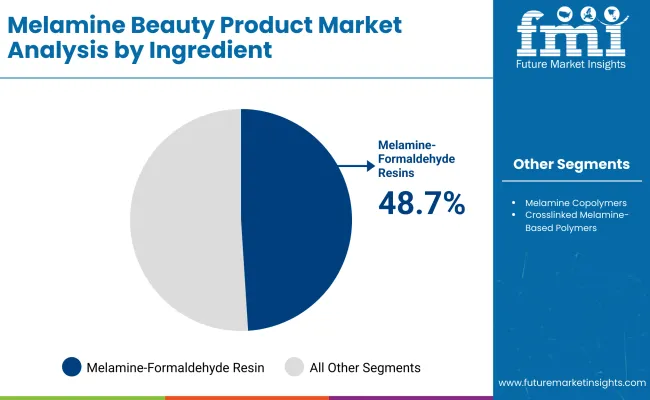
Insights into the Ingredient Segment with Melamine-Formaldehyde Resins Leading Demand

Melamine Beauty Product Market By Ingrediant

Ingredient Segment Market Value Share, 2025
Melamine-Formaldehyde Resins 48.7%
Others 51.3%

Melamine-formaldehyde resins are expected to account for 48.7% of the market share in 2025, generating approximately USD 106.51 million in sales. These resins are widely used for their film-forming and durability-enhancing properties, especially in beauty products designed for long wear, resistance to humidity, and uniform finish.

Their unique ability to deliver lightweight yet high-performance textures positions them as an essential active in hybrid skincare-makeup formulations. As consumers increasingly seek out resilient, sweat-proof, and mattifying products, demand for melamine-formaldehyde-based compounds is anticipated to remain strong.

Insights into the End-Use Segment with Professional Users Driving Demand

End Use Segment Market Value Share, 2025
professional users 59.2%
Others 40.8%

The professional users segment is projected to dominate the melamine beauty product market in 2025, accounting for 59.2% of the market share and generating approximately USD 129.47 million in revenue. This leadership is attributed to growing demand from dermatologists, aestheticians, spa therapists, and salon professionals for high-performance skincare and cosmetic products. These users often rely on melamine-based solutions for their durability, skin-safe formulation integrity, and long-wear finish, especially for clinical applications, event prep, and post-treatment care.

Their preference for performance-driven products that offer film-forming properties, hydration, and second-skin texture ensures consistent demand for melamine-infused formulations. Additionally, professionals often set product benchmarks that influence retail adoption by general consumers, further amplifying their role in shaping product development and brand reputation. The other consumer segment, although smaller at 40.8%, still represents a significant portion of the market, particularly through e-commerce, drugstores, and beauty retail chains, where users seek salon-like results at home.

What are the Drivers, Restraints, and Key Trends of the Melamine Beauty Product Market?

Drivers

Superior Film-Forming Capabilities for Long-Wear and Transfer-Resistance

Melamine-based polymers, particularly crosslinked melamine-formaldehyde resins, are increasingly preferred for their film-forming efficiency, which enables transfer-resistance, humidity tolerance, and extended wearespecially in facial products like foundations, BB creams, and lip tints.

These properties are highly valued in warm and humid climates (e.g., Southeast Asia, Latin America), driving adoption among brands targeting performance-driven and active-wear beauty consumers. This chemical advantage differentiates melamine-integrated products from those using more traditional acrylate or silicone-based film formers.

Growing Demand for Texture-Enhancing Hybrid Polymers in Color Cosmetics

Melamine copolymers, such as melamine-tosylamide resins, are being leveraged in hybrid polymer blends to create silk-matte, soft-touch finishes without sacrificing pigment dispersion or application feel. In premium and indie color cosmetic lines, these resins offer high compatibility with anhydrous and low-oil content bases, enabling minimalist but sensorial product formats. As brands compete on sensorial finish and lightweight textures, especially in eye and lip makeup, melamine derivatives are gaining traction as a texture innovation enabler.

Restraints

Regulatory Scrutiny and Residual Formaldehyde Concerns

Despite being widely used in durable coatings and industrial resins, melamine-formaldehyde systems face scrutiny in cosmetic applications due to concerns about formaldehyde release, even in trace amounts. Regulatory bodies in the EU, California (Prop 65), and South Korea are intensifying safety assessments of chemical additives in personal care products. This has forced several beauty brands to delay launches or reformulate productsespecially where "clean beauty" or allergen-free labels are prioritized.

Formulation Complexity and Stability Challenges with Natural Actives

Melamine-based polymers are often incompatible with naturally derived emulsifiers, enzymes, and probiotic extracts. Brands seeking to integrate both bio-active ingredients and performance polymers in one formulation face complex formulation hurdles, including pH instability, separation, and texture breakdown. This limits the penetration of melamine polymers into fast-growing categories like bio-fermented skincare, reef-safe sunscreens, or edible-grade lip care, where consumers demand both natural ingredients and advanced performance.

Key Trends

Rise of Heat-Activated and Sensorial Melamine Polymers for Smart Makeup

A new wave of heat-activated melamine crosspolymers is emerging, especially in self-setting foundations, skin-adaptive blushers, and thermo-responsive lip stains. These polymers harden slightly upon contact with body heat, creating a natural-looking finish with strong adhesion and minimal pilling. Brands are marketing these attributes as "second-skin technology" or "touch-sensor wear," aligning with growing demand for smart makeup that adapts to movement, skin temperature, and sebum levels.

Strategic Integration into Sustainable and Long-Wear Hybrid Form

While melamine resins are synthetic, there is a trend to combine them with biodegradable bases or packaging innovations to maintain sustainability credentials. For example, color sticks and refillable pressed powders now integrate melamine-tosylamide film formers in water-free formats to offer both long-wear and reduced packaging waste. This "performance + planet-safe" hybrid approach is being adopted by mid-tier and luxury brands seeking to meet ESG benchmarks without compromising on wear time or texture.
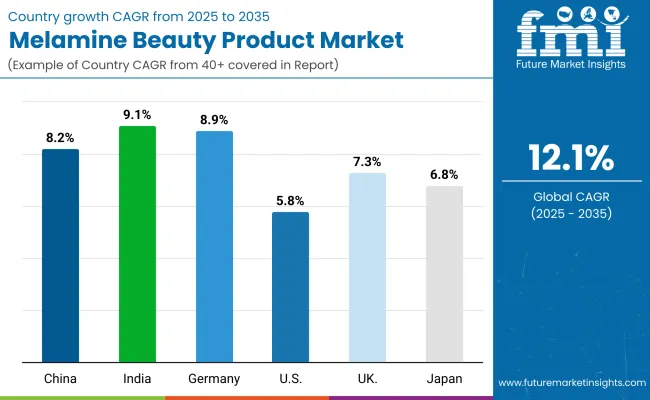
Analysis of Global Melamine Beauty Product Market by Key Countries

Melamine Beauty Product Market By Country

Countries CAGR (2025 to 2035)
China 8.2%
India 9.1%
Germany 8.9%
USA 5.8%
UK 7.3%
Japan 6.8%

The global Melamine Beauty Product Market shows a pronounced regional disparity in adoption speed, strongly influenced by consumer trends and regulatory environments. Asia-Pacific emerges as the fastest-growing region, anchored by China at 8.2% CAGR and India at 9.1%. This acceleration is driven by rising disposable incomes, urbanization, and the mass adoption of digital beauty retail.

Sales Outlook for Melamine Beauty Product Market in the USA

Year USA Melamine Beauty Product Market (USD Million)
2025 49.21
2026 54.54
2027 60.44
2028 66.99
2029 74.24
2030 82.28
2031 91.19
2032 101.07
2033 112.01
2034 124.14
2035 137.58

The Melamine Beauty Product Market in the USA is projected to grow at a CAGR of 5.8% from 2025 to 2035, reaching USD 137.58 million by 2035, up from USD 49.21 million in 2025. This expansion is driven by heightened consumer preference for sensorial skincare, long-wear cosmetics, and high-performance hybrid formulations.

Increased demand is coming from both general consumers and professional users such as dermatologists and estheticians, who favor melamine-infused products for their film-forming and texture-enhancing properties. Growth is particularly visible in facial skincare, which commands a 44.5% share of the market value in 2025. Adoption is rising through premium beauty retail, dermatology clinics, and clean-label cosmetic startups integrating bio-fermented melamine derivatives.

  • Professional dermatology networks are pushing high-performance formulations in clinical skincare.
  • Facial skincare dominates the segment due to demand for hydration and matte-finish cosmetics.
  • Product innovation in film-forming textures is driving brand differentiation in the USA market.

Sales Outlook for Melamine Beauty Product Market in China

The Melamine Beauty Product Market in China is forecast to grow at a CAGR of 8.2% between 2025 and 2035. The market is valued at USD 39.80 million in 2025, with facial skincare accounting for 42.8% of sales. China's expansion is being fueled by a surge in domestic beauty brands, fermented skincare innovations, and an emerging preference for lightweight, pore-blurring formulations.

Government support for biocosmetics R&D and digital-first brand growth is accelerating demand for melamine-derived actives in hydrating creams, sun care, and hybrid skin-makeup products. City-tier expansion is introducing melamine-based products to emerging urban clusters. Local brands are promoting affordable, sensorial skincare with strong consumer loyalty. E-commerce integration and influencer-led marketing are propelling mass-market demand.

Growth and Expansion Outlook for Melamine Beauty Product Market in India

India's Melamine Beauty Product Market is projected to grow at a CAGR of 9.1% through 2035. Though currently smaller in size compared to leading markets, rising middle-class income, urban grooming consciousness, and beauty influencer ecosystems are expanding the scope of skincare and body care adoption. The country is experiencing increased usage of melamine-based ingredients in dermatologically tested products and hydration-focused formulations tailored to tropical climates.

Growth is especially visible in tier-2 and tier-3 cities, aided by D2C brands and regional distribution networks. Mass-market and affordable beauty ranges are adopting melamine films for product performance. Dermatology chains are recommending barrier-enhancing and anti-inflammatory applications. Ayurveda + actives hybrid brands are integrating melamine for sensory enhancement.

Growth and Expansion Outlook for Melamine Beauty Product Market in Germany

Germany’s Melamine Beauty Product Market is expected to register a CAGR of 8.9% during 2025–2035. The market is supported by strong cosmeceutical demand, clean-label product development, and cross-segment collaborations between beauty and pharma players. Premium skincare brands in Germany are using melamine-based polymers and copolymers to develop velvet-touch serums, barrier creams, and texture-enhancing BB creams.

The rise of eco-certification and demand for performance with compliance is further driving innovation. Apothecary channels are integrating high-performance actives in prescriptive skincare. Sustainability-oriented brands use melamine’s durability to reduce product wastage. Functional beauty tech startups are leveraging film-forming agents in dermatological trials.
Competitive Landscape of Global Melamine Beauty Product Market

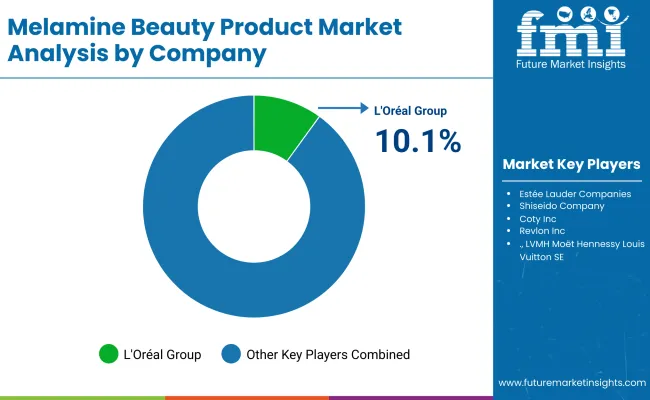
Melamine Beauty Product Market By Company

The Melamine Beauty Product Market is moderately fragmented, featuring a mix of global leaders, mid-sized innovators, and niche-focused specialists. Major brands like L'Oréal and Estée Lauder dominate the market, leveraging their extensive resources to develop advanced formulations that incorporate melamine-derived ingredients. These companies maintain significant market share through strong brand recognition and effective distribution networks, allowing them to cater to a wide range of consumer preferences.

To stay competitive, these leading brands increasingly emphasize clean-label trends, and digital innovation. They are adopting eco-friendly practices in sourcing and packaging while formulating products that prioritize transparency and safety. Additionally, digital engagement strategies, such as personalized marketing and interactive platforms, are becoming essential for building consumer loyalty and enhancing the overall shopping experience in the beauty sector.

Key Developments in Global Melamine Beauty Product Market

  • On October 12, 2024, Evonik, a global specialty chemicals company, entered into a strategic cooperation agreement with Kolmar Wuxi, one of the leading Chinese cosmetic companies. The partnership aims to develop sustainable raw materials and high-tech color cosmetics and skincare formulations to support China’s fast-growing beauty market.
  • In 2023, Hexion Inc. expanded its EcoBind™ resin portfolio with ultra-low-emission melamine-formaldehyde systems designed for safer consumer use. These resins reduce formaldehyde exposure while maintaining high film-building performance and durability, catering to the demand for long-wear and high-adhesion cosmetic products. expanded its EcoBind™ resin offerings with ultra-low-emission melamine-formaldehyde systems for safer use.

Scope of the Report

Item Value
Quantitative Units USD 245.1 million
Product Types Facial Skincare (Moisturizers, Serums & Essences, Face Masks, Toners), Color Cosmetics (Lipsticks & Lip Tints, Foundations & BB/CC Creams, Eye Makeup, Blushers & Highlighters), Body Lotions & Cr eams, Fragrances
Ingredient Types Melamine Formaldehyde Resins, Melamine Copolymers (e.g., Melamine- Tosylamide Resins), Crosslinked Melamine-Based Polymers (film formers, texture enhancers)
End-use Industry Professional Users, General Consumers, Sensitive Skin Consumers
Functional Claims Film Forming & Long-Lasting Wear, Gloss & Shine Enhancement, Texture Improvement, Durability & Water Resistance, Matte / Oil Control Effects
Sales Channel Online Channels (E-Commerce Website, Brand Website), Offline Channels (Department Stores, Drugstores / Pharmacies, Beauty Specialty Stores, Hypermarkets, Pop-up Stores)
Regions Covered North America, Europe, Asia-Pacific, Latin America, Middle East & Africa
Key Companies Profiled L'Oréal Group, Estée Lauder Companies, Shiseido Company, Coty Inc., Revlon Inc., LVMH Moët Hennessy Louis Vuitton SE, Chanel S.A., Unilever PLC, Procter & Gamble Co., Johnson & Johnson, Amorepacific Corporation, Beiersdorf AG, Avon Products, Kao Corporation, Elizabeth Arden
Additional Attributes Dollar sales by product type and ingredient category, adoption trends in multifunctional beauty products, rising demand for melamine-enhanced formulations, sector-specific growth in skincare, color cosmetics, and body care, revenue segmentation by online and offline sales channels, integration with digital marketing and personalized beauty solutions, consumer engagement through functional claims like durability and gloss enhancement, regional trends shaped by digital-first buying behavior and pop-up store activations, and innovations in melamine-based polymers supporting long-lasting, oil-controlling, and shine-enhancing effects.

Key Segments

By Product Type:

  • Facial Skincare
    • Moisturizers
    • Serums & Essences
    • Face Masks
    • Toners
  • Color Cosmetics
    • Lipsticks & Lip Tints
    • Foundations & BB/CC Creams
    • Eye Makeup
    • Blushers & Highlighters

By Functional Claims:

  • Film Forming & Long-Lasting Wear
  • Gloss & Shine Enhancement
  • Texture Improvement
  • Durability & Water Resistance
  • Matte / Oil Control Effects

By Sales Channel:

  • Online Channels
    • E-Commerce Website
    • Brand Website
  • Offline Channels
    • Department Stores
    • Drugstores / Pharmacies
    • Beauty Specialty Stores
    • Hypermarkets
    • Pop-up Stores

By End-User:

  • Professional Users
  • General Consumers
  • Sensitive Skin Consumers

By Ingredient Types:

  • Melamine Formaldehyde Resins
  • Melamine Copolymers (e.g., Melamine-Tosylamide Resins)
  • Crosslinked Melamine-Based Polymers (film formers, texture enhancers)

By Region:

  • South Asia & Pacific
  • North America
  • Latin America
  • Europe
  • East Asia
  • Middle East and Africa

Table of Content

  1. Executive Summary
    • Global Market Outlook
    • Demand-side Trends
    • Supply-side Trends
    • Technology Roadmap Analysis
    • Analysis and Recommendations
  2. Market Overview
    • Market Coverage / Taxonomy
    • Market Definition / Scope / Limitations
  3. Market Background
    • Market Dynamics
      • Drivers
      • Restraints
      • Opportunity
      • Trends
    • Scenario Forecast
      • Demand in Optimistic Scenario
      • Demand in Likely Scenario
      • Demand in Conservative Scenario
    • Opportunity Map Analysis
    • Product Life Cycle Analysis
    • Supply Chain Analysis
      • Supply Side Participants and their Roles
        • Producers
        • Mid-Level Participants (Traders/ Agents/ Brokers)
        • Wholesalers and Distributors
      • Value Added and Value Created at Node in the Supply Chain
      • List of Raw Material Suppliers
      • List of Existing and Potential Buyer’s
    • Investment Feasibility Matrix
    • Value Chain Analysis
      • Profit Margin Analysis
      • Wholesalers and Distributors
      • Retailers
    • PESTLE and Porter’s Analysis
    • Regulatory Landscape
      • By Key Regions
      • By Key Countries
    • Regional Parent Market Outlook
    • Production and Consumption Statistics
    • Import and Export Statistics
  4. Global Market Analysis 2020 to 2024 and Forecast, 2025 to 2035
    • Historical Market Size Value (USD Million) & Volume (Units) Analysis, 2020 to 2024
    • Current and Future Market Size Value (USD Million) & Volume (Units) Projections, 2025 to 2035
      • Y-o-Y Growth Trend Analysis
      • Absolute $ Opportunity Analysis
  5. Global Market Analysis 2020 to 2024 and Forecast 2025 to 2035, By Product Type
    • Introduction / Key Findings
    • Historical Market Size Value (USD Million) & Volume (Units) Analysis By Product Type, 2020 to 2024
    • Current and Future Market Size Value (USD Million) & Volume (Units) Analysis and Forecast By Product Type, 2025 to 2035
      • Facial Skincare
        • Moisturizers
        • Serums & Essences
        • Face Masks
        • Toners
      • Color Cosmetics
        • Lipsticks & Lip Tints
        • Foundations & BB/CC Creams
        • Eye Makeup
        • Blushers & Highlighters
  6.  
      • Body Lotions & Creams
      • Fragrances
    • Y-o-Y Growth Trend Analysis By Product Type, 2020 to 2024
    • Absolute $ Opportunity Analysis By Product Type, 2025 to 2035
  7. Global Market Analysis 2020 to 2024 and Forecast 2025 to 2035, By Functional Claims
    • Introduction / Key Findings
    • Historical Market Size Value (USD Million) & Volume (Units) Analysis By Functional Claims, 2020 to 2024
    • Current and Future Market Size Value (USD Million) & Volume (Units) Analysis and Forecast By Functional Claims, 2025 to 2035
      • Film Forming & Long-Lasting Wear
      • Gloss & Shine Enhancement
      • Texture Improvement
      • Durability & Water Resistance
      • Matte / Oil Control Effects
    • Y-o-Y Growth Trend Analysis By Functional Claims, 2020 to 2024
    • Absolute $ Opportunity Analysis By Functional Claims, 2025 to 2035
  8. Global Market Analysis 2020 to 2024 and Forecast 2025 to 2035, By Sales Channel
    • Introduction / Key Findings
    • Historical Market Size Value (USD Million) & Volume (Units) Analysis By Sales Channel, 2020 to 2024
    • Current and Future Market Size Value (USD Million) & Volume (Units) Analysis and Forecast By Sales Channel, 2025 to 2035
      • Online Channels
        • E-Commerce Website
        • Brand Website
      • Offline Channels
        • Department Stores
        • Drugstores / Pharmacies
        • Beauty Specialty Stores
        • Hypermarkets
        • Pop-up Stores 
    • Y-o-Y Growth Trend Analysis By Sales Channel, 2020 to 2024
    • Absolute $ Opportunity Analysis By Sales Channel, 2025 to 2035
  9. Global Market Analysis 2020 to 2024 and Forecast 2025 to 2035, By End-User
    • Introduction / Key Findings
    • Historical Market Size Value (USD Million) & Volume (Units) Analysis By End-User , 2020 to 2024
    • Current and Future Market Size Value (USD Million) & Volume (Units) Analysis and Forecast By End-User , 2025 to 2035
      • Professional Users
      • General Consumers
      • Sensitive Skin Consumers
    • Y-o-Y Growth Trend Analysis By End-User , 2020 to 2024
    • Absolute $ Opportunity Analysis By End-User , 2025 to 2035
  10. Global Market Analysis 2020 to 2024 and Forecast 2025 to 2035, By Ingredient Types
    • Introduction / Key Findings
    • Historical Market Size Value (USD Million) & Volume (Units) Analysis By Ingredient Types, 2020 to 2024
    • Current and Future Market Size Value (USD Million) & Volume (Units) Analysis and Forecast By Ingredient Types, 2025 to 2035
      • Melamine Formaldehyde Resins
      • Melamine Copolymers (e.g., Melamine-Tosylamide Resins)
      • Crosslinked Melamine-Based Polymers (film formers, texture enhancers)
    • Y-o-Y Growth Trend Analysis By Ingredient Types, 2020 to 2024
    • Absolute $ Opportunity Analysis By Ingredient Types, 2025 to 2035
  11. Global Market Analysis 2020 to 2024 and Forecast 2025 to 2035, By Region
    • Introduction
    • Historical Market Size Value (USD Million) & Volume (Units) Analysis By Region, 2020 to 2024
    • Current Market Size Value (USD Million) & Volume (Units) Analysis and Forecast By Region, 2025 to 2035
      • South Asia & Pacific
      • North America
      • Latin America
      • Europe
      • East Asia
      • Middle East and Africa
    • Market Attractiveness Analysis By Region
  12. South Asia & Pacific Market Analysis 2020 to 2024 and Forecast 2025 to 2035, By Country
    • Historical Market Size Value (USD Million) & Volume (Units) Trend Analysis By Market Taxonomy, 2020 to 2024
    • Market Size Value (USD Million) & Volume (Units) Forecast By Market Taxonomy, 2025 to 2035
      • By Country
        • India
        • Thailand
        • Malaysia
        • Indonesia
        • Singapore
        • Vietnam
        • Australia
        • New Zealand
        • Rest of South Asia
      • By Product Type
      • By Functional Claims
      • By Sales Channel
      • By End-User
      • By Ingredient Types
    • Market Attractiveness Analysis
      • By Country
      • By Product Type
      • By Functional Claims
      • By Sales Channel
      • By End-User
      • By Ingredient Types
    • Key Takeaways
  13. North America Market Analysis 2020 to 2024 and Forecast 2025 to 2035, By Country
    • Historical Market Size Value (USD Million) & Volume (Units) Trend Analysis By Market Taxonomy, 2020 to 2024
    • Market Size Value (USD Million) & Volume (Units) Forecast By Market Taxonomy, 2025 to 2035
      • By Country
        • USA
        • Canada
      • By Product Type
      • By Functional Claims
      • By Sales Channel
      • By End-User
      • By Ingredient Types
    • Market Attractiveness Analysis
      • By Country
      • By Product Type
      • By Functional Claims
      • By Sales Channel
      • By End-User
      • By Ingredient Types
    • Key Takeaways
  14. Latin America Market Analysis 2020 to 2024 and Forecast 2025 to 2035, By Country
    • Historical Market Size Value (USD Million) & Volume (Units) Trend Analysis By Market Taxonomy, 2020 to 2024
    • Market Size Value (USD Million) & Volume (Units) Forecast By Market Taxonomy, 2025 to 2035
      • By Country
        • Brazil
        • Mexico
        • Colombia
        • Rest of Latin America
      • By Product Type
      • By Functional Claims
      • By Sales Channel
      • By End-User
      • By Ingredient Types
    • Market Attractiveness Analysis
      • By Country
      • By Product Type
      • By Functional Claims
      • By Sales Channel
      • By End-User
      • By Ingredient Types
    • Key Takeaways
  15. Europe Market Analysis 2020 to 2024 and Forecast 2025 to 2035, By Country
    • Historical Market Size Value (USD Million) & Volume (Units) Trend Analysis By Market Taxonomy, 2020 to 2024
    • Market Size Value (USD Million) & Volume (Units) Forecast By Market Taxonomy, 2025 to 2035
      • By Country
        • Germany
        • UK
        • France
        • Italy
        • Spain
        • Belgium
        • Netherlands
        • Nordic
        • Switzerland
        • Russia
        • Poland
        • Rest of Europe
      • By Product Type
      • By Functional Claims
      • By Sales Channel
      • By End-User
      • By Ingredient Types
    • Market Attractiveness Analysis
      • By Country
      • By Product Type
      • By Functional Claims
      • By Sales Channel
      • By End-User
      • By Ingredient Types
    • Key Takeaways
  16. East Asia Market Analysis 2020 to 2024 and Forecast 2025 to 2035, By Country
    • Historical Market Size Value (USD Million) & Volume (Units) Trend Analysis By Market Taxonomy, 2020 to 2024
    • Market Size Value (USD Million) & Volume (Units) Forecast By Market Taxonomy, 2025 to 2035
      • By Country
        • China
        • Japan
        • South Korea
      • By Product Type
      • By Functional Claims
      • By Sales Channel
      • By End-User
      • By Ingredient Types
    • Market Attractiveness Analysis
      • By Country
      • By Product Type
      • By Functional Claims
      • By Sales Channel
      • By End-User
      • By Ingredient Types
    • Key Takeaways
  17. Middle East and Africa Market Analysis 2020 to 2024 and Forecast 2025 to 2035, By Country
    • Historical Market Size Value (USD Million) & Volume (Units) Trend Analysis By Market Taxonomy, 2020 to 2024
    • Market Size Value (USD Million) & Volume (Units) Forecast By Market Taxonomy, 2025 to 2035
      • By Country
        • Turkey
        • UAE
        • Saudi Arabia
        • Israel
        • Other GCC Countries
        • North Africa
        • South Africa
      • By Product Type
      • By Functional Claims
      • By Sales Channel
      • By End-User
      • By Ingredient Types
    • Market Attractiveness Analysis
      • By Country
      • By Product Type
      • By Functional Claims
      • By Sales Channel
      • By End-User
      • By Ingredient Types
    • Key Takeaways
  18. Key Countries Market Analysis
    • USA
      • Pricing Analysis
      • Market Share Analysis, 2024
        • By Product Type
        • By Functional Claims
        • By Sales Channel
        • By End-User
        • By Ingredient Types
    • Canada
      • Pricing Analysis
      • Market Share Analysis, 2024
        • By Product Type
        • By Functional Claims
        • By Sales Channel
        • By End-User
        • By Ingredient Types
    • Brazil
      • Pricing Analysis
      • Market Share Analysis, 2024
        • By Product Type
        • By Functional Claims
        • By Sales Channel
        • By End-User
        • By Ingredient Types
    • Mexico
      • Pricing Analysis
      • Market Share Analysis, 2024
        • By Product Type
        • By Functional Claims
        • By Sales Channel
        • By End-User
        • By Ingredient Types
    • Colombia
      • Pricing Analysis
      • Market Share Analysis, 2024
        • By Product Type
        • By Functional Claims
        • By Sales Channel
        • By End-User
        • By Ingredient Types
    • Rest of Latin America
      • Pricing Analysis
      • Market Share Analysis, 2024
        • By Product Type
        • By Functional Claims
        • By Sales Channel
        • By End-User
        • By Ingredient Types
    • Germany
      • Pricing Analysis
      • Market Share Analysis, 2024
        • By Product Type
        • By Functional Claims
        • By Sales Channel
        • By End-User
        • By Ingredient Types
    • UK
      • Pricing Analysis
      • Market Share Analysis, 2024
        • By Product Type
        • By Functional Claims
        • By Sales Channel
        • By End-User
        • By Ingredient Types
    • France
      • Pricing Analysis
      • Market Share Analysis, 2024
        • By Product Type
        • By Functional Claims
        • By Sales Channel
        • By End-User
        • By Ingredient Types
    • Italy
      • Pricing Analysis
      • Market Share Analysis, 2024
        • By Product Type
        • By Functional Claims
        • By Sales Channel
        • By End-User
        • By Ingredient Types
    • Spain
      • Pricing Analysis
      • Market Share Analysis, 2024
        • By Product Type
        • By Functional Claims
        • By Sales Channel
        • By End-User
        • By Ingredient Types
    • Belgium
      • Pricing Analysis
      • Market Share Analysis, 2024
        • By Product Type
        • By Functional Claims
        • By Sales Channel
        • By End-User
        • By Ingredient Types
    • Netherlands
      • Pricing Analysis
      • Market Share Analysis, 2024
        • By Product Type
        • By Functional Claims
        • By Sales Channel
        • By End-User
        • By Ingredient Types
    • Nordic
      • Pricing Analysis
      • Market Share Analysis, 2024
        • By Product Type
        • By Functional Claims
        • By Sales Channel
        • By End-User
        • By Ingredient Types
    • Switzerland
      • Pricing Analysis
      • Market Share Analysis, 2024
        • By Product Type
        • By Functional Claims
        • By Sales Channel
        • By End-User
        • By Ingredient Types
    • Russia
      • Pricing Analysis
      • Market Share Analysis, 2024
        • By Product Type
        • By Functional Claims
        • By Sales Channel
        • By End-User
        • By Ingredient Types
    • Poland
      • Pricing Analysis
      • Market Share Analysis, 2024
        • By Product Type
        • By Functional Claims
        • By Sales Channel
        • By End-User
        • By Ingredient Types
    • Rest of Europe
      • Pricing Analysis
      • Market Share Analysis, 2024
        • By Product Type
        • By Functional Claims
        • By Sales Channel
        • By End-User
        • By Ingredient Types
    • China
      • Pricing Analysis
      • Market Share Analysis, 2024
        • By Product Type
        • By Functional Claims
        • By Sales Channel
        • By End-User
        • By Ingredient Types
    • Japan
      • Pricing Analysis
      • Market Share Analysis, 2024
        • By Product Type
        • By Functional Claims
        • By Sales Channel
        • By End-User
        • By Ingredient Types
    • South Korea
      • Pricing Analysis
      • Market Share Analysis, 2024
        • By Product Type
        • By Functional Claims
        • By Sales Channel
        • By End-User
        • By Ingredient Types
    • India
      • Pricing Analysis
      • Market Share Analysis, 2024
        • By Product Type
        • By Functional Claims
        • By Sales Channel
        • By End-User
        • By Ingredient Types
    • Thailand
      • Pricing Analysis
      • Market Share Analysis, 2024
        • By Product Type
        • By Functional Claims
        • By Sales Channel
        • By End-User
        • By Ingredient Types
    • Malaysia
      • Pricing Analysis
      • Market Share Analysis, 2024
        • By Product Type
        • By Functional Claims
        • By Sales Channel
        • By End-User
        • By Ingredient Types
    • Indonesia
      • Pricing Analysis
      • Market Share Analysis, 2024
        • By Product Type
        • By Functional Claims
        • By Sales Channel
        • By End-User
        • By Ingredient Types
    • Singapore
      • Pricing Analysis
      • Market Share Analysis, 2024
        • By Product Type
        • By Functional Claims
        • By Sales Channel
        • By End-User
        • By Ingredient Types
    • Vietnam
      • Pricing Analysis
      • Market Share Analysis, 2024
        • By Product Type
        • By Functional Claims
        • By Sales Channel
        • By End-User
        • By Ingredient Types
    • Australia
      • Pricing Analysis
      • Market Share Analysis, 2024
        • By Product Type
        • By Functional Claims
        • By Sales Channel
        • By End-User
        • By Ingredient Types
    • New Zealand
      • Pricing Analysis
      • Market Share Analysis, 2024
        • By Product Type
        • By Functional Claims
        • By Sales Channel
        • By End-User
        • By Ingredient Types
    • Rest of South Asia
      • Pricing Analysis
      • Market Share Analysis, 2024
        • By Product Type
        • By Functional Claims
        • By Sales Channel
        • By End-User
        • By Ingredient Types
  19. Market Structure Analysis
    • Competition Dashboard
    • Competition Benchmarking
    • Market Share Analysis of Top Players
      • By Regional
      • By Product Type
      • By Functional Claims
      • By Sales Channel
      • By End-User
      • By Ingredient Types
  20. Competition Analysis
    • Competition Deep Dive
      • L'Oréal Group
        • Overview
        • Product Portfolio
        • Profitability by Market Segments (Product/Age /Sales Channel/Region)
        • Sales Footprint
        • Strategy Overview
          • Marketing Strategy
          • Product Strategy
          • Channel Strategy
      • Estée Lauder Companies
        • Overview
        • Product Portfolio
        • Profitability by Market Segments (Product/Age /Sales Channel/Region)
        • Sales Footprint
        • Strategy Overview
          • Marketing Strategy
          • Product Strategy
          • Channel Strategy
      • Shiseido Company
        • Overview
        • Product Portfolio
        • Profitability by Market Segments (Product/Age /Sales Channel/Region)
        • Sales Footprint
        • Strategy Overview
          • Marketing Strategy
          • Product Strategy
          • Channel Strategy
      • Coty Inc.
        • Overview
        • Product Portfolio
        • Profitability by Market Segments (Product/Age /Sales Channel/Region)
        • Sales Footprint
        • Strategy Overview
          • Marketing Strategy
          • Product Strategy
          • Channel Strategy
      • Revlon Inc.
        • Overview
        • Product Portfolio
        • Profitability by Market Segments (Product/Age /Sales Channel/Region)
        • Sales Footprint
        • Strategy Overview
          • Marketing Strategy
          • Product Strategy
          • Channel Strategy
      • LVMH Moët Hennessy Louis Vuitton SE
        • Overview
        • Product Portfolio
        • Profitability by Market Segments (Product/Age /Sales Channel/Region)
        • Sales Footprint
        • Strategy Overview
          • Marketing Strategy
          • Product Strategy
          • Channel Strategy
      • Chanel S.A.
        • Overview
        • Product Portfolio
        • Profitability by Market Segments (Product/Age /Sales Channel/Region)
        • Sales Footprint
        • Strategy Overview
          • Marketing Strategy
          • Product Strategy
          • Channel Strategy
      • Unilever PLC
        • Overview
        • Product Portfolio
        • Profitability by Market Segments (Product/Age /Sales Channel/Region)
        • Sales Footprint
        • Strategy Overview
          • Marketing Strategy
          • Product Strategy
          • Channel Strategy
      • Procter & Gamble Co. (P&G)
        • Overview
        • Product Portfolio
        • Profitability by Market Segments (Product/Age /Sales Channel/Region)
        • Sales Footprint
        • Strategy Overview
          • Marketing Strategy
          • Product Strategy
          • Channel Strategy
      • Johnson & Johnson
        • Overview
        • Product Portfolio
        • Profitability by Market Segments (Product/Age /Sales Channel/Region)
        • Sales Footprint
        • Strategy Overview
          • Marketing Strategy
          • Product Strategy
          • Channel Strategy
      • Amorepacific Corporation
        • Overview
        • Product Portfolio
        • Profitability by Market Segments (Product/Age /Sales Channel/Region)
        • Sales Footprint
        • Strategy Overview
          • Marketing Strategy
          • Product Strategy
          • Channel Strategy
      • Beiersdorf AG
        • Overview
        • Product Portfolio
        • Profitability by Market Segments (Product/Age /Sales Channel/Region)
        • Sales Footprint
        • Strategy Overview
          • Marketing Strategy
          • Product Strategy
          • Channel Strategy
      • Avon Products, Inc.
        • Overview
        • Product Portfolio
        • Profitability by Market Segments (Product/Age /Sales Channel/Region)
        • Sales Footprint
        • Strategy Overview
          • Marketing Strategy
          • Product Strategy
          • Channel Strategy
      • Kao Corporation
        • Overview
        • Product Portfolio
        • Profitability by Market Segments (Product/Age /Sales Channel/Region)
        • Sales Footprint
        • Strategy Overview
          • Marketing Strategy
          • Product Strategy
          • Channel Strategy
      • Elizabeth Arden, Inc.
        • Overview
        • Product Portfolio
        • Profitability by Market Segments (Product/Age /Sales Channel/Region)
        • Sales Footprint
        • Strategy Overview
          • Marketing Strategy
          • Product Strategy
          • Channel Strategy
  21. Assumptions & Acronyms Used
  22. Research Methodology

List of Tables

  • Table 1: Global Market Value (USD Million) Forecast by Region, 2020-2035
  • Table 2: Global Market Volume (Units) Forecast by Region, 2020-2035
  • Table 3: Global Market Value (USD Million) Forecast by Product Type, 2020-2035
  • Table 4: Global Market Volume (Units) Forecast by Product Type, 2020-2035
  • Table 5: Global Market Value (USD Million) Forecast by Functional Claims, 2020-2035
  • Table 6: Global Market Volume (Units) Forecast by Functional Claims, 2020-2035
  • Table 7: Global Market Value (USD Million) Forecast by Sales Channel, 2020-2035
  • Table 8: Global Market Volume (Units) Forecast by Sales Channel, 2020-2035
  • Table 9: Global Market Value (USD Million) Forecast by End-User , 2020-2035
  • Table 10: Global Market Volume (Units) Forecast by End-User , 2020-2035
  • Table 11: Global Market Value (USD Million) Forecast by Ingredient Types, 2020-2035
  • Table 12: Global Market Volume (Units) Forecast by Ingredient Types, 2020-2035
  • Table 13: South Asia & Pacific Market Value (USD Million) Forecast by Country, 2020-2035
  • Table 14: South Asia & Pacific Market Volume (Units) Forecast by Country, 2020-2035
  • Table 15: South Asia & Pacific Market Value (USD Million) Forecast by Product Type, 2020-2035
  • Table 16: South Asia & Pacific Market Volume (Units) Forecast by Product Type, 2020-2035
  • Table 17: South Asia & Pacific Market Value (USD Million) Forecast by Functional Claims, 2020-2035
  • Table 18: South Asia & Pacific Market Volume (Units) Forecast by Functional Claims, 2020-2035
  • Table 19: South Asia & Pacific Market Value (USD Million) Forecast by Sales Channel, 2020-2035
  • Table 20: South Asia & Pacific Market Volume (Units) Forecast by Sales Channel, 2020-2035
  • Table 21: South Asia & Pacific Market Value (USD Million) Forecast by End-User , 2020-2035
  • Table 22: South Asia & Pacific Market Volume (Units) Forecast by End-User , 2020-2035
  • Table 23: South Asia & Pacific Market Value (USD Million) Forecast by Ingredient Types, 2020-2035
  • Table 24: South Asia & Pacific Market Volume (Units) Forecast by Ingredient Types, 2020-2035
  • Table 25: North America Market Value (USD Million) Forecast by Country, 2020-2035
  • Table 26: North America Market Volume (Units) Forecast by Country, 2020-2035
  • Table 27: North America Market Value (USD Million) Forecast by Product Type, 2020-2035
  • Table 28: North America Market Volume (Units) Forecast by Product Type, 2020-2035
  • Table 29: North America Market Value (USD Million) Forecast by Functional Claims, 2020-2035
  • Table 30: North America Market Volume (Units) Forecast by Functional Claims, 2020-2035
  • Table 31: North America Market Value (USD Million) Forecast by Sales Channel, 2020-2035
  • Table 32: North America Market Volume (Units) Forecast by Sales Channel, 2020-2035
  • Table 33: North America Market Value (USD Million) Forecast by End-User , 2020-2035
  • Table 34: North America Market Volume (Units) Forecast by End-User , 2020-2035
  • Table 35: North America Market Value (USD Million) Forecast by Ingredient Types, 2020-2035
  • Table 36: North America Market Volume (Units) Forecast by Ingredient Types, 2020-2035
  • Table 37: Latin America Market Value (USD Million) Forecast by Country, 2020-2035
  • Table 38: Latin America Market Volume (Units) Forecast by Country, 2020-2035
  • Table 39: Latin America Market Value (USD Million) Forecast by Product Type, 2020-2035
  • Table 40: Latin America Market Volume (Units) Forecast by Product Type, 2020-2035
  • Table 41: Latin America Market Value (USD Million) Forecast by Functional Claims, 2020-2035
  • Table 42: Latin America Market Volume (Units) Forecast by Functional Claims, 2020-2035
  • Table 43: Latin America Market Value (USD Million) Forecast by Sales Channel, 2020-2035
  • Table 44: Latin America Market Volume (Units) Forecast by Sales Channel, 2020-2035
  • Table 45: Latin America Market Value (USD Million) Forecast by End-User , 2020-2035
  • Table 46: Latin America Market Volume (Units) Forecast by End-User , 2020-2035
  • Table 47: Latin America Market Value (USD Million) Forecast by Ingredient Types, 2020-2035
  • Table 48: Latin America Market Volume (Units) Forecast by Ingredient Types, 2020-2035
  • Table 49: Europe Market Value (USD Million) Forecast by Country, 2020-2035
  • Table 50: Europe Market Volume (Units) Forecast by Country, 2020-2035
  • Table 51: Europe Market Value (USD Million) Forecast by Product Type, 2020-2035
  • Table 52: Europe Market Volume (Units) Forecast by Product Type, 2020-2035
  • Table 53: Europe Market Value (USD Million) Forecast by Functional Claims, 2020-2035
  • Table 54: Europe Market Volume (Units) Forecast by Functional Claims, 2020-2035
  • Table 55: Europe Market Value (USD Million) Forecast by Sales Channel, 2020-2035
  • Table 56: Europe Market Volume (Units) Forecast by Sales Channel, 2020-2035
  • Table 57: Europe Market Value (USD Million) Forecast by End-User , 2020-2035
  • Table 58: Europe Market Volume (Units) Forecast by End-User , 2020-2035
  • Table 59: Europe Market Value (USD Million) Forecast by Ingredient Types, 2020-2035
  • Table 60: Europe Market Volume (Units) Forecast by Ingredient Types, 2020-2035
  • Table 61: East Asia Market Value (USD Million) Forecast by Country, 2020-2035
  • Table 62: East Asia Market Volume (Units) Forecast by Country, 2020-2035
  • Table 63: East Asia Market Value (USD Million) Forecast by Product Type, 2020-2035
  • Table 64: East Asia Market Volume (Units) Forecast by Product Type, 2020-2035
  • Table 65: East Asia Market Value (USD Million) Forecast by Functional Claims, 2020-2035
  • Table 66: East Asia Market Volume (Units) Forecast by Functional Claims, 2020-2035
  • Table 67: East Asia Market Value (USD Million) Forecast by Sales Channel, 2020-2035
  • Table 68: East Asia Market Volume (Units) Forecast by Sales Channel, 2020-2035
  • Table 69: East Asia Market Value (USD Million) Forecast by End-User , 2020-2035
  • Table 70: East Asia Market Volume (Units) Forecast by End-User , 2020-2035
  • Table 71: East Asia Market Value (USD Million) Forecast by Ingredient Types, 2020-2035
  • Table 72: East Asia Market Volume (Units) Forecast by Ingredient Types, 2020-2035
  • Table 73: Middle East and Africa Market Value (USD Million) Forecast by Country, 2020-2035
  • Table 74: Middle East and Africa Market Volume (Units) Forecast by Country, 2020-2035
  • Table 75: Middle East and Africa Market Value (USD Million) Forecast by Product Type, 2020-2035
  • Table 76: Middle East and Africa Market Volume (Units) Forecast by Product Type, 2020-2035
  • Table 77: Middle East and Africa Market Value (USD Million) Forecast by Functional Claims, 2020-2035
  • Table 78: Middle East and Africa Market Volume (Units) Forecast by Functional Claims, 2020-2035
  • Table 79: Middle East and Africa Market Value (USD Million) Forecast by Sales Channel, 2020-2035
  • Table 80: Middle East and Africa Market Volume (Units) Forecast by Sales Channel, 2020-2035
  • Table 81: Middle East and Africa Market Value (USD Million) Forecast by End-User , 2020-2035
  • Table 82: Middle East and Africa Market Volume (Units) Forecast by End-User , 2020-2035
  • Table 83: Middle East and Africa Market Value (USD Million) Forecast by Ingredient Types, 2020-2035
  • Table 84: Middle East and Africa Market Volume (Units) Forecast by Ingredient Types, 2020-2035

List of Figures

  • Figure 1: Global Market Value (USD Million) by Product Type, 2025-2035
  • Figure 2: Global Market Value (USD Million) by Functional Claims, 2025-2035
  • Figure 3: Global Market Value (USD Million) by Sales Channel, 2025-2035
  • Figure 4: Global Market Value (USD Million) by End-User , 2025-2035
  • Figure 5: Global Market Value (USD Million) by Ingredient Types, 2025-2035
  • Figure 6: Global Market Value (USD Million) by Region, 2025-2035
  • Figure 7: Global Market Value (USD Million) Analysis by Region, 2020-2035
  • Figure 8: Global Market Volume (Units) Analysis by Region, 2020-2035
  • Figure 9: Global Market Value Share (%) and BPS Analysis by Region, 2025-2035
  • Figure 10: Global Market Y-o-Y Growth (%) Projections by Region, 2025-2035
  • Figure 11: Global Market Value (USD Million) Analysis by Product Type, 2020-2035
  • Figure 12: Global Market Volume (Units) Analysis by Product Type, 2020-2035
  • Figure 13: Global Market Value Share (%) and BPS Analysis by Product Type, 2025-2035
  • Figure 14: Global Market Y-o-Y Growth (%) Projections by Product Type, 2025-2035
  • Figure 15: Global Market Value (USD Million) Analysis by Functional Claims, 2020-2035
  • Figure 16: Global Market Volume (Units) Analysis by Functional Claims, 2020-2035
  • Figure 17: Global Market Value Share (%) and BPS Analysis by Functional Claims, 2025-2035
  • Figure 18: Global Market Y-o-Y Growth (%) Projections by Functional Claims, 2025-2035
  • Figure 19: Global Market Value (USD Million) Analysis by Sales Channel, 2020-2035
  • Figure 20: Global Market Volume (Units) Analysis by Sales Channel, 2020-2035
  • Figure 21: Global Market Value Share (%) and BPS Analysis by Sales Channel, 2025-2035
  • Figure 22: Global Market Y-o-Y Growth (%) Projections by Sales Channel, 2025-2035
  • Figure 23: Global Market Value (USD Million) Analysis by End-User , 2020-2035
  • Figure 24: Global Market Volume (Units) Analysis by End-User , 2020-2035
  • Figure 25: Global Market Value Share (%) and BPS Analysis by End-User , 2025-2035
  • Figure 26: Global Market Y-o-Y Growth (%) Projections by End-User , 2025-2035
  • Figure 27: Global Market Value (USD Million) Analysis by Ingredient Types, 2020-2035
  • Figure 28: Global Market Volume (Units) Analysis by Ingredient Types, 2020-2035
  • Figure 29: Global Market Value Share (%) and BPS Analysis by Ingredient Types, 2025-2035
  • Figure 30: Global Market Y-o-Y Growth (%) Projections by Ingredient Types, 2025-2035
  • Figure 31: Global Market Attractiveness by Product Type, 2025-2035
  • Figure 32: Global Market Attractiveness by Functional Claims, 2025-2035
  • Figure 33: Global Market Attractiveness by Sales Channel, 2025-2035
  • Figure 34: Global Market Attractiveness by End-User , 2025-2035
  • Figure 35: Global Market Attractiveness by Ingredient Types, 2025-2035
  • Figure 36: Global Market Attractiveness by Region, 2025-2035
  • Figure 37: South Asia & Pacific Market Value (USD Million) by Product Type, 2025-2035
  • Figure 38: South Asia & Pacific Market Value (USD Million) by Functional Claims, 2025-2035
  • Figure 39: South Asia & Pacific Market Value (USD Million) by Sales Channel, 2025-2035
  • Figure 40: South Asia & Pacific Market Value (USD Million) by End-User , 2025-2035
  • Figure 41: South Asia & Pacific Market Value (USD Million) by Ingredient Types, 2025-2035
  • Figure 42: South Asia & Pacific Market Value (USD Million) by Country, 2025-2035
  • Figure 43: South Asia & Pacific Market Value (USD Million) Analysis by Country, 2020-2035
  • Figure 44: South Asia & Pacific Market Volume (Units) Analysis by Country, 2020-2035
  • Figure 45: South Asia & Pacific Market Value Share (%) and BPS Analysis by Country, 2025-2035
  • Figure 46: South Asia & Pacific Market Y-o-Y Growth (%) Projections by Country, 2025-2035
  • Figure 47: South Asia & Pacific Market Value (USD Million) Analysis by Product Type, 2020-2035
  • Figure 48: South Asia & Pacific Market Volume (Units) Analysis by Product Type, 2020-2035
  • Figure 49: South Asia & Pacific Market Value Share (%) and BPS Analysis by Product Type, 2025-2035
  • Figure 50: South Asia & Pacific Market Y-o-Y Growth (%) Projections by Product Type, 2025-2035
  • Figure 51: South Asia & Pacific Market Value (USD Million) Analysis by Functional Claims, 2020-2035
  • Figure 52: South Asia & Pacific Market Volume (Units) Analysis by Functional Claims, 2020-2035
  • Figure 53: South Asia & Pacific Market Value Share (%) and BPS Analysis by Functional Claims, 2025-2035
  • Figure 54: South Asia & Pacific Market Y-o-Y Growth (%) Projections by Functional Claims, 2025-2035
  • Figure 55: South Asia & Pacific Market Value (USD Million) Analysis by Sales Channel, 2020-2035
  • Figure 56: South Asia & Pacific Market Volume (Units) Analysis by Sales Channel, 2020-2035
  • Figure 57: South Asia & Pacific Market Value Share (%) and BPS Analysis by Sales Channel, 2025-2035
  • Figure 58: South Asia & Pacific Market Y-o-Y Growth (%) Projections by Sales Channel, 2025-2035
  • Figure 59: South Asia & Pacific Market Value (USD Million) Analysis by End-User , 2020-2035
  • Figure 60: South Asia & Pacific Market Volume (Units) Analysis by End-User , 2020-2035
  • Figure 61: South Asia & Pacific Market Value Share (%) and BPS Analysis by End-User , 2025-2035
  • Figure 62: South Asia & Pacific Market Y-o-Y Growth (%) Projections by End-User , 2025-2035
  • Figure 63: South Asia & Pacific Market Value (USD Million) Analysis by Ingredient Types, 2020-2035
  • Figure 64: South Asia & Pacific Market Volume (Units) Analysis by Ingredient Types, 2020-2035
  • Figure 65: South Asia & Pacific Market Value Share (%) and BPS Analysis by Ingredient Types, 2025-2035
  • Figure 66: South Asia & Pacific Market Y-o-Y Growth (%) Projections by Ingredient Types, 2025-2035
  • Figure 67: South Asia & Pacific Market Attractiveness by Product Type, 2025-2035
  • Figure 68: South Asia & Pacific Market Attractiveness by Functional Claims, 2025-2035
  • Figure 69: South Asia & Pacific Market Attractiveness by Sales Channel, 2025-2035
  • Figure 70: South Asia & Pacific Market Attractiveness by End-User , 2025-2035
  • Figure 71: South Asia & Pacific Market Attractiveness by Ingredient Types, 2025-2035
  • Figure 72: South Asia & Pacific Market Attractiveness by Country, 2025-2035
  • Figure 73: North America Market Value (USD Million) by Product Type, 2025-2035
  • Figure 74: North America Market Value (USD Million) by Functional Claims, 2025-2035
  • Figure 75: North America Market Value (USD Million) by Sales Channel, 2025-2035
  • Figure 76: North America Market Value (USD Million) by End-User , 2025-2035
  • Figure 77: North America Market Value (USD Million) by Ingredient Types, 2025-2035
  • Figure 78: North America Market Value (USD Million) by Country, 2025-2035
  • Figure 79: North America Market Value (USD Million) Analysis by Country, 2020-2035
  • Figure 80: North America Market Volume (Units) Analysis by Country, 2020-2035
  • Figure 81: North America Market Value Share (%) and BPS Analysis by Country, 2025-2035
  • Figure 82: North America Market Y-o-Y Growth (%) Projections by Country, 2025-2035
  • Figure 83: North America Market Value (USD Million) Analysis by Product Type, 2020-2035
  • Figure 84: North America Market Volume (Units) Analysis by Product Type, 2020-2035
  • Figure 85: North America Market Value Share (%) and BPS Analysis by Product Type, 2025-2035
  • Figure 86: North America Market Y-o-Y Growth (%) Projections by Product Type, 2025-2035
  • Figure 87: North America Market Value (USD Million) Analysis by Functional Claims, 2020-2035
  • Figure 88: North America Market Volume (Units) Analysis by Functional Claims, 2020-2035
  • Figure 89: North America Market Value Share (%) and BPS Analysis by Functional Claims, 2025-2035
  • Figure 90: North America Market Y-o-Y Growth (%) Projections by Functional Claims, 2025-2035
  • Figure 91: North America Market Value (USD Million) Analysis by Sales Channel, 2020-2035
  • Figure 92: North America Market Volume (Units) Analysis by Sales Channel, 2020-2035
  • Figure 93: North America Market Value Share (%) and BPS Analysis by Sales Channel, 2025-2035
  • Figure 94: North America Market Y-o-Y Growth (%) Projections by Sales Channel, 2025-2035
  • Figure 95: North America Market Value (USD Million) Analysis by End-User , 2020-2035
  • Figure 96: North America Market Volume (Units) Analysis by End-User , 2020-2035
  • Figure 97: North America Market Value Share (%) and BPS Analysis by End-User , 2025-2035
  • Figure 98: North America Market Y-o-Y Growth (%) Projections by End-User , 2025-2035
  • Figure 99: North America Market Value (USD Million) Analysis by Ingredient Types, 2020-2035
  • Figure 100: North America Market Volume (Units) Analysis by Ingredient Types, 2020-2035
  • Figure 101: North America Market Value Share (%) and BPS Analysis by Ingredient Types, 2025-2035
  • Figure 102: North America Market Y-o-Y Growth (%) Projections by Ingredient Types, 2025-2035
  • Figure 103: North America Market Attractiveness by Product Type, 2025-2035
  • Figure 104: North America Market Attractiveness by Functional Claims, 2025-2035
  • Figure 105: North America Market Attractiveness by Sales Channel, 2025-2035
  • Figure 106: North America Market Attractiveness by End-User , 2025-2035
  • Figure 107: North America Market Attractiveness by Ingredient Types, 2025-2035
  • Figure 108: North America Market Attractiveness by Country, 2025-2035
  • Figure 109: Latin America Market Value (USD Million) by Product Type, 2025-2035
  • Figure 110: Latin America Market Value (USD Million) by Functional Claims, 2025-2035
  • Figure 111: Latin America Market Value (USD Million) by Sales Channel, 2025-2035
  • Figure 112: Latin America Market Value (USD Million) by End-User , 2025-2035
  • Figure 113: Latin America Market Value (USD Million) by Ingredient Types, 2025-2035
  • Figure 114: Latin America Market Value (USD Million) by Country, 2025-2035
  • Figure 115: Latin America Market Value (USD Million) Analysis by Country, 2020-2035
  • Figure 116: Latin America Market Volume (Units) Analysis by Country, 2020-2035
  • Figure 117: Latin America Market Value Share (%) and BPS Analysis by Country, 2025-2035
  • Figure 118: Latin America Market Y-o-Y Growth (%) Projections by Country, 2025-2035
  • Figure 119: Latin America Market Value (USD Million) Analysis by Product Type, 2020-2035
  • Figure 120: Latin America Market Volume (Units) Analysis by Product Type, 2020-2035
  • Figure 121: Latin America Market Value Share (%) and BPS Analysis by Product Type, 2025-2035
  • Figure 122: Latin America Market Y-o-Y Growth (%) Projections by Product Type, 2025-2035
  • Figure 123: Latin America Market Value (USD Million) Analysis by Functional Claims, 2020-2035
  • Figure 124: Latin America Market Volume (Units) Analysis by Functional Claims, 2020-2035
  • Figure 125: Latin America Market Value Share (%) and BPS Analysis by Functional Claims, 2025-2035
  • Figure 126: Latin America Market Y-o-Y Growth (%) Projections by Functional Claims, 2025-2035
  • Figure 127: Latin America Market Value (USD Million) Analysis by Sales Channel, 2020-2035
  • Figure 128: Latin America Market Volume (Units) Analysis by Sales Channel, 2020-2035
  • Figure 129: Latin America Market Value Share (%) and BPS Analysis by Sales Channel, 2025-2035
  • Figure 130: Latin America Market Y-o-Y Growth (%) Projections by Sales Channel, 2025-2035
  • Figure 131: Latin America Market Value (USD Million) Analysis by End-User , 2020-2035
  • Figure 132: Latin America Market Volume (Units) Analysis by End-User , 2020-2035
  • Figure 133: Latin America Market Value Share (%) and BPS Analysis by End-User , 2025-2035
  • Figure 134: Latin America Market Y-o-Y Growth (%) Projections by End-User , 2025-2035
  • Figure 135: Latin America Market Value (USD Million) Analysis by Ingredient Types, 2020-2035
  • Figure 136: Latin America Market Volume (Units) Analysis by Ingredient Types, 2020-2035
  • Figure 137: Latin America Market Value Share (%) and BPS Analysis by Ingredient Types, 2025-2035
  • Figure 138: Latin America Market Y-o-Y Growth (%) Projections by Ingredient Types, 2025-2035
  • Figure 139: Latin America Market Attractiveness by Product Type, 2025-2035
  • Figure 140: Latin America Market Attractiveness by Functional Claims, 2025-2035
  • Figure 141: Latin America Market Attractiveness by Sales Channel, 2025-2035
  • Figure 142: Latin America Market Attractiveness by End-User , 2025-2035
  • Figure 143: Latin America Market Attractiveness by Ingredient Types, 2025-2035
  • Figure 144: Latin America Market Attractiveness by Country, 2025-2035
  • Figure 145: Europe Market Value (USD Million) by Product Type, 2025-2035
  • Figure 146: Europe Market Value (USD Million) by Functional Claims, 2025-2035
  • Figure 147: Europe Market Value (USD Million) by Sales Channel, 2025-2035
  • Figure 148: Europe Market Value (USD Million) by End-User , 2025-2035
  • Figure 149: Europe Market Value (USD Million) by Ingredient Types, 2025-2035
  • Figure 150: Europe Market Value (USD Million) by Country, 2025-2035
  • Figure 151: Europe Market Value (USD Million) Analysis by Country, 2020-2035
  • Figure 152: Europe Market Volume (Units) Analysis by Country, 2020-2035
  • Figure 153: Europe Market Value Share (%) and BPS Analysis by Country, 2025-2035
  • Figure 154: Europe Market Y-o-Y Growth (%) Projections by Country, 2025-2035
  • Figure 155: Europe Market Value (USD Million) Analysis by Product Type, 2020-2035
  • Figure 156: Europe Market Volume (Units) Analysis by Product Type, 2020-2035
  • Figure 157: Europe Market Value Share (%) and BPS Analysis by Product Type, 2025-2035
  • Figure 158: Europe Market Y-o-Y Growth (%) Projections by Product Type, 2025-2035
  • Figure 159: Europe Market Value (USD Million) Analysis by Functional Claims, 2020-2035
  • Figure 160: Europe Market Volume (Units) Analysis by Functional Claims, 2020-2035
  • Figure 161: Europe Market Value Share (%) and BPS Analysis by Functional Claims, 2025-2035
  • Figure 162: Europe Market Y-o-Y Growth (%) Projections by Functional Claims, 2025-2035
  • Figure 163: Europe Market Value (USD Million) Analysis by Sales Channel, 2020-2035
  • Figure 164: Europe Market Volume (Units) Analysis by Sales Channel, 2020-2035
  • Figure 165: Europe Market Value Share (%) and BPS Analysis by Sales Channel, 2025-2035
  • Figure 166: Europe Market Y-o-Y Growth (%) Projections by Sales Channel, 2025-2035
  • Figure 167: Europe Market Value (USD Million) Analysis by End-User , 2020-2035
  • Figure 168: Europe Market Volume (Units) Analysis by End-User , 2020-2035
  • Figure 169: Europe Market Value Share (%) and BPS Analysis by End-User , 2025-2035
  • Figure 170: Europe Market Y-o-Y Growth (%) Projections by End-User , 2025-2035
  • Figure 171: Europe Market Value (USD Million) Analysis by Ingredient Types, 2020-2035
  • Figure 172: Europe Market Volume (Units) Analysis by Ingredient Types, 2020-2035
  • Figure 173: Europe Market Value Share (%) and BPS Analysis by Ingredient Types, 2025-2035
  • Figure 174: Europe Market Y-o-Y Growth (%) Projections by Ingredient Types, 2025-2035
  • Figure 175: Europe Market Attractiveness by Product Type, 2025-2035
  • Figure 176: Europe Market Attractiveness by Functional Claims, 2025-2035
  • Figure 177: Europe Market Attractiveness by Sales Channel, 2025-2035
  • Figure 178: Europe Market Attractiveness by End-User , 2025-2035
  • Figure 179: Europe Market Attractiveness by Ingredient Types, 2025-2035
  • Figure 180: Europe Market Attractiveness by Country, 2025-2035
  • Figure 181: East Asia Market Value (USD Million) by Product Type, 2025-2035
  • Figure 182: East Asia Market Value (USD Million) by Functional Claims, 2025-2035
  • Figure 183: East Asia Market Value (USD Million) by Sales Channel, 2025-2035
  • Figure 184: East Asia Market Value (USD Million) by End-User , 2025-2035
  • Figure 185: East Asia Market Value (USD Million) by Ingredient Types, 2025-2035
  • Figure 186: East Asia Market Value (USD Million) by Country, 2025-2035
  • Figure 187: East Asia Market Value (USD Million) Analysis by Country, 2020-2035
  • Figure 188: East Asia Market Volume (Units) Analysis by Country, 2020-2035
  • Figure 189: East Asia Market Value Share (%) and BPS Analysis by Country, 2025-2035
  • Figure 190: East Asia Market Y-o-Y Growth (%) Projections by Country, 2025-2035
  • Figure 191: East Asia Market Value (USD Million) Analysis by Product Type, 2020-2035
  • Figure 192: East Asia Market Volume (Units) Analysis by Product Type, 2020-2035
  • Figure 193: East Asia Market Value Share (%) and BPS Analysis by Product Type, 2025-2035
  • Figure 194: East Asia Market Y-o-Y Growth (%) Projections by Product Type, 2025-2035
  • Figure 195: East Asia Market Value (USD Million) Analysis by Functional Claims, 2020-2035
  • Figure 196: East Asia Market Volume (Units) Analysis by Functional Claims, 2020-2035
  • Figure 197: East Asia Market Value Share (%) and BPS Analysis by Functional Claims, 2025-2035
  • Figure 198: East Asia Market Y-o-Y Growth (%) Projections by Functional Claims, 2025-2035
  • Figure 199: East Asia Market Value (USD Million) Analysis by Sales Channel, 2020-2035
  • Figure 200: East Asia Market Volume (Units) Analysis by Sales Channel, 2020-2035
  • Figure 201: East Asia Market Value Share (%) and BPS Analysis by Sales Channel, 2025-2035
  • Figure 202: East Asia Market Y-o-Y Growth (%) Projections by Sales Channel, 2025-2035
  • Figure 203: East Asia Market Value (USD Million) Analysis by End-User , 2020-2035
  • Figure 204: East Asia Market Volume (Units) Analysis by End-User , 2020-2035
  • Figure 205: East Asia Market Value Share (%) and BPS Analysis by End-User , 2025-2035
  • Figure 206: East Asia Market Y-o-Y Growth (%) Projections by End-User , 2025-2035
  • Figure 207: East Asia Market Value (USD Million) Analysis by Ingredient Types, 2020-2035
  • Figure 208: East Asia Market Volume (Units) Analysis by Ingredient Types, 2020-2035
  • Figure 209: East Asia Market Value Share (%) and BPS Analysis by Ingredient Types, 2025-2035
  • Figure 210: East Asia Market Y-o-Y Growth (%) Projections by Ingredient Types, 2025-2035
  • Figure 211: East Asia Market Attractiveness by Product Type, 2025-2035
  • Figure 212: East Asia Market Attractiveness by Functional Claims, 2025-2035
  • Figure 213: East Asia Market Attractiveness by Sales Channel, 2025-2035
  • Figure 214: East Asia Market Attractiveness by End-User , 2025-2035
  • Figure 215: East Asia Market Attractiveness by Ingredient Types, 2025-2035
  • Figure 216: East Asia Market Attractiveness by Country, 2025-2035
  • Figure 217: Middle East and Africa Market Value (USD Million) by Product Type, 2025-2035
  • Figure 218: Middle East and Africa Market Value (USD Million) by Functional Claims, 2025-2035
  • Figure 219: Middle East and Africa Market Value (USD Million) by Sales Channel, 2025-2035
  • Figure 220: Middle East and Africa Market Value (USD Million) by End-User , 2025-2035
  • Figure 221: Middle East and Africa Market Value (USD Million) by Ingredient Types, 2025-2035
  • Figure 222: Middle East and Africa Market Value (USD Million) by Country, 2025-2035
  • Figure 223: Middle East and Africa Market Value (USD Million) Analysis by Country, 2020-2035
  • Figure 224: Middle East and Africa Market Volume (Units) Analysis by Country, 2020-2035
  • Figure 225: Middle East and Africa Market Value Share (%) and BPS Analysis by Country, 2025-2035
  • Figure 226: Middle East and Africa Market Y-o-Y Growth (%) Projections by Country, 2025-2035
  • Figure 227: Middle East and Africa Market Value (USD Million) Analysis by Product Type, 2020-2035
  • Figure 228: Middle East and Africa Market Volume (Units) Analysis by Product Type, 2020-2035
  • Figure 229: Middle East and Africa Market Value Share (%) and BPS Analysis by Product Type, 2025-2035
  • Figure 230: Middle East and Africa Market Y-o-Y Growth (%) Projections by Product Type, 2025-2035
  • Figure 231: Middle East and Africa Market Value (USD Million) Analysis by Functional Claims, 2020-2035
  • Figure 232: Middle East and Africa Market Volume (Units) Analysis by Functional Claims, 2020-2035
  • Figure 233: Middle East and Africa Market Value Share (%) and BPS Analysis by Functional Claims, 2025-2035
  • Figure 234: Middle East and Africa Market Y-o-Y Growth (%) Projections by Functional Claims, 2025-2035
  • Figure 235: Middle East and Africa Market Value (USD Million) Analysis by Sales Channel, 2020-2035
  • Figure 236: Middle East and Africa Market Volume (Units) Analysis by Sales Channel, 2020-2035
  • Figure 237: Middle East and Africa Market Value Share (%) and BPS Analysis by Sales Channel, 2025-2035
  • Figure 238: Middle East and Africa Market Y-o-Y Growth (%) Projections by Sales Channel, 2025-2035
  • Figure 239: Middle East and Africa Market Value (USD Million) Analysis by End-User , 2020-2035
  • Figure 240: Middle East and Africa Market Volume (Units) Analysis by End-User , 2020-2035
  • Figure 241: Middle East and Africa Market Value Share (%) and BPS Analysis by End-User , 2025-2035
  • Figure 242: Middle East and Africa Market Y-o-Y Growth (%) Projections by End-User , 2025-2035
  • Figure 243: Middle East and Africa Market Value (USD Million) Analysis by Ingredient Types, 2020-2035
  • Figure 244: Middle East and Africa Market Volume (Units) Analysis by Ingredient Types, 2020-2035
  • Figure 245: Middle East and Africa Market Value Share (%) and BPS Analysis by Ingredient Types, 2025-2035
  • Figure 246: Middle East and Africa Market Y-o-Y Growth (%) Projections by Ingredient Types, 2025-2035
  • Figure 247: Middle East and Africa Market Attractiveness by Product Type, 2025-2035
  • Figure 248: Middle East and Africa Market Attractiveness by Functional Claims, 2025-2035
  • Figure 249: Middle East and Africa Market Attractiveness by Sales Channel, 2025-2035
  • Figure 250: Middle East and Africa Market Attractiveness by End-User , 2025-2035
  • Figure 251: Middle East and Africa Market Attractiveness by Ingredient Types, 2025-2035
  • Figure 252: Middle East and Africa Market Attractiveness by Country, 2025-2035

Frequently Asked Questions

How big is the Melamine Beauty Product Market in 2025?

The global Melamine Beauty Product Market is estimated to be valued at USD 218.7 million in 2025.

What will be the size of the Melamine Beauty Product Market in 2035?

The market size for the Melamine Beauty Product Market is projected to reach USD $684.5 million by 2035.

How much will be the Melamine Beauty Product Market growth between 2025 and 2035?

The Melamine Beauty Product Market is expected to grow at a CAGR of 12.1% between 2025 and 2035.

What are the key product types in the Melamine Beauty Product Market?

The key product types in the Melamine Beauty Product Market are facial skincare, color cosmetics, body lotions, and fragrances.

Which product segment will contribute a significant share in the Melamine Beauty Product Market in 2025?

In terms of product type, skincare is expected to command 43.6% share in the Melamine Beauty Product Market in 2025.

Explore Similar Insights

Future Market Insights

Melamine Beauty Product Market