

- Market Size (2026)
- USD 299.7 Mn
- Forecast (2036)
- USD 1026.4 Mn
- CAGR (2026 to 2036)
- 13.1%
How big is Microbial Carbon Inputs Market in 2026?
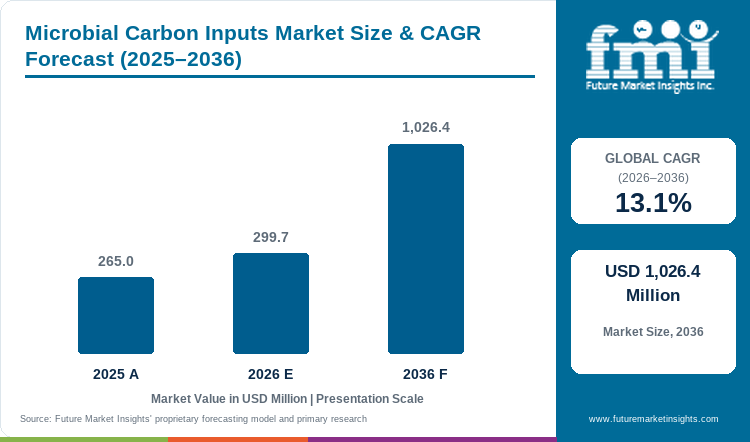
USD 299.7 million in 2026 and USD 1,026.4 million by 2036 at a 13.1% CAGR.
Sales of microbial carbon inputs are estimated to rise at 13.1% CAGR through 2036. Valuation rises from USD 265.0 million in 2025 to USD 299.7 million in 2026 and reaches USD 1,026.4 million by 2036. Growers compare nutrient costs with field results before extending treatment across more acres. In March 2025, USDA ERS reported fertilizer at 33% to 44% of corn operating costs since 2020. The agency also placed wheat fertilizer costs between 34% and 45% over the same period. Products must fit existing seed, soil, or foliar routines without adding work that weakens the expected per-acre return. Local trials need repeatable nutrient or root-zone results before farms commit to wider treatment.
Local farm systems and product rules determine the proof needed before regular orders begin. Large US row-crop areas give farms enough scale to test biofertilizer products under normal field conditions. Germany also requires farms to track nutrients through routine fertilizer planning and documented application records. In March 2026, the German Environment Agency reported a 40% fall in the five-year agricultural nitrogen surplus since 1994. The five-year average first reached the national target of 70 kg per hectare in 2023. UK soil policy and changing fertilizing-product rules shape how suppliers prepare evidence for commercial use. Japan and South Korea require local proof that matches established farm channels and practical handling conditions.
Key Takeaways
- High fertilizer costs give growers a direct reason to test microbial inputs against nutrient plans and per-acre returns.
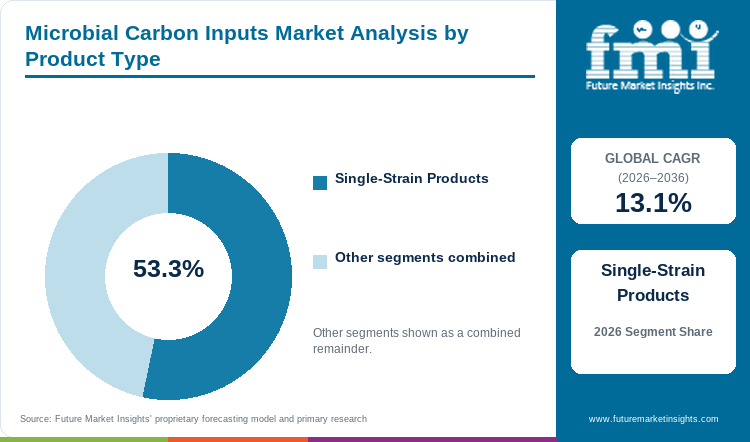
- Single-Strain Products are estimated to hold 53.3% of Product Type in 2026 because simpler strain identity supports easier quality checks.
- Cereals & Grains are expected to lead Crop Type with 39.9% share in 2026 as broad acreage keeps nutrient costs visible.
- Soil Application is forecast to represent 39.6% of Application Method in 2026, with root-zone placement helping microbes establish near crops.
- Uneven field results and changing product-claim rules can delay qualification before farms move into wider commercial use.
- Key participants include Groundwork BioAg, Locus Agricultural Solutions, Sound Agriculture, Rizobacter (Bioceres), Lallemand Plant Care, Indigo Ag, Kula Bio, and BASF.
Analyst Perspective
"Commercial adoption improves when microbial inputs fit normal storage and field routines while delivering a clear nutrient or root-zone benefit. Wider use depends on local trials showing that each organism produces repeatable results across crops, soils, and normal weather conditions."
- Nandini Roy Choudhury, Principal Consultant, Future Market Insights
How is the microbial carbon inputs market segmented?
The microbial carbon inputs market is segmented by Product Type, Crop Type, Application Method, Farm Type, Sales Channel, and Region.
Five primary axes organize demand before the regional split and separate the main commercial choices. Product Type covers Single-Strain Products, Multi-Strain Consortia, Microbe + Nutrient Combos, and Others. Crop Type includes Cereals & Grains, Fruits & Vegetables, Oilseeds & Pulses, Turf & Ornamentals, and Others. Application Method covers Soil Application, Foliar Application, Fertigation - Drip, Seed Application, and Others. Farm Type captures operating scale, while Sales Channel explains how products reach growers and receive local support.
What makes single-strain products central to the product type category?
Single-strain products use one known microbe for a defined crop function and production target. That clear identity makes production checks, storage rules, live-count testing, and field results easier to trace. EU fertilizing-product rules also list the microbes permitted in microbial plant biostimulants for regulated use. Product teams can compare one organism's live count and use rate against a clear specification. Multi-Strain Consortia combine several functions, while Microbe + Nutrient Combos place living inputs beside standard crop nutrients. Farms still need field data showing that either format performs reliably before it enters regular biostimulant programs.
- Single-Strain Products are set to lead Product Type with 53.3% share in 2026 as one-strain formats simplify checks and quality control.
- One organism gives manufacturers a consistent base for live-count tests, labeling, storage limits, and crop trials.
Why do cereals & grains hold the main crop type position?
Cereals & Grains cover large farm areas across major production systems, so small per-acre changes can move large budgets. Corn and wheat also carry high fertilizer costs within normal crop plans, increasing scrutiny of each added input. In March 2025, USDA ERS documented those fertilizer costs for both crops and showed their weight in operating budgets. New microbial products must fit planting equipment and current fertilizer plans before growers expand treatment across broad acres. Fruits & Vegetables support higher-value uses, while Oilseeds & Pulses already use inoculants within established nutrition programs. Broad-acre cereals can scale more easily when field results remain steady across different soils and larger farm areas.
- Cereals & Grains are forecast to represent 39.9% of Crop Type in 2026 as broad acreage keeps nutrient costs commercially important.
- Growers compare microbial treatments with crop micronutrients and fertilizer plans before expanding treatment across larger acreages.
How does soil application shape the application method category?
Soil Application places live microbes near crop roots during early growth, giving them direct contact with the active root zone. That contact can support microbial establishment and nutrient exchange during the period when crops build root systems. Phosphate-solubilizing bacteria, nitrogen-fixing organisms, and mycorrhizal fungi all depend on close root contact for their intended functions. Growers can use in-furrow tools, soil equipment, or granular formats to place these products near developing roots. Foliar Application can reduce field steps later in the crop cycle, but it follows a different contact route. Seed Application removes one field pass while adding storage and chemistry checks before planting. These choices also affect seed treatment materials because living organisms must remain viable through storage and application.
- Soil Application is projected to hold 39.6% share in 2026 because direct root placement helps microbes establish near the crop.
- In February 2025, Lallemand Plant Care introduced LALFIX START SPHERCIAL Pulses with Bacillus velezensis in a granular inoculant format.
What supports large commercial farms within the farm type category?
Large Commercial Farms test inputs across many acres and compare per-acre costs with field results before wider adoption. Existing fertilizer plans give these farms a clear baseline for measuring savings or changes in crop yield. Extra handling can erase small per-acre gains once the same program expands across larger field areas. Mid-Size Farms often rely on dealer guidance before they extend a new biological program across more acres. Smallholders face tighter pack-size and upfront-cash limits, while Greenhouses & Nurseries operate under different crop values and controls. Farms also compare microbial seed treatments with other crop inputs before adding another step to routine production.
- Large Commercial Farms are likely to capture 44.5% share in 2026 because their acreage supports structured trials across representative fields.
- Large acreage helps farms move proven plans from trial plots into routine use once local results and clear application steps remain consistent.
What drives agri-input distributors within the sales channel category?
Agri-Input Distributors connect product claims with local farm use and explain how each biological input fits existing programs. Storage, mixing, and application choices affect how many live microbes remain viable before they reach the crop. Seed compatibility and application timing also influence product performance under local field conditions. Distributors translate technical claims into practical guidance on soil conditions, timing, and existing nutrient plans. Cooperatives offer similar support through established grower relationships, while retail and Direct-to-Farm routes improve with product familiarity. Distributors also advise on agricultural adjuvants because application choices can change microbial performance in the field.
- Agri-Input Distributors are set to lead Sales Channel with 50.0% share in 2026 as local guidance helps reduce application errors.
- In January 2025, Locus Agriculture reported that US row-crop channels were preparing foliar and inoculant programs plus box-applied biological programs.
What are the drivers, restraints and opportunities in the Microbial Carbon Inputs Market?
Fertilizer cost exposure supports nutrient-efficiency demand, variable field response slows qualification, and shelf-stable formats can widen practical use.
- Driver: High fertilizer costs make nutrient efficiency a direct budget concern and give growers a clear reason to test microbial products.
- Restraint: Uneven field results and changing product-claim rules increase the proof farms and distributors need before regular commercial use.
- Opportunity: Shelf-stable formulas can reduce cold-storage needs and simplify shipping, dealer inventory, and routine field application.
Farm input costs make nutrient efficiency a direct budget issue for growers evaluating new biological products. In March 2025, USDA ERS reported fertilizer at up to 44% of corn operating costs and up to 45% for wheat. Those costs give farms a clear reason to compare microbial products with current nitrogen and phosphorus plans. Each product must show a repeatable per-acre benefit without creating yield risk or costly extra field work. Farm advisers compare trial results with existing nutrient programs before recommending treatment across larger acreages. Some programs combine standard fertilizer with organic and living inputs to manage cost and performance. Regular use grows when local field results remain consistent enough to support the same value case across seasons.
Field qualification becomes harder when product results change across crops, soils, weather, or application methods. In March 2026, Defra reported mixed evidence for plant biostimulants and identified gaps in proof of improved nutrient use. Those evidence gaps raise the standard farms and distributors apply before moving from local trials into regular programs. Product claims must also match the rules governing each intended use and the evidence allowed for that claim. Dealers need local field data that represents normal crop conditions before recommending repeat purchases. The same requirement applies to plant microbiome protectants that depend on consistent field performance. Broader trials and clearer rules can simplify screening, but variable results continue to slow qualification across routine farm conditions.
Better product forms can remove handling problems that occur before microbial inputs ever reach the field. In February 2026, Kula Bio launched dry powders for root-zone nitrogen-fixing bacteria that remove cold-storage needs and extend shelf life. Dealers can carry these products with fewer cold-chain controls and simpler inventory procedures across local distribution networks. Microbe + Nutrient Combos offer another route by placing living inputs beside standard nutrient products during routine application. That format can reduce separate mixing steps and limit extra field work for farm teams. Similar storage requirements affect biopesticide probiotics because live microbes must remain viable through transport and warehouse handling. Shelf-stable formats can widen sales routes while making regular farm use easier to manage.
Which country CAGRs are profiled in the Microbial Carbon Inputs Market?
| Country | CAGR |
|---|---|
| USA | 12.7% |
| South Korea | 12.4% |
| Germany | 12.1% |
| UK | 11.8% |
| Japan | 10.9% |
How do country-level CAGRs compare in the Microbial Carbon Inputs Market?
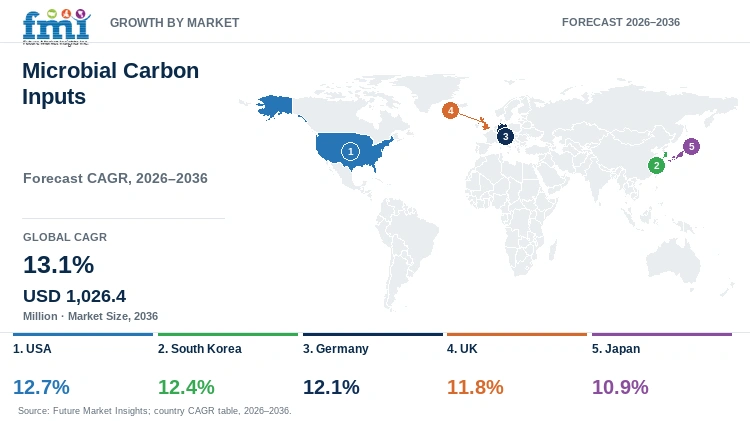
The CAGRs differ by 1.8 percentage points over the forecast period. Each country follows a distinct adoption path shaped by its farm structure and local product requirements. Farm scale and policy explain part of the spread, while registration rules affect commercial qualification. Channel support then influences how quickly successful trials move into repeat purchases.
- Large US row-crop acreage enables broad field trials, but farms still compare nutrient savings with yield response before expanding microbial inputs.
- South Korea's low-carbon farm programs create structured testing opportunities for microbial products that can show measured benefits without complicating routine field work.
- Germany's nutrient-planning rules favor clear strain controls, local field evidence, and application steps that fit existing fertilizer plans.
- UK soil programs encourage farm trials, while changing fertilizing-product rules increase the evidence distributors need before recommending regular commercial use.
- Japan's fertilizer-reduction policy increases interest in microbial inputs, but local channels still require crop-specific proof and simple handling instructions.
Similar CAGRs do not create identical market-entry conditions across the five profiled countries. Crop scale, registration rules, and farm channels shape how quickly trials move into repeat purchasing. These differences matter because the same microbial product can face a different proof burden in each national market. The full report provides country-level CAGR analysis across North America, Latin America, Western Europe, Eastern Europe, East Asia, South Asia and Pacific, and the Middle East and Africa.
Country-wise Analysis
- US row-crop farms test microbial inputs against established fertilizer plans across large commercial acreages. Sector in US is projected to rise at 12.7% CAGR through 2036 as high nutrient costs keep potential savings under close review. In March 2025, USDA ERS reported fertilizer at 33% to 44% of corn operating costs and 34% to 45% for wheat. Soil and weather differences can widen the gap between trial results and performance across full fields. Product teams need independent data that matches standard equipment and representative farm conditions. Large farms also compare biorational pesticides with microbial tools when reviewing crop protection and fertility plans. Regular use expands when field performance supports a clear economic return across many acres.
- South Korea supports low-input and low-carbon farming through national programs that reward measured changes in farm practice. Sales are forecast to rise at 12.4% CAGR through 2036, supported by structured programs that give farms clear testing routes. In March 2025, the Ministry of Agriculture reported about 12,300 farms selected for the low-carbon crop program. The first-half intake covered water management and biochar work, showing how national programs organize measured farm interventions. Microbial crop inputs still need farm-level proof because returns can vary across crops and production systems. Cooperative trials help local channels demonstrate results before regular orders begin. Shelf-stable formats and clear use steps can reduce storage and training burdens during wider adoption.
- Germany links microbial crop inputs with formal nutrient planning under national and EU fertilizing-product rules. Demand is projected to rise at 12.1% CAGR through 2036, shaped by strict nutrient management and documented fertilizer planning. In March 2026, the German Environment Agency reported a 40% fall in the five-year agricultural nitrogen surplus since 1994. The five-year average first reached 70 kg per hectare in 2023, giving farms a clear benchmark for nutrient control. Microbial products must show value against nutrient plans that farms already record and review. Approved strains and local field results matter before biological products enter routine fertility programs. Simple application steps can reduce extra work and improve the fit with existing farm procedures.
- UK growers connect microbial crop inputs with soil programs and routine nutrient planning across commercial farms. Industry is forecast to expand at 11.8% CAGR through 2036 as national soil actions create a structured base for field trials. In February 2025, Defra reported 3.27 million hectares under Sustainable Farming Incentive soil actions. Defra also said in March 2026 that it was reviewing fertilizing-product rules, which can affect product claims and launch planning. Local farm data must support each claim before distributors recommend wider commercial use. Farm teams also need storage and application guidance that fits routine field work. Repeat purchasing improves when products deliver consistent results without adding avoidable operating steps.
- Japan connects microbial crop inputs with long-term resource use and national fertilizer-reduction policy. Demand is estimated to post 10.9% CAGR through 2036, influenced by policy that encourages lower chemical fertilizer use. In June 2026, Japan's Ministry of Agriculture confirmed MIDORI BOOST guidance for green farm practices through 2030. The wider MIDORI strategy targets a 30% reduction in chemical fertilizer use by 2050. Local channels still need crop-specific proof before new microbial products enter regular orders. Simple formulas and clear instructions reduce work during product checks and make storage requirements easier to manage. Steady field results remain essential because dealers must justify repeat use across local crops and normal farm conditions.
Who are the notable companies in the Microbial Carbon Inputs Market?
Groundwork BioAg, Locus Agricultural Solutions, Sound Agriculture, Rizobacter (Bioceres), Lallemand Plant Care, Indigo Ag, Kula Bio, and BASF are active within the defined microbial carbon inputs boundary.
Competition depends on the farm problem each company addresses and the field proof supporting repeat use across crop programs. Groundwork BioAg, Sound Agriculture, and Kula Bio emphasize nutrient, root-zone, or carbon functions through different microbial approaches. Locus Agricultural Solutions, Rizobacter, and Lallemand Plant Care focus more heavily on inoculant and rhizosphere routes. Indigo Ag and BASF use established channels, while farms compare agricultural microbials by strain control, formulation stability, crop fit, and handling needs.
- Carbon and nutrient specialists: Groundwork BioAg, Sound Agriculture, and Kula Bio focus on mycorrhizal, microbiome, nitrogen, or carbon work.
- Inoculant and root-zone providers: Locus Agricultural Solutions, Rizobacter (Bioceres), and Lallemand Plant Care focus on live products that work near crop roots.
- Scaled biological portfolios: Indigo Ag and BASF connect microbial products with established seed, crop-protection, and field-use systems.
Competitive Benchmarking: Microbial Carbon Inputs Market
| Company | Strain & Formulation Depth | Nutrient / Rhizosphere Function | Application & Channel Integration | Geographic Reach |
|---|---|---|---|---|
| Groundwork BioAg | Medium | High | High | United States, Latin America, Europe, and selected international markets |
| Locus Agricultural Solutions | High | High | High | United States |
| Sound Agriculture | Medium | High | Medium | United States and Argentina |
| Rizobacter (Bioceres) | High | High | High | Americas with international inoculant activity |
| Lallemand Plant Care | Medium | High | Medium | North America and other international markets |
| Indigo Ag | Medium | Medium | High | United States |
| Kula Bio | Medium | High | Medium | United States |
| BASF | Medium | Medium | High | Global agricultural markets |
The benchmark uses High, Medium, and Low labels to compare the public evidence available for each measured capability. High indicates broad public proof across the relevant function or operating area, while Medium indicates solid but narrower evidence. Low identifies a clear limitation in the public evidence available for that specific measure. Geographic Reach describes each company's operating footprint and remains separate from the scored capability measures.
Key Developments in the Microbial Carbon Inputs Market
- Groundwork BioAg partnered with Syngenta in July 2026 on mycorrhizal products and soil-carbon solutions across several crop markets.
- BASF received French registration in November 2025 for Integral Pro sunflower biological seed treatment ahead of planned 2026 EU availability.
- Locus Agriculture released foliar, inoculant, and box-applied programs in January 2025 for major US row crops, backed by third-party field trials.
Key Players in the Microbial Carbon Inputs Market
Carbon and nutrient microbial specialists
- Groundwork BioAg
- Sound Agriculture
- Kula Bio
Inoculant and rhizosphere platform providers
- Locus Agricultural Solutions
- Rizobacter (Bioceres)
- Lallemand Plant Care
Scaled biological portfolio providers
- Indigo Ag
- BASF
Microbial Carbon Inputs Market - Report Scope
| Coverage field | Report scope |
|---|---|
| Market breakdown | By product type, crop type, application method, farm type, sales channel, and region. |
| Quantitative Units | USD million. |
| Market Definition | Commercial microbial crop inputs sold as beneficial bacteria, fungi, strain consortia, or microbe + nutrient formulations for nutrient cycling, root-zone, soil-biological, plant-health, or carbon-related outcomes are included. Downstream crop revenue, carbon-credit revenue, synthetic fertilizers, and standalone non-microbial substitutes are excluded. |
| Regions Covered | North America, Latin America, Western Europe, Eastern Europe, East Asia, South Asia and Pacific, and Middle East and Africa. |
| Countries Covered | USA, South Korea, Germany, UK, Japan, and 20+ countries included in the full report. |
| Key Companies Profiled | Groundwork BioAg, Locus Agricultural Solutions, Sound Agriculture, Rizobacter (Bioceres), Lallemand Plant Care, Indigo Ag, Kula Bio, BASF. |
| Forecast Period | 2026 to 2036. |
| Approach | Primary and secondary research with market triangulation. |
Microbial Carbon Inputs Market - Research Methodology
| Method | Approach |
|---|---|
| Primary Research | FMI analysts gathered input from manufacturers, service providers, technology developers, distributors, end users, procurement teams, and subject-matter experts. Interviews examined purchasing decisions, product or service evaluation, adoption barriers, approval requirements, pricing considerations, and expectations for technical or commercial support. Respondents were also asked what evidence is required before a trial, pilot, or initial order develops into regular purchasing. |
| Desk Research | Desk research covered government statistics, regulatory publications, trade data, industry associations, technical literature, standards, company filings, product information, and official corporate announcements. Sources were reviewed for relevance, publication date, geographic coverage, and consistency with the defined market scope. Claims relating to performance, applications, approvals, capacity, investment, and commercial activity were retained only when supported by credible public evidence. |
| Market Sizing and Forecasting | The market model combined the baseline value with historical performance, segment structure, pricing and volume indicators, adoption levels, company participation, and country-level demand conditions. Forecast assumptions considered economic activity, investment trends, regulatory developments, technology adoption, purchasing cycles, supply availability, and barriers to wider market use. Segment and regional estimates were reconciled before the final market total was calculated. |
| Data Validation | Estimates were checked against multiple independent indicators, including public data, company activity, trade patterns, industry developments, and findings from primary interviews. Validation also tested whether products, services, applications, and company revenues fell within the defined market boundaries. Adjacent categories, unsupported claims, overlapping revenues, and activities without direct market relevance were excluded to reduce double counting and maintain consistency across segments and countries. |
Microbial Carbon Inputs Market by Segments
Microbial Carbon Inputs Market segmented by Product Type:
- Single-Strain Products
- Multi-Strain Consortia
- Microbe + Nutrient Combos
- Others
Microbial Carbon Inputs Market segmented by Crop Type:
- Cereals & Grains
- Fruits & Vegetables
- Oilseeds & Pulses
- Turf & Ornamentals
- Others
Microbial Carbon Inputs Market segmented by Application Method:
- Soil Application
- Foliar Application
- Fertigation - Drip
- Seed Application
- Others
Microbial Carbon Inputs Market segmented by Farm Type:
- Large Commercial Farms
- Mid-Size Farms
- Smallholders
- Greenhouses & Nurseries
- Others
Microbial Carbon Inputs Market segmented by Sales Channel:
- Agri-Input Distributors
- Cooperatives
- Agri-Retail Chains
- Online - Direct-to-Farm
- Others
Microbial Carbon Inputs Market by Region:
- North America
- United States
- Canada
- Latin America
- Brazil
- Mexico
- Chile
- Rest of Latin America
- Western Europe
- Germany
- United Kingdom
- Italy
- Spain
- France
- Nordics
- Benelux
- Rest of Western Europe
- Eastern Europe
- Russia
- Poland
- Hungary
- Balkan and Baltic States
- Rest of Eastern Europe
- East Asia
- China
- Japan
- South Korea
- South Asia and Pacific
- India
- ASEAN
- Australia and New Zealand
- Rest of South Asia and Pacific
- Middle East and Africa
- Kingdom of Saudi Arabia
- Other GCC Countries
- Türkiye
- South Africa
- Other African Union Countries
- Rest of Middle East and Africa
Research Sources and Bibliography
- U.S. Department of Agriculture, Economic Research Service. (2025, March 27). Fertilizer prices stable at onset of 2025 planting season, below highs of 2021 and 2022.
- Department for Environment, Food & Rural Affairs. (2025, February 20). Sustainable Farming Incentive action uptake data, January 2025.
- Department for Environment, Food & Rural Affairs. (2026, March 19). Marketing fertilizing products in the UK: Regulatory reform.
- German Environment Agency. (2026, March 5). Indicator: Agricultural nitrogen surplus.
- Ministry of Agriculture, Forestry and Fisheries of Japan. (2026, June 25). MIDORI Food System Strategy and MIDORI BOOST.
- Ministry of Agriculture, Food and Rural Affairs, Republic of Korea. (2025, March 19). Selection completed for farmers participating in the 2025 low-carbon agriculture crop program.
- European Union. (2024, July 3). Consolidated text: Regulation (EU) 2019/1009 on EU fertilizing products.
- Groundwork BioAg. (2026, July 14). Syngenta and Groundwork BioAg enter partnership to bring innovation in biologicals and soil carbon solutions to farmers.
- Locus Agriculture. (2025, January 21). Experts predict higher 2025 row crop yields with newly released biologicals.
- Lallemand Plant Care. (2025, February 11). Inoculant innovation to power your pulses.
- Kula Bio. (2026, February 2). Kula Bio launches soluble powder line of its nitrogen-fixing biological products.
- BASF. (2025, November 20). BASF announces Integral Pro for sunflowers is registered in France.
- Groundwork BioAg. (2025, September 22). Groundwork BioAg and Anew Climate announce collaboration to commercialize durable soil carbon removal credits.
- Locus Fermentation Solutions. (2025, December 10). Locus FS secures strategic investment to accelerate biomanufacturing and bio-based additive growth.
- Rizobacter. (2026, March 11). Rizobacter and Bidcom Agro partner to advance agricultural drone applications.
- Indigo Agriculture. (2025, October 7). Indigo Ag introduces biotrinsic Nemora FP.
This bibliography gives the main sources used in the article. The full report contains the complete reference list and detailed citations.
This Report Answers
- How large is the microbial carbon inputs market in 2026 and 2036?
- Which fertilizer and nutrient-efficiency pressures support recurring demand for microbial crop inputs?
- Why do Single-Strain Products hold 53.3% of Product Type in 2026?
- Why do Cereals & Grains hold 39.9% of Crop Type in 2026?
- Why does Soil Application hold 39.6% of Application Method in 2026?
- How do the five profiled country CAGRs differ through 2036?
- Which field-performance and regulatory conditions can delay regular commercial purchasing?
- Which companies participate across microbial nutrient, inoculant and rhizosphere platforms?
- What should growers and distributors check before expanding microbial products beyond trials?
Frequently Asked Questions
How big is the microbial carbon inputs market in 2026?
The market is valued at USD 299.7 million in 2026 and projected to reach USD 1,026.4 million by 2036. High fertilizer costs encourage farm trials, while growers also test whether microbial inputs improve nutrient use during routine field work.
What is the CAGR of the microbial carbon inputs market from 2026 to 2036?
The market is projected to grow at 13.1% CAGR from 2026 through 2036. Farms expand routine use when root-zone and nutrient-use gains remain consistent through storage, handling, and normal field conditions.
Which product type leads the microbial carbon inputs market in 2026?
Single-Strain Products are projected to hold 53.3% of Product Type revenue in 2026. One known strain simplifies production checks, storage rules, and field trials before farms extend treatment across more acres.
Which crop type leads the microbial carbon inputs market in 2026?
Cereals & Grains are estimated to hold 39.9% of Crop Type demand in 2026. Large acreages keep nutrient costs and per-acre returns central, so growers expand treatment when results remain steady across fields.
Which application method leads the microbial carbon inputs market in 2026?
Soil Application is forecast to represent 39.6% of Application Method demand in 2026. Root-zone placement puts living microbes close to developing crops and works with equipment farms already use for soil application.
Which countries are projected to record the highest growth in the microbial carbon inputs market?
The USA is projected to post 12.7% CAGR through 2036, followed by South Korea at 12.4% and Germany at 12.1%. Farm scale, policy, product rules, and local proof requirements create different adoption paths across these countries.
Which companies are active in the microbial carbon inputs market?
Key companies include Groundwork BioAg, Locus Agricultural Solutions, Sound Agriculture, Rizobacter (Bioceres), Lallemand Plant Care, Indigo Ag, Kula Bio, and BASF. Their microbial routes vary by farm problem, crop fit, sales channel, and the field proof required for regular use.
What limits return on investment in the microbial carbon inputs market?
Return on investment falls when storage loss, poor timing, crop-input conflicts, or extra handling weaken expected performance. Farms need steady field results and clear use steps before wider treatment protects the value promised by each product claim.
What is driving growth in the Microbial Carbon Inputs Market?
High fertilizer costs and nutrient-efficiency goals place microbial products into routine crop-input reviews. Demand grows when products help roots use nutrients without costly field steps and maintain results across normal soil and weather conditions.
What is a notable restraint in the Microbial Carbon Inputs Market?
Field results can change across crops, soils, weather, product quality, and use choices. Growers need local proof that products remain viable through storage and field handling while delivering a steady economic result.
Why should executives continue tracking the Microbial Carbon Inputs Market?
The market links fertilizer costs with microbial product choices, field proof requirements, and changing soil rules. Executives track which products deliver repeatable value and fit routine programs without adding difficult operating steps.
What business problem does the Microbial Carbon Inputs Market address?
Microbial carbon inputs help farms use nutrients better while supporting crop roots during routine production. Some products also reduce reliance on costly standard inputs or connect crop results with soil-health and carbon goals, provided gains remain consistent.
What should agricultural input procurement teams evaluate in the Microbial Carbon Inputs Market?
Procurement teams should compare organism identity, live count, shelf life, use limits, and crop-specific field data before purchase. Dealer support and handling steps must also fit existing fertilizer or seed-treatment routines.
What supports long-term commercial confidence in the Microbial Carbon Inputs Market?
Long-term confidence grows when farms improve fertilizer use without complex storage or handling requirements. Clear rules, broader field data, and shelf-stable formats make product checks easier and support repeat purchasing across local programs.
Preview the report firsthand - request a free sample
Get SampleGet the brochure for pricing and purchase details.
Get PDFTable of Content
- Key Takeaways
- Market Size and CAGR
- Top Growth Driver
- Fastest Growing Segment
- Leading Region
- Key Companies
- Emerging Opportunities
- Executive Summary
- Global Market Outlook
- Demand-side Trends
- Supply-side Trends
- Technology Roadmap Analysis
- Analysis and Recommendations
- Analyst Perspective (What is happening? Why now? What should investors know?)
- Key Questions Answered
- How large is the market?
- What is the CAGR?
- What are key trends?
- Which region dominates?
- Who are the leaders?
- Market Overview
- Market Coverage / Taxonomy
- Market Definition / Scope / Limitations
- Research Methodology
- Chapter Orientation
- Analytical Lens and Working Hypotheses
- Market Structure, Signals, and Trend Drivers
- Benchmarking and Cross-market Comparability
- Market Sizing, Forecasting, and Opportunity Mapping
- Research Design and Evidence Framework
- Desk Research Programme (Secondary Evidence)
- Expert Input and Fieldwork (Primary Evidence)
- Tooling, Models, and Reference Databases
- Data Engineering and Model Build
- Quality Assurance and Audit Trail
- Market Background
- Market Dynamics (Drivers, Restraints, Opportunity, Trends)
- Scenario Forecast (Optimistic, Likely, Conservative)
- Impact Analysis
- AI Impact
- Sustainability Impact
- Regulatory Impact
- Technology Impact
- Consumer / Buyer Analysis
- Purchase Drivers
- Adoption Barriers
- Buyer Journey
- Opportunity Map Analysis
- Product Life Cycle Analysis
- Supply Chain Analysis
- Investment Feasibility Matrix
- Value Chain Analysis
- PESTLE and Porter's Analysis
- Regulatory Landscape
- Regional Parent Market Outlook
- Production and Consumption Statistics
- Import and Export Statistics
- Global Market Analysis and Forecast, 2021 to 2036
- Historical Market Size Value (USD Million) Analysis, 2021 to 2025
- Current and Future Market Size Value (USD Million) Projections, 2026 to 2036
- Y-o-Y Growth Trend Analysis
- Absolute $ Opportunity Analysis
- Global Market Pricing Analysis, 2021 to 2036
- Global Market Analysis and Forecast, By Product Type, 2021 to 2036
- Introduction / Key Findings
- Historical Market Size Value (USD Million) Analysis By Product Type, 2021 to 2025
- Current and Future Market Size Value (USD Million) Analysis and Forecast By Product Type, 2026 to 2036
- Single-Strain Products
- Multi-Strain Consortia
- Microbe + Nutrient Combos
- Others
- Y-o-Y Growth Trend Analysis By Product Type, 2021 to 2025
- Absolute $ Opportunity Analysis By Product Type, 2026 to 2036
- Global Market Analysis and Forecast, By Crop Type, 2021 to 2036
- Introduction / Key Findings
- Historical Market Size Value (USD Million) Analysis By Crop Type, 2021 to 2025
- Current and Future Market Size Value (USD Million) Analysis and Forecast By Crop Type, 2026 to 2036
- Cereals & Grains
- Fruits & Vegetables
- Oilseeds & Pulses
- Turf & Ornamentals
- Others
- Y-o-Y Growth Trend Analysis By Crop Type, 2021 to 2025
- Absolute $ Opportunity Analysis By Crop Type, 2026 to 2036
- Global Market Analysis and Forecast, By Application Method, 2021 to 2036
- Introduction / Key Findings
- Historical Market Size Value (USD Million) Analysis By Application Method, 2021 to 2025
- Current and Future Market Size Value (USD Million) Analysis and Forecast By Application Method, 2026 to 2036
- Soil Application
- Foliar Application
- Fertigation - Drip
- Seed Application
- Others
- Y-o-Y Growth Trend Analysis By Application Method, 2021 to 2025
- Absolute $ Opportunity Analysis By Application Method, 2026 to 2036
- Global Market Analysis and Forecast, By Farm Type, 2021 to 2036
- Introduction / Key Findings
- Historical Market Size Value (USD Million) Analysis By Farm Type, 2021 to 2025
- Current and Future Market Size Value (USD Million) Analysis and Forecast By Farm Type, 2026 to 2036
- Large Commercial Farms
- Mid-Size Farms
- Smallholders
- Greenhouses & Nurseries
- Others
- Y-o-Y Growth Trend Analysis By Farm Type, 2021 to 2025
- Absolute $ Opportunity Analysis By Farm Type, 2026 to 2036
- Global Market Analysis and Forecast, By Sales Channel, 2021 to 2036
- Introduction / Key Findings
- Historical Market Size Value (USD Million) Analysis By Sales Channel, 2021 to 2025
- Current and Future Market Size Value (USD Million) Analysis and Forecast By Sales Channel, 2026 to 2036
- Agri-Input Distributors
- Cooperatives
- Agri-Retail Chains
- Online - Direct-to-Farm
- Others
- Y-o-Y Growth Trend Analysis By Sales Channel, 2021 to 2025
- Absolute $ Opportunity Analysis By Sales Channel, 2026 to 2036
- Global Market Analysis and Forecast, By Region, 2021 to 2036
- Introduction
- Historical Market Size Value (USD Million) Analysis By Region, 2021 to 2025
- Current Market Size Value (USD Million) Analysis and Forecast By Region, 2026 to 2036
- North America
- Latin America
- Western Europe
- Eastern Europe
- East Asia
- South Asia and Pacific
- Middle East and Africa
- Market Attractiveness Analysis By Region
- North America Market Analysis and Forecast, By Country, 2021 to 2036
- Historical Market Size Value (USD Million) Trend Analysis By Market Taxonomy, 2021 to 2025
- Market Size Value (USD Million) Forecast By Market Taxonomy, 2026 to 2036
- By Country
- United States
- Canada
- By Product Type
- By Crop Type
- By Application Method
- By Farm Type
- By Sales Channel
- By Country
- Market Attractiveness Analysis
- By Country
- By Product Type
- By Crop Type
- By Application Method
- By Farm Type
- By Sales Channel
- Key Takeaways
- Latin America Market Analysis and Forecast, By Country
- Historical Market Size Value (USD Million) Trend Analysis By Market Taxonomy, 2021 to 2025
- Market Size Value (USD Million) Forecast By Market Taxonomy, 2026 to 2036
- By Country
- Brazil
- Mexico
- Chile
- Rest of Latin America
- By Product Type
- By Crop Type
- By Application Method
- By Farm Type
- By Sales Channel
- By Country
- Market Attractiveness Analysis
- By Country
- By Product Type
- By Crop Type
- By Application Method
- By Farm Type
- By Sales Channel
- Key Takeaways
- Western Europe Market Analysis and Forecast, By Country
- Historical Market Size Value (USD Million) Trend Analysis By Market Taxonomy, 2021 to 2025
- Market Size Value (USD Million) Forecast By Market Taxonomy, 2026 to 2036
- By Country
- Germany
- United Kingdom
- Italy
- Spain
- France
- Nordics
- Benelux
- Rest of Western Europe
- By Product Type
- By Crop Type
- By Application Method
- By Farm Type
- By Sales Channel
- By Country
- Market Attractiveness Analysis
- By Country
- By Product Type
- By Crop Type
- By Application Method
- By Farm Type
- By Sales Channel
- Key Takeaways
- Eastern Europe Market Analysis and Forecast, By Country
- Historical Market Size Value (USD Million) Trend Analysis By Market Taxonomy, 2021 to 2025
- Market Size Value (USD Million) Forecast By Market Taxonomy, 2026 to 2036
- By Country
- Russia
- Poland
- Hungary
- Balkan and Baltic States
- Rest of Eastern Europe
- By Product Type
- By Crop Type
- By Application Method
- By Farm Type
- By Sales Channel
- By Country
- Market Attractiveness Analysis
- By Country
- By Product Type
- By Crop Type
- By Application Method
- By Farm Type
- By Sales Channel
- Key Takeaways
- East Asia Market Analysis and Forecast, By Country
- Historical Market Size Value (USD Million) Trend Analysis By Market Taxonomy, 2021 to 2025
- Market Size Value (USD Million) Forecast By Market Taxonomy, 2026 to 2036
- By Country
- China
- Japan
- South Korea
- By Product Type
- By Crop Type
- By Application Method
- By Farm Type
- By Sales Channel
- By Country
- Market Attractiveness Analysis
- By Country
- By Product Type
- By Crop Type
- By Application Method
- By Farm Type
- By Sales Channel
- Key Takeaways
- South Asia and Pacific Market Analysis and Forecast, By Country
- Historical Market Size Value (USD Million) Trend Analysis By Market Taxonomy, 2021 to 2025
- Market Size Value (USD Million) Forecast By Market Taxonomy, 2026 to 2036
- By Country
- India
- ASEAN
- Australia and New Zealand
- Rest of South Asia and Pacific
- By Product Type
- By Crop Type
- By Application Method
- By Farm Type
- By Sales Channel
- By Country
- Market Attractiveness Analysis
- By Country
- By Product Type
- By Crop Type
- By Application Method
- By Farm Type
- By Sales Channel
- Key Takeaways
- Middle East and Africa Market Analysis and Forecast, By Country
- Historical Market Size Value (USD Million) Trend Analysis By Market Taxonomy, 2021 to 2025
- Market Size Value (USD Million) Forecast By Market Taxonomy, 2026 to 2036
- By Country
- Kingdom of Saudi Arabia
- Other GCC Countries
- Türkiye
- South Africa
- Other African Union Countries
- Rest of Middle East and Africa
- By Product Type
- By Crop Type
- By Application Method
- By Farm Type
- By Sales Channel
- By Country
- Market Attractiveness Analysis
- By Country
- By Product Type
- By Crop Type
- By Application Method
- By Farm Type
- By Sales Channel
- Key Takeaways
- Key Countries Market Analysis
- United States
- Pricing Analysis
- Market Share Analysis, 2025
- By Product Type
- By Crop Type
- By Application Method
- By Farm Type
- By Sales Channel
- Canada
- Pricing Analysis
- Market Share Analysis, 2025
- By Product Type
- By Crop Type
- By Application Method
- By Farm Type
- By Sales Channel
- Mexico
- Pricing Analysis
- Market Share Analysis, 2025
- By Product Type
- By Crop Type
- By Application Method
- By Farm Type
- By Sales Channel
- Brazil
- Pricing Analysis
- Market Share Analysis, 2025
- By Product Type
- By Crop Type
- By Application Method
- By Farm Type
- By Sales Channel
- Chile
- Pricing Analysis
- Market Share Analysis, 2025
- By Product Type
- By Crop Type
- By Application Method
- By Farm Type
- By Sales Channel
- Germany
- Pricing Analysis
- Market Share Analysis, 2025
- By Product Type
- By Crop Type
- By Application Method
- By Farm Type
- By Sales Channel
- United Kingdom
- Pricing Analysis
- Market Share Analysis, 2025
- By Product Type
- By Crop Type
- By Application Method
- By Farm Type
- By Sales Channel
- Italy
- Pricing Analysis
- Market Share Analysis, 2025
- By Product Type
- By Crop Type
- By Application Method
- By Farm Type
- By Sales Channel
- Spain
- Pricing Analysis
- Market Share Analysis, 2025
- By Product Type
- By Crop Type
- By Application Method
- By Farm Type
- By Sales Channel
- France
- Pricing Analysis
- Market Share Analysis, 2025
- By Product Type
- By Crop Type
- By Application Method
- By Farm Type
- By Sales Channel
- India
- Pricing Analysis
- Market Share Analysis, 2025
- By Product Type
- By Crop Type
- By Application Method
- By Farm Type
- By Sales Channel
- ASEAN
- Pricing Analysis
- Market Share Analysis, 2025
- By Product Type
- By Crop Type
- By Application Method
- By Farm Type
- By Sales Channel
- Australia and New Zealand
- Pricing Analysis
- Market Share Analysis, 2025
- By Product Type
- By Crop Type
- By Application Method
- By Farm Type
- By Sales Channel
- China
- Pricing Analysis
- Market Share Analysis, 2025
- By Product Type
- By Crop Type
- By Application Method
- By Farm Type
- By Sales Channel
- Japan
- Pricing Analysis
- Market Share Analysis, 2025
- By Product Type
- By Crop Type
- By Application Method
- By Farm Type
- By Sales Channel
- South Korea
- Pricing Analysis
- Market Share Analysis, 2025
- By Product Type
- By Crop Type
- By Application Method
- By Farm Type
- By Sales Channel
- Russia
- Pricing Analysis
- Market Share Analysis, 2025
- By Product Type
- By Crop Type
- By Application Method
- By Farm Type
- By Sales Channel
- Poland
- Pricing Analysis
- Market Share Analysis, 2025
- By Product Type
- By Crop Type
- By Application Method
- By Farm Type
- By Sales Channel
- Hungary
- Pricing Analysis
- Market Share Analysis, 2025
- By Product Type
- By Crop Type
- By Application Method
- By Farm Type
- By Sales Channel
- Kingdom of Saudi Arabia
- Pricing Analysis
- Market Share Analysis, 2025
- By Product Type
- By Crop Type
- By Application Method
- By Farm Type
- By Sales Channel
- Türkiye
- Pricing Analysis
- Market Share Analysis, 2025
- By Product Type
- By Crop Type
- By Application Method
- By Farm Type
- By Sales Channel
- South Africa
- Pricing Analysis
- Market Share Analysis, 2025
- By Product Type
- By Crop Type
- By Application Method
- By Farm Type
- By Sales Channel
- United States
- Market Structure Analysis
- Competition Dashboard
- Competition Benchmarking
- Market Share Analysis of Top Players
- By Regional
- By Product Type
- By Crop Type
- By Application Method
- By Farm Type
- By Sales Channel
- Emerging Startups
- Innovation Benchmarking
- Competition Analysis
- Competition Deep Dive
- Groundwork BioAg
- Overview
- Product Portfolio
- Profitability by Market Segments
- Sales Footprint
- Strategy Overview
- Marketing Strategy
- Product Strategy
- Channel Strategy
- Locus Agricultural Solutions
- Sound Agriculture
- Rizobacter (Bioceres)
- Lallemand Plant Care
- Indigo Ag
- Kula Bio
- BASF
- Groundwork BioAg
- Case Studies
- Success Stories
- Recent Developments
- Competition Deep Dive
- Assumptions & Acronyms Used


