
- Market Size (2026)
- USD 363.7 Mn
- Forecast (2036)
- USD 1005.0 Mn
- CAGR (2026 to 2036)
- 10.7%
How Big Is the Moringa Juice Market in 2026?
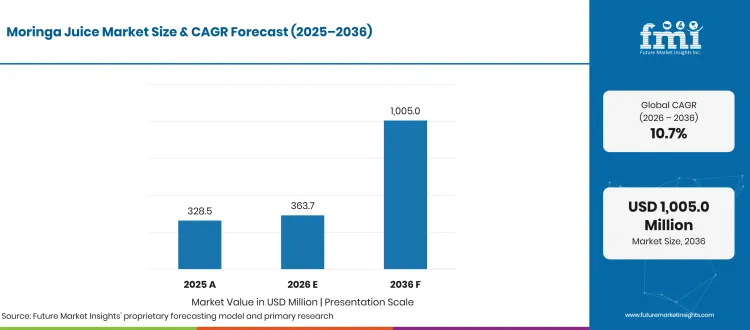
Valued at USD 328.5 million in 2025, the global moringa juice market moved up to USD 363.7 million in 2026 and is forecasted by Future Market Insights (FMI) to attain USD 1,005.0 million by 2036, progressing at a 10.7% CAGR over the assessment period as FMI analysis indicates USD 641.3 million in incremental revenue.
| Market Metric | Valuation / Share / Forecast Benchmark |
|---|---|
| 2025 Market Size (Historical) | USD 328.5 million |
| 2026 Market Size (Estimated) | USD 363.7 million |
| 2036 Market Size (Projected) | USD 1,005.0 million |
| Compound Annual Growth Rate (2026 to 2036) | 10.7% CAGR |
| Incremental Dollar Opportunity (2026 to 2036) | USD 641.3 million |
| Dominant Product Segment (2026 Share) | Pure Juice (42.0% share in 2026) | Other Segment Combined (58.0%) |
| Dominant Ingredient Segment (2026 Share) | Conventional (63.0% share in 2026) | Other Segment Combined (37.0%) |
| Dominant Distribution Channel (2026 Share) | Supermarkets/Hypermarkets (38.0% share in 2026) | Other Segment Combined (62.0%) |
| Largest Country Markets (2026 Valuation) | United States (USD 86.2 million), India (USD 68.4 million), China (USD 48.0 million) |
| Fastest-Growing Country Markets (2026 to 2036) | Japan (13.5% CAGR), South Korea (13.0% CAGR), India (12.5% CAGR) |
| Leading Tier-1 Companies | Dynamic Health Laboratories, Sri Sri Tattva, Baidyanath Group, Organic India, Grenera Nutrients, Dabur India, Basic Ayurveda, Patanjali Ayurved, Vinayak Ayurveda |
Source: Future Market Insights analysis of the moringa juice market, 2026.
This Report Answers
- How large the moringa juice market is in 2026 and what it reaches by 2036
- Which product, ingredient and distribution channel segments lead in 2026
- What is driving demand and what is holding the category back
- Which countries grow fastest between 2026 and 2036
- What Dynamic Health Laboratories and other leading players have launched
- How the moringa juice market is defined, segmented and measured
Executive Market Overview
Global demand for moringa juice centers on ready-to-drink and concentrated liquid Moringa oleifera formulations that spare consumers the bitterness and sediment of mixing dry leaf powders at home. FMI finds that buyer adoption is expanding across Ayurvedic wellness bottles in India and organic superfruit liquid blends in North America within broader moringa products. Clinical and phytochemical research published by the National Center for Biotechnology Information (April 2025) confirms that aqueous Moringa oleifera leaf infusions deliver bioavailable polyphenols, chlorogenic acid, and micronutrients without caffeine, encouraging functional beverage brands to position liquid moringa next to botanical supplements in pharmacy and grocery aisles.
Commercial realization across countries depends heavily on national novel-food authorizations and microbiological testing lot testing, and herbal flavor masking. In FMI's view, while India, the United States, and Japan provide lawful retail pathways under dietary-supplement, Ayurveda Aahara, or functional-food rules, explicit novel-food bans in Australia and Brazil block conventional grocery listings until safety dossiers are cleared. In November 2025, Food Standards Australia New Zealand (December 2025) rejected Application A1294 for Moringa oleifera leaves, green pods, and seed oil as a novel food, while formulators in permitted markets blend moringa with ginger and superfruit juices to improve repeat purchase rates in superfood drinks. Market sizing covers packaged moringa-led juices and liquid blends, excluding dry leaf powders and capsules.
Analyst Perspective
"Moringa juice manufacturers will capture higher repeat orders through acidulated fruit-and-ginger liquid blends than through unblended leaf extracts, because grassy glucosinolate notes cause high first-bottle drop-off. The primary commercial risk is regulatory fragmentation and microbiological recall exposure, as seen in recent novel-food rejections in Oceania and salmonella lot enforcement in North America."
- Nandini Roy Choudhury, Principal Consultant, Future Market Insights (FMI)
Key Market Trends & Insights
- Ginger and Turmeric Co-Formulation Lifts Sensory Acceptance and Antioxidant Potency: Unblended Moringa oleifera leaf juice exhibits astringent, grassy flavor notes that limit repeat household purchasing outside traditional Ayurvedic tonic users. Beverage chemists are blending pressed moringa leaf extract with yellow turmeric and ginger juices to balance flavor while increasing free-radical scavenging capacity. Experimental formulation data published via the National Center for Biotechnology Information (April 2025) demonstrated that enriching moringa drinks with yellow turmeric juice improved antioxidant IC50 potency from 126.69 ppm in control moringa drinks to 64.68 ppm, while maintaining stable 5% moisture levels in concentrated beverage bases.
- Pathogen Surveillance and Traceable Contract Farming Become Mandatory Retail Gates: North American and European retail chains have tightened microbiological and heavy-metal screening on imported botanical leaf ingredients following federal food-safety alerts. On November 12, 2025, the U.S. Food and Drug Administration (November 2025) issued an outbreak investigation and recall notice covering contaminated organic Moringa oleifera leaf lots, prompting liquid bottlers to require validated thermal pasteurization and farm-level traceability. Integrated Indian suppliers such as Grenera Nutrients (April 2025) are winning B2B export contracts by supplying certified organic moringa extracts from audited contract farms.
- Concentrated Daily Dilution Bottles Compete Against Green Powder Sachets: While East Asian wellness brands market powdered moringa aojiru sachets, liquid processors in South Asia and North America are scaling 500 ml to 1,000 ml concentrated bottles designed for 30 ml daily water dilution for detox drink regimens. Commercial product specifications from Sri Sri Tattva (May 2025) and Dynamic Health Laboratories (June 2025) illustrate how measured liquid dosing eliminates powder clumping and sediment in morning hydration routines.
What Are the Main Drivers, Restraints, and Opportunities?
Consumer demand for convenient, pre-dissolved botanical tonics and Ayurvedic immunity liquids drives category expansion, whereas novel-food bans in Australia and Brazil and raw-leaf bitterness restrain global distribution, creating clear opportunities for pasteurized superfruit-moringa blends and plant-protein beverage fortifications.
Driver: Shift From Clumping Dry Leaf Powders to Ready-to-Measure Liquid Tonics
Wellness shoppers purchasing daily greens and herbal tonics prefer liquid bottles that disperse instantly in water or smoothies without gritty leaf sediment in organic beverages. FMI observes that Indian Ayurvedic brands and United States natural-channel liquid supplement makers are expanding multi-serve bottle distribution across pharmacies and grocers. Corporate financial disclosures from Tata Consumer Products (July 2025) following its integration of Organic India confirm sustained double-digit revenue expansion across certified organic herbal and moringa wellness portfolios, while Sri Sri Tattva Singapore (May 2025) expanded 1,000 ml bottled moringa juice access across Southeast Asian retail and digital pharmacies.
Restraint: Novel-Food Prohibitions in Oceania and Brazil Plus Microbiological Compliance Costs
Statutory ingredient prohibitions in key Southern Hemisphere markets and strict pathogen-control costs directly constrain international export scaling. FMI notes that beverage brands cannot legally market conventional retail moringa foods in jurisdictions where regulators have rejected safety dossiers. On November 12, 2025, Food Standards Australia New Zealand (November 2025) formally rejected Application A1294 for Moringa oleifera leaf, green pods, and seed oil as a novel food, and on September 16, 2026, the Brazilian Health Regulatory Agency (Anvisa) (September 2026) ordered new product seizures reinforcing Brazil's ban on Moringa oleifera foods. In permitted markets, the U.S. Food and Drug Administration (November 2025) salmonella investigation reinforces mandatory thermal pasteurization for liquid bottlers.
Opportunity: Soymilk, Superfruit, and Herbal Co-Blends that Mask Bitterness
Formulators can unlock mainstream supermarket trial by blending 10% to 25% moringa leaf juice with tropical superfruits or plant-based milk bases that neutralize herbal bitterness while preserving amino acid and antioxidant density within fruit and vegetable juice. FMI expects multi-ingredient blends to achieve higher second-purchase retention than unblended extracts. Peer-reviewed sensory research published in the International Journal of Food Properties (January 2025) confirmed that fortifying fresh beverages with optimized Moringa oleifera leaf juice improved methionine and cysteine amino acid balance as well as panelist sensory scores, supporting commercial rollout of blended formats through 2036.
How Is the Moringa Juice Market Segmented?
Moringa Juice Market is segmented by Product, Ingredient, Distribution Channel, and Region. Forecast period from 2026 to 2036.
| Segmentation Axis | Sub-Segments Covered | 2026 Leading Segment & Share | Remainder & Total Alignment (2026) |
|---|---|---|---|
| Product | Pure Juice, Blended Juice, Fruit Blend, Vegetable Blend | Pure Juice (42.0% share) | Other Segment Combined (58.0%) | Total (100.0%) |
| Ingredient | Conventional, Organic | Conventional (63.0% share) | Other Segment Combined (37.0%) | Total (100.0%) |
| Distribution Channel | Supermarkets/Hypermarkets, Drugstore and Pharmacies, Convenience Stores, Online, Others | Supermarkets/Hypermarkets (38.0% share) | Other Segment Combined (62.0%) | Total (100.0%) |
| Region | North America, Latin America, Western Europe, Eastern Europe, East Asia, South Asia and Pacific, Middle East and Africa | North America, South Asia & East Asia drive permitted sales | Japan (13.5% CAGR), South Korea (13.0% CAGR) & India (12.5% CAGR) lead growth |
Source: Future Market Insights analysis of the moringa juice market, 2026.
Why Does the Pure Juice Segment Lead by Product?
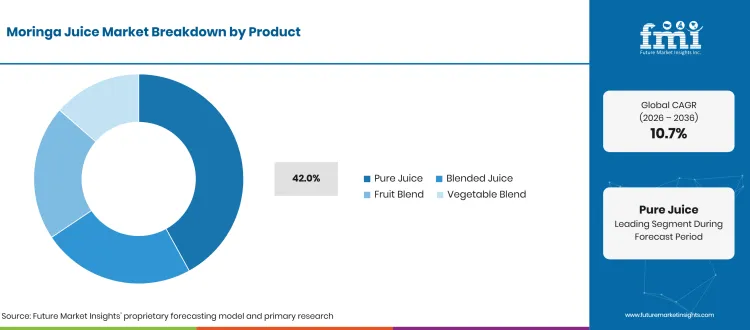
Pure Juice accounts for 42.0% of the Product segment in 2026, leading category sales on account of high-volume daily botanical tonic consumption across India and South Asia, where households dilute concentrated Moringa oleifera juice in water each morning in botanical ingredients. Product specifications from Sri Sri Tattva (May 2025) confirm that 1-liter pure moringa bottles serve as the primary replenishment SKU and while fruit expand faster in Western grocers through 2036.
Why Does the Conventional Segment Lead by Ingredient?
Conventional ingredients hold 63.0% of the Ingredient segment in 2026, as established farm-gate leaf supply enables accessible retail price points across commercial bottling lines using standard clean label ingredients. Regulatory overviews from the USDA Economic Research Service (January 2026) and USDA Agricultural Marketing Service (March 2025) confirm that certified organic beverage labels require accredited certifying-agent audits across both leaf farms and bottling lines, keeping conventional formats ahead in price-sensitive retail channels through 2036.
Why Does the Supermarkets/Hypermarkets Segment Lead by Distribution Channel?
Supermarkets and hypermarkets account for 38.0% of Distribution Channel sales in 2026, serving as the main retail source for natural-wellness shoppers comparing moringa blends against kombucha and functional shots. Modern-trade beverage expansion by Indian consumer groups such as Dabur India (October 2025) and US health-food grocers carrying Dynamic Health Laboratories (June 2025) reinforces supermarket discovery, while online subscriptions capture repeat multi-bottle orders through 2036.
Regional & Country Outlook
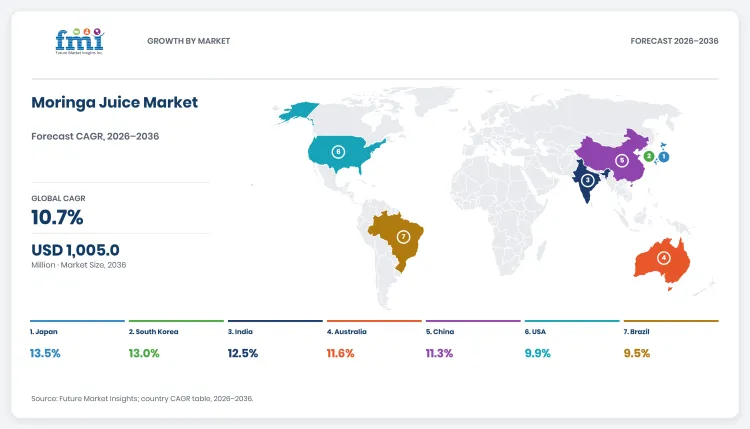
North America, South Asia and Pacific, and East Asia generate the bulk of global moringa juice revenue through 2036, shaped by sharp national divergence in food-ingredient legality and consumer familiarity. FMI projects the seven profiled countries below to represent 69.5% of global revenue in 2026 (USD 252.8 million), climbing to USD 711.6 million by 2036. Japan (13.5% CAGR), South Korea (13.0% CAGR), and India (12.5% CAGR) lead national growth rates as urban shoppers adopt functional green drinks and Ayurvedic liquid tonics and natural tea extract beverages, whereas Australia (11.6% CAGR) and Brazil (9.5% CAGR) remain contingent on regulatory clearance of novel-food prohibitions.
| Country | 2026 Revenue | 2036 Revenue | 10-Year Addition | 2026 to 2036 CAGR | Global Share (2026 -> 2036) |
|---|---|---|---|---|---|
| Japan | USD 21.8 million | USD 77.4 million | +USD 55.6 million | 13.5% | 6.0% -> 7.7% |
| South Korea | USD 16.4 million | USD 55.7 million | +USD 39.3 million | 13.0% | 4.5% -> 5.5% |
| India | USD 68.4 million | USD 222.1 million | +USD 153.7 million | 12.5% | 18.8% -> 22.1% |
| Australia | USD 9.1 million | USD 27.3 million | +USD 18.2 million | 11.6% | 2.5% -> 2.7% |
| China | USD 48.0 million | USD 140.0 million | +USD 92.0 million | 11.3% | 13.2% -> 13.9% |
| United States | USD 86.2 million | USD 221.7 million | +USD 135.5 million | 9.9% | 23.7% -> 22.1% |
| Brazil | USD 2.9 million | USD 7.2 million | +USD 4.3 million | 9.5% | 0.8% -> 0.7% |
Source: Future Market Insights analysis of the moringa juice market, 2026.
United States
Demand for moringa juice in United States is projected to rise from USD 86.2 million in 2026 to USD 221.7 million by 2036, advancing at a 9.9% CAGR and adding USD 135.5 million in new revenue. FMI observes that United States sales are anchored by certified organic liquid dietary-supplement blends sold in 16 fl oz and 32 fl oz bottles across natural grocers, vitamin chains, and e-commerce platforms. Product disclosures from Dynamic Health Laboratories (June 2025) highlight USDA Organic moringa blended with acai and pomegranate juices, while the U.S. Food and Drug Administration (November 2025) salmonella enforcement action has elevated batch pasteurization and supplier auditing into top retailer priorities. FMI expects verified pathogen-free organic liquid blends to sustain United States retail reorder growth through 2036.
India
Buyer adoption of moringa juice across India is estimated to expand from USD 68.4 million in 2026 to USD 222.1 million by 2036, spurred by a 12.5% CAGR and generating USD 153.7 million in commercial expansion. FMI finds that India benefits from world-leading domestic Moringa oleifera cultivation in southern states and established household consumption of 500 ml and 1,000 ml Ayurvedic herbal juices regulated under Food Safety and Standards Authority of India (March 2025) and FSSAI Standards Compendium (April 2025) frameworks. Commercial listings from Sri Sri Tattva (May 2025) and Baidyanath Group (June 2025) demonstrate strong pharmacy and quick-commerce rotation for pure and multi-herb moringa juices. In FMI's view, domestic farm-to-bottle cost advantages will keep India as the primary global volume engine through 2036.
China
China's moringa juice industry is set to scale from USD 48.0 million in 2026 to USD 140.0 million by 2036, driven by a 11.3% CAGR and adding USD 92.0 million in incremental market value. FMI believes Chinese demand is supported by official national recognition of Moringa oleifera leaf as a permitted new food resource and rapid urban adoption of low-sugar botanical wellness beverages across e-commerce and modern grocery banners. Phytochemical research conducted at Chinese and regional institutes and published via the National Center for Biotechnology Information (April 2025) documents growing formulation of moringa leaf infusions for metabolic wellness and specialty food ingredients. FMI projects domestic Chinese beverage packers blending Yunnan-grown moringa leaf extract with citrus and herbal infusions to expand convenience-store cooler listings through 2036.
Japan
Sales of moringa juice throughout Japan are projected to increase from USD 21.8 million in 2026 to USD 77.4 million by 2036, progressing at a 13.5% CAGR and creating USD 55.6 million in additional revenue. In FMI's assessment, Japanese expansion is driven by consumers upgrading from conventional barley and kale aojiru greens toward liquid and ready-to-mix moringa wellness drinks verified under strict quality notifications. In August 2025, Japanese wellness supplier DEDIC (August 2025) launched its Moringa de Aojiru green drink line, while the Japan Consumer Affairs Agency (October 2025) implemented updated October 2025 notification and scientific-evidence standards for Foods with Function Claims (FFC). FMI anticipates Japanese beverage formulators securing FFC notifications for moringa-fortified green drinks to capture premium pharmacy and supermarket shelf space through 2036.
South Korea
Consumption of moringa juice across South Korea is estimated to climb from USD 16.4 million in 2026 to USD 55.7 million by 2036, reflecting a 13.0% CAGR and contributing USD 39.3 million over the forecast decade. FMI observes that South Korean demand is fueled by home-shopping, online health malls, and pharmacy chains marketing concentrated botanical liquid pouches and detox juices containing Moringa oleifera and flavonoids. Regulatory oversight by the South Korea Ministry of Food and Drug Safety (March 2025) and MFDS Food Labeling System (April 2025) subjects imported botanical juices to strict customs residue clearance and separates general plant beverages from certified Health Functional Foods. FMI expects compliant pouch and bottle importers that substantiate ingredient purity to expand Korean digital and health-store distribution through 2036.
Australia
Revenue generated by moringa juice suppliers in Australia is forecast to expand from USD 9.1 million in 2026 to USD 27.3 million by 2036, supported by a 11.6% CAGR and generating USD 18.2 million in new category sales. FMI notes that while Australian consumers show strong interest in organic cold-pressed green juices, conventional food retail sale of Moringa oleifera remains blocked under the Australia New Zealand Food Standards Code. On November 12, 2025, Food Standards Australia New Zealand (May 2026) and the formal Food Standards Australia New Zealand (December 2025) decision report rejected Application A1294 to approve Moringa oleifera leaf, green pods, and seed oil as a novel food due to unresolved safety questions. FMI projects that realizing Australia's 2026 to 2036 revenue potential will require either Therapeutic Goods Administration listed-medicine registration or a future novel-food safety clearance.
Brazil
Buyer procurement of moringa juice throughout Brazil is tracking from USD 2.9 million in 2026 to USD 7.2 million by 2036, exhibiting a 9.5% CAGR and contributing USD 4.3 million to national market value. FMI finds that although consumer curiosity around herbal weight-management and wellness tonics persists, the Brazilian Health Regulatory Agency (Anvisa) (September 2026) issued a September 16, 2026 enforcement order seizing unauthorized Moringa oleifera products and reiterating that moringa lacks approved food safety registration in Brazil. In FMI's view, commercial realization of projected Brazilian beverage sales through 2036 remains strictly conditional on suppliers completing formal Anvisa novel-food toxicological approval prior to retail launch.
Competitive Environment and Notable Companies
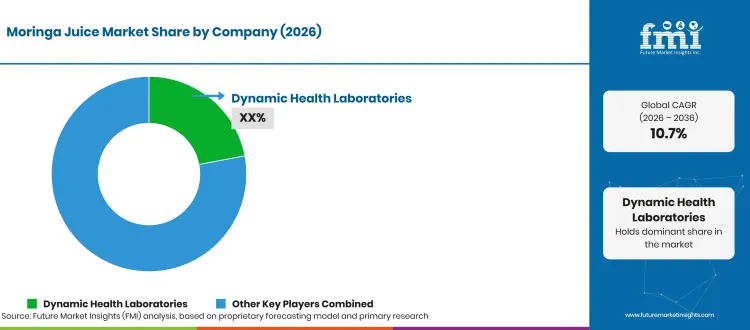
Notable companies profiled in the global moringa juice market include Dynamic Health Laboratories, Sri Sri Tattva, Baidyanath Group (Goodcare Pharma), Organic India Private Limited (Tata Consumer Products), Grenera Nutrients Private Limited, Dabur India Limited, Basic Ayurveda Private Limited, Patanjali Ayurved Limited, and Vinayak Ayurveda Private Limited (Srishma). Competition spans three distinct operational models: dedicated liquid moringa brand owners such as Dynamic Health Laboratories, Sri Sri Tattva, and Baidyanath Group that market bottled moringa juices and multi-herb liquid tonics; integrated organic moringa leaf and extract suppliers such as Organic India and Grenera Nutrients; and broad Indian Ayurvedic juice manufacturers including Dabur India, Basic Ayurveda, Patanjali Ayurved, and Vinayak Ayurveda.
How Are Companies Positioned in the Moringa Juice Market?
Direct liquid SKU evidence separates primary market leaders from adjacent botanical players. In the United States, Dynamic Health Laboratories (June 2025) positions its certified organic Moringa Juice blend with acai and pomegranate in natural grocery and online supplement channels. In India and Singapore, Sri Sri Tattva (May 2025) markets a standalone 1-liter Moringa Juice bottle, while Baidyanath Group (June 2025) includes Moringa oleifera inside its 1-liter Goodcare Thyro Balance multi-herb juice. Meanwhile, Organic India (July 2025) and Grenera Nutrients (April 2025) anchor certified organic moringa leaf supply.
What Matters When a Buyer Selects a Moringa Juice Supplier?
Retail and distributor procurement teams evaluate moringa beverage suppliers on four non-negotiable criteria: verified jurisdiction-specific food or dietary-supplement legality (avoiding prohibited markets flagged by Food Standards Australia New Zealand (December 2025) and Anvisa), batch microbiological clearance against Salmonella per U.S. Food and Drug Administration (November 2025) alerts, heavy-metal testing for cadmium and lead, and organic chain-of-custody verification.
Which Capabilities Distinguish Product Offers?
Formulation capabilities divide between single-herb Ayurvedic dilution tonics and palatable superfruit-botanical blends. Sri Sri Tattva formulates concentrated 1,000 ml pure moringa juice designed for 30 ml daily dilution in 100 ml of water. Dynamic Health Laboratories combines organic moringa with superfruit concentrates to mask herbal bitterness for Western palates. Grenera Nutrients (May 2025) supplies water-soluble moringa leaf extracts for B2B beverage formulators, while Basic Ayurveda (May 2025), Patanjali Ayurved (June 2025), and Vinayak Ayurveda (July 2025) operate high-speed Ayurvedic juice bottling and herbal powder lines.
How Does Geographic Reach Affect Competition?
Indian Ayurvedic manufacturers dominate South Asian pharmacy and modern-trade shelves through domestic leaf sourcing in Tamil Nadu and Andhra Pradesh, with Sri Sri Tattva extending bottled moringa juice into Singapore and North America. Following its acquisition by Tata Consumer Products (July 2025), Organic India leverages international grocery distribution in the United States and India, whereas Dabur India (October 2025) commands nationwide modern-trade juice distribution across South Asia and the Middle East.
| Verified Company Evidence (2025 to 2026) | Commercial Effect | Buyer Action |
|---|---|---|
| July 2025: Tata Consumer Products reported expanded international and domestic distribution scaling for Organic India in its Q1 FY2025/26 results (Tata Consumer Products, July 2025). | Strengthens global retail shelf access and farm-level organic traceability for Indian moringa products. | Partner with integrated organic suppliers with audited multi-country retail distribution. |
| October 2025: Dabur India unveiled refreshed contemporary packaging and portfolio positioning across its Real Nectar and wellness beverage lines (Dabur India, October 2025). | Demonstrates how mainstream Indian beverage leaders upgrade pack design to capture urban health-drink buyers. | Adopt clear dosage callouts and barrier bottle packaging to improve shelf rotation in modern grocery chains. |
| April 2025: Grenera Nutrients expanded B2B technical documentation for contract-farmed organic Moringa oleifera functional beverage ingredients (Grenera Nutrients, April 2025). | Provides beverage bottlers with traceable, heavy-metal-tested organic moringa leaf inputs. | Specify contract-farmed, lot-tested moringa extracts to prevent FDA microbiological or cadmium rejections. |
Source: Verified corporate disclosures and Future Market Insights analysis, 2026.
| Company | Core Positioning | Verified Activity & Source Attribution |
|---|---|---|
| Dynamic Health Laboratories | US certified organic Moringa Juice superfruit liquid blend in 16 fl oz and 32 fl oz bottles | Markets USDA Organic liquid moringa blended with acai, goji, and pomegranate across US natural grocers and online channels (Dynamic Health Laboratories, June 2025). |
| Sri Sri Tattva | Indian and international 1,000 ml standalone Moringa Juice bottle with 30 ml dilution dosing | Distributes 1-liter bottled Moringa Juice across Indian retail, pharmacy portals, and Singapore online stores (Sri Sri Tattva, May 2025; Sri Sri Tattva Singapore, May 2025). |
| Baidyanath Group (Goodcare Pharma) | Indian Ayurvedic multi-herb liquid juices containing Moringa oleifera (Goodcare range) | Markets 1-liter Goodcare Thyro Balance Juice formulated with Shigru (Moringa oleifera) across Indian pharmacies and e-commerce (Baidyanath Group, June 2025). |
| Organic India Private Limited | Tata Consumer Products subsidiary supplying USDA Organic moringa products and herbal infusions | Scaled domestic and US organic moringa distribution under Tata Consumer Products in FY2025/26 (Tata Consumer Products, July 2025; Organic India, July 2025). |
| Grenera Nutrients Private Limited | Vertically integrated Indian organic moringa cultivator and B2B functional beverage ingredient supplier | Published updated functional moringa ingredient specifications from audited contract farms in April 2025 (Grenera Nutrients, April & May 2025). |
| Dabur India Limited | Tier-1 Indian packaged juice and Ayurvedic health beverage manufacturer | Refreshed its Real beverage packaging architecture in October 2025 and its Ayurvedic herbal juice portfolio (Dabur India, October 2025). |
| Basic Ayurveda Private Limited | Indian manufacturer of bottled Ayurvedic herbal juices and botanical tonics | Produces multi-serve Ayurvedic herbal liquid tonics distributed across Indian wellness retail and online marketplaces (Basic Ayurveda, May 2025). |
| Patanjali Ayurved Limited | Mass-market Indian Ayurvedic bottled herbal juice and wellness producer | Operates high-volume 500 ml and 1-liter Ayurvedic herbal juice bottling and nationwide pharmacy retail networks (Patanjali Ayurved, June 2025). |
| Vinayak Ayurveda Private Limited | Faridabad-based Ayurvedic juice bottler and moringa wellness supplier (Srishma brand) | Markets Srishma Moringa wellness products and 500 ml and 1,000 ml Ayurvedic herbal juices in India (Vinayak Ayurveda, July 2025). |
Source: Verified corporate disclosures and Future Market Insights analysis, 2026.
Moringa Juice Market Report Scope and Research Methodology
Future Market Insights sizes the global moringa juice market using a bottom-up and top-down methodology that reconciles bottled Ayurvedic and superfruit-moringa beverage sales, leaf extraction throughput, and national regulatory eligibility across seven regions. Primary research incorporates structured interviews with Indian Ayurvedic juice bottlers, United States liquid supplement formulators, organic moringa leaf exporters, and retail pharmacy buyers evaluating bitterness-masking blends, pathogen testing, and novel-food compliance. Desk research cross-checks FSANZ novel-food rulings, Anvisa enforcement notices, US FDA microbiological alerts, FSSAI Ayurveda Aahara standards, Japan CAA functional claim notifications, and peer-reviewed beverage formulation studies published through 2026. Market revenue covers packaged moringa-led juices and moringa-containing liquid beverage blends, while excluding dry moringa leaf powders, capsules, tablets, seed oil for cosmetics, and upstream raw leaf transfers.
| Coverage Field | Report Scope |
|---|---|
| Market definition | Revenue from packaged moringa-led bottled or concentrated juices and moringa-bearing liquid juice blends sold across retail, pharmacy, and online channels. |
| Product segmentation (2026 share) | Pure Juice (42.0% share in 2026); Other Segment Combined - Blended Juice, Fruit Blend, and Vegetable Blend (58.0% share in 2026); Total (100.0%). |
| Ingredient segmentation (2026 share) | Conventional (63.0% share in 2026); Other Segment Combined / Organic (37.0% share in 2026); Total (100.0%). |
| Distribution Channel segmentation (2026 share) | Supermarkets/Hypermarkets (38.0% share in 2026); Other Segment Combined - Drugstore and Pharmacies, Convenience Stores, Online, and Others (62.0% share in 2026); Total (100.0%). |
| Packaging formats covered | Concentrated dilution bottles (500 ml to 1,000 ml PET and glass), organic superfruit liquid supplement bottles (16 fl oz to 32 fl oz), and single-serve functional pouches. |
| Exclusions | Dry moringa leaf powders, capsules, tablets, dry tea bags, cosmetic moringa seed oil, and wholesale raw leaf trade. |
| Quantitative units | USD million for global and national market valuations (locked uniformly across 2025, 2026, and 2036, including USD 1,005.0 million in 2036). |
| Forecast period & historical base | 2026 to 2036 forecast period (10.7% CAGR); 2025 historical baseline (USD 328.5 million). |
| Regions covered | North America (United States, Canada); Latin America (Brazil, Mexico, Argentina, Chile); Western Europe (Germany, France, United Kingdom, Italy, Spain, Benelux, Nordics); Eastern Europe (Poland, Czech Republic, Romania, Hungary); East Asia (China, Japan, South Korea); South Asia and Pacific (India, ASEAN, Australia and New Zealand); Middle East and Africa (GCC Countries, South Africa, Türkiye, Israel). |
| Countries profiled in detail | United States, India, China, Japan, South Korea, Australia, and Brazil. |
| Companies covered | Dynamic Health Laboratories, Sri Sri Tattva, Baidyanath Group, Organic India Private Limited, Grenera Nutrients Private Limited, Dabur India Limited, Basic Ayurveda Private Limited, Patanjali Ayurved Limited, and Vinayak Ayurveda Private Limited. |
| Primary research approach | Interviews with Ayurvedic beverage manufacturers, organic moringa extract processors, food safety auditors, and retail category managers. |
| Desk research & validation | Cross-checked against FSANZ Application A1294 rulings, Anvisa enforcement resolutions, US FDA outbreak investigations, FSSAI regulations, Japan CAA notices, South Korea MFDS rules, and NCBI PMC beverage studies. |
Source: Future Market Insights analysis of the moringa juice market, 2026.
Research Sources and Bibliography
- Baidyanath Group. (2025, June 14). Goodcare Thyro Balance Juice 1 Ltr with Moringa Oleifera Product Specification. https://www.baidyanath.com/products/goodcare-thyro-balance-juice-1-ltr
- Basic Ayurveda. (2025, May 19). Basic Ayurveda Herbal Juices and Liquid Tonics Product Catalogue. https://basicayurveda.co.in/products.php
- Brazilian Health Regulatory Agency (Anvisa). (2026, September 16). Anvisa proíbe produtos com Moringa oleifera. https://www.gov.br/anvisa/pt-br/assuntos/noticias-anvisa/2026/anvisa-proibe-produtos-com-moringa-oleifera
- Dabur India. (2025, October 7). Real Nectar Unveils Contemporary Packaging Across Entire Range. https://www.dabur.com/press-releases/real-new-avatar
- DEDIC. (2025, August 28). New Product Launch: Moringa de Aojiru Functional Green Drink. https://www.dedic.jp/news/2025/120/
- Dynamic Health Laboratories. (2025, June 10). Certified Organic Moringa Juice Blend Product Specification. https://dynamichealth.com/collections/blends-tonics/products/moringa-juice
- Food Safety and Standards Authority of India. (2025, March 15). Food Safety and Standards Regulations and Ayurveda Aahara Framework. https://www.fssai.gov.in/food-law/regulations
- Food Standards Australia New Zealand. (2025, November 12). Application A1294: Moringa oleifera as a Novel Food Decision Summary. https://www.foodstandards.gov.au/food-standards-code/applications/application-a1294-moringa-oleifera-novel-food
- Food Standards Australia New Zealand. (2025, December 11). Rejection Report: Application A1294 Moringa oleifera as a Novel Food. https://www.foodstandards.gov.au/sites/default/files/2025-12/A1294%20Rejection%20report.pdf
- Food Standards Australia New Zealand. (2026, May 12). Moringa oleifera as a Novel Food Regulatory Compliance Notice. https://www.foodstandards.gov.au/business/novel/moringa-oleifera-novel-food
- FSSAI Standards Compendium. (2025, April 18). Food Products Standards and Food Additives Compendium. https://fssai.gov.in/food-law/regulations/compendium/food-products-standards
- Grenera Nutrients. (2025, April 2). Moringa: A Functional Botanical Ingredient for Beverages and Nutraceuticals. https://www.grenera.com/moringa/moringa-a-functional-botanical-ingredient/
- Grenera Nutrients. (2025, May 11). Organic Moringa Ingredients and Extracts Portfolio. https://www.grenera.com/products-organic-ingredients/
- International Journal of Food Properties. (2025, January 3). Acceptability of Optimized Fresh Moringa oleifera and Soymilk Beverage. https://www.tandfonline.com/doi/full/10.1080/19476337.2024.2448491
- Japan Consumer Affairs Agency. (2025, October 1). Guidance and Notification Standards for Foods with Function Claims. https://www.caa.go.jp/policies/policy/food_labeling/foods_with_function_claims/notice
- MFDS Food Labeling System. (2025, April 12). Republic of Korea Food and Health Functional Food Labeling Standards. https://www.mfds.go.kr/eng/wpge/m_14/contents.do
- National Center for Biotechnology Information. (2025, April 11). Moringa oleifera Leaf Infusion as a Functional Beverage: Phytochemical and Metabolic Review. https://pmc.ncbi.nlm.nih.gov/articles/PMC12028896/
- National Center for Biotechnology Information. (2025, April 23). Physicochemical and Organoleptic Properties of Moringa Instant (Moringa oleifera Lam) Drink Enriched with Ginger, Turmeric, Galangal, and Lemongrass. https://pmc.ncbi.nlm.nih.gov/articles/PMC12569982/
- Organic India. (2025, July 20). Organic Moringa Formulations and Certified Organic Sourcing Profile. https://organicindia.com/products/moringa-powder
- Patanjali Ayurved. (2025, June 25). Patanjali Natural Health Drinks and Ayurvedic Juice Portfolio. https://www.patanjaliayurved.net/product/natural-health-care/health-drinks/patanjali-giloy-juice/588
- South Korea Ministry of Food and Drug Safety. (2025, March 22). Imported Food Safety Management and Inspection Framework. https://www.mfds.go.kr/eng/wpge/m_11/de011002l001.do
- Sri Sri Tattva. (2025, May 8). Moringa Juice Powerhouse of Nutrients 1L Product Specification. https://www.srisritattva.com/products/moringa-juice-powerhouse-of-nutrients-1l
- Sri Sri Tattva Singapore. (2025, May 15). Sri Sri Tattva Moringa Juice 1000ml Retail Specification. https://www.srisritattva.com.sg/product-page/moringa-juice-1000ml
- Tata Consumer Products. (2025, July 23). Financial Results for the Quarter Ended June 30, 2025 Including Organic India Operations. https://www.tataconsumer.com/news/results-quarter-ended-30th-june-2025
- U.S. Food and Drug Administration. (2025, November 12). Outbreak Investigation of Salmonella: Moringa Leaf Powder (October 2025). https://www.fda.gov/food/outbreaks-foodborne-illness/outbreak-investigation-salmonella-moringa-leaf-powder-october-2025
- USDA Agricultural Marketing Service. (2025, March 14). National Organic Program: Labeling Organic Products. https://www.ams.usda.gov/rules-regulations/organic/labeling
- USDA Economic Research Service. (2026, January 27). Organic Agriculture: Retail Channel and Certification Overview. https://ers.usda.gov/topics/natural-resources-environment/organic-agriculture
- Vinayak Ayurveda. (2025, July 18). Srishma Moringa and Ayurvedic Juices Product Specification. https://srishma.com/product/srishma-moringa-powder-200gm/
Table of Content
- Key Takeaways
- Market Size and CAGR
- Top Growth Driver
- Fastest Growing Segment
- Leading Region
- Key Companies
- Emerging Opportunities
- Executive Summary
- Global Market Outlook
- Demand-side Trends
- Supply-side Trends
- Technology Roadmap Analysis
- Analysis and Recommendations
- Analyst Perspective (What is happening? Why now? What should investors know?)
- Key Questions Answered
- How large is the market?
- What is the CAGR?
- What are key trends?
- Which region dominates?
- Who are the leaders?
Read More...
- Market Overview
- Market Coverage / Taxonomy
- Market Definition / Scope / Limitations
- Research Methodology
- Chapter Orientation
- Analytical Lens and Working Hypotheses
- Market Structure, Signals, and Trend Drivers
- Benchmarking and Cross-market Comparability
- Market Sizing, Forecasting, and Opportunity Mapping
- Research Design and Evidence Framework
- Desk Research Programme (Secondary Evidence)
- Expert Input and Fieldwork (Primary Evidence)
- Tooling, Models, and Reference Databases
- Data Engineering and Model Build
- Quality Assurance and Audit Trail
- Market Background
- Market Dynamics (Drivers, Restraints, Opportunity, Trends)
- Scenario Forecast (Optimistic, Likely, Conservative)
- Impact Analysis
- AI Impact
- Sustainability Impact
- Regulatory Impact
- Technology Impact
- Consumer / Buyer Analysis
- Purchase Drivers
- Adoption Barriers
- Buyer Journey
- Opportunity Map Analysis
- Product Life Cycle Analysis
- Supply Chain Analysis
- Investment Feasibility Matrix
- Value Chain Analysis
- PESTLE and Porter's Analysis
- Regulatory Landscape
- Regional Parent Market Outlook
- Production and Consumption Statistics
- Import and Export Statistics
- Global Market Analysis and Forecast, 2021 to 2036
- Historical Market Size Value (USD Million) Analysis, 2021 to 2025
- Current and Future Market Size Value (USD Million) Projections, 2026 to 2036
- Y-o-Y Growth Trend Analysis
- Absolute $ Opportunity Analysis
- Global Market Pricing Analysis, 2021 to 2036
- Global Market Analysis and Forecast, By Product, 2021 to 2036
- Introduction / Key Findings
- Historical Market Size Value (USD Million) Analysis By Product, 2021 to 2025
- Current and Future Market Size Value (USD Million) Analysis and Forecast By Product, 2026 to 2036
- Pure Juice
- Blended Juice
- Fruit Blend
- Vegetable Blend
- Y-o-Y Growth Trend Analysis By Product, 2021 to 2025
- Absolute $ Opportunity Analysis By Product, 2026 to 2036
- Global Market Analysis and Forecast, By Ingredient, 2021 to 2036
- Introduction / Key Findings
- Historical Market Size Value (USD Million) Analysis By Ingredient, 2021 to 2025
- Current and Future Market Size Value (USD Million) Analysis and Forecast By Ingredient, 2026 to 2036
- Conventional
- Organic
- Y-o-Y Growth Trend Analysis By Ingredient, 2021 to 2025
- Absolute $ Opportunity Analysis By Ingredient, 2026 to 2036
- Global Market Analysis and Forecast, By Distribution Channel, 2021 to 2036
- Introduction / Key Findings
- Historical Market Size Value (USD Million) Analysis By Distribution Channel, 2021 to 2025
- Current and Future Market Size Value (USD Million) Analysis and Forecast By Distribution Channel, 2026 to 2036
- Supermarkets/Hypermarkets
- Drugstore and Pharmacies
- Convenience Stores
- Online
- Others
- Y-o-Y Growth Trend Analysis By Distribution Channel, 2021 to 2025
- Absolute $ Opportunity Analysis By Distribution Channel, 2026 to 2036
- Global Market Analysis and Forecast, By Region, 2021 to 2036
- Introduction
- Historical Market Size Value (USD Million) Analysis By Region, 2021 to 2025
- Current Market Size Value (USD Million) Analysis and Forecast By Region, 2026 to 2036
- North America
- Western Europe
- East Asia
- South Asia and Pacific
- Market Attractiveness Analysis By Region
- North America Market Analysis and Forecast, By Country, 2021 to 2036
- Historical Market Size Value (USD Million) Trend Analysis By Market Taxonomy, 2021 to 2025
- Market Size Value (USD Million) Forecast By Market Taxonomy, 2026 to 2036
- By Country
- United States
- Canada
- By Product
- By Ingredient
- By Distribution Channel
- By Country
- Market Attractiveness Analysis
- By Country
- By Product
- By Ingredient
- By Distribution Channel
- Key Takeaways
- Western Europe Market Analysis and Forecast, By Country
- Historical Market Size Value (USD Million) Trend Analysis By Market Taxonomy, 2021 to 2025
- Market Size Value (USD Million) Forecast By Market Taxonomy, 2026 to 2036
- By Country
- United Kingdom
- Germany
- France
- By Product
- By Ingredient
- By Distribution Channel
- By Country
- Market Attractiveness Analysis
- By Country
- By Product
- By Ingredient
- By Distribution Channel
- Key Takeaways
- East Asia Market Analysis and Forecast, By Country
- Historical Market Size Value (USD Million) Trend Analysis By Market Taxonomy, 2021 to 2025
- Market Size Value (USD Million) Forecast By Market Taxonomy, 2026 to 2036
- By Country
- China
- Japan
- South Korea
- By Product
- By Ingredient
- By Distribution Channel
- By Country
- Market Attractiveness Analysis
- By Country
- By Product
- By Ingredient
- By Distribution Channel
- Key Takeaways
- South Asia and Pacific Market Analysis and Forecast, By Country
- Historical Market Size Value (USD Million) Trend Analysis By Market Taxonomy, 2021 to 2025
- Market Size Value (USD Million) Forecast By Market Taxonomy, 2026 to 2036
- By Country
- India
- Australia
- Rest of world aggregate
- By Product
- By Ingredient
- By Distribution Channel
- By Country
- Market Attractiveness Analysis
- By Country
- By Product
- By Ingredient
- By Distribution Channel
- Key Takeaways
- Key Countries Market Analysis
- United States
- Pricing Analysis
- Market Share Analysis, 2025
- By Product
- By Ingredient
- By Distribution Channel
- Canada
- Pricing Analysis
- Market Share Analysis, 2025
- By Product
- By Ingredient
- By Distribution Channel
- Germany
- Pricing Analysis
- Market Share Analysis, 2025
- By Product
- By Ingredient
- By Distribution Channel
- United Kingdom
- Pricing Analysis
- Market Share Analysis, 2025
- By Product
- By Ingredient
- By Distribution Channel
- France
- Pricing Analysis
- Market Share Analysis, 2025
- By Product
- By Ingredient
- By Distribution Channel
- India
- Pricing Analysis
- Market Share Analysis, 2025
- By Product
- By Ingredient
- By Distribution Channel
- China
- Pricing Analysis
- Market Share Analysis, 2025
- By Product
- By Ingredient
- By Distribution Channel
- Japan
- Pricing Analysis
- Market Share Analysis, 2025
- By Product
- By Ingredient
- By Distribution Channel
- South Korea
- Pricing Analysis
- Market Share Analysis, 2025
- By Product
- By Ingredient
- By Distribution Channel
- Australia
- Pricing Analysis
- Market Share Analysis, 2025
- By Product
- By Ingredient
- By Distribution Channel
- United States
- Market Structure Analysis
- Competition Dashboard
- Competition Benchmarking
- Market Share Analysis of Top Players
- By Regional
- By Product
- By Ingredient
- By Distribution Channel
- Emerging Startups
- Innovation Benchmarking
- Competition Analysis
- Competition Deep Dive
- Dynamic Health Laboratories
- Overview
- Product Portfolio
- Profitability by Market Segments
- Sales Footprint
- Strategy Overview
- Marketing Strategy
- Product Strategy
- Channel Strategy
- Sri Sri Tattva
- Baidyanath Group (Goodcare Pharma)
- Organic India Private Limited
- Grenera Nutrients Private Limited
- Dabur India Limited
- Basic Ayurveda Private Limited
- Patanjali Ayurved Limited
- Vinayak Ayurveda Private Limited
- Dynamic Health Laboratories
- Case Studies
- Success Stories
- Recent Developments
- Competition Deep Dive
- Assumptions & Acronyms Used
List of Tables
- Table 1: Global Market Value (USD Million) Forecast by Region, 2021 to 2036
- Table 2: Global Market Value (USD Million) Forecast by Product, 2021 to 2036
- Table 3: Global Market Value (USD Million) Forecast by Ingredient, 2021 to 2036
- Table 4: Global Market Value (USD Million) Forecast by Distribution Channel, 2021 to 2036
- Table 5: North America Market Value (USD Million) Forecast by Country, 2021 to 2036
- Table 6: North America Market Value (USD Million) Forecast by Product, 2021 to 2036
- Table 7: North America Market Value (USD Million) Forecast by Ingredient, 2021 to 2036
- Table 8: North America Market Value (USD Million) Forecast by Distribution Channel, 2021 to 2036
- Table 9: Western Europe Market Value (USD Million) Forecast by Country, 2021 to 2036
- Table 10: Western Europe Market Value (USD Million) Forecast by Product, 2021 to 2036
- Table 11: Western Europe Market Value (USD Million) Forecast by Ingredient, 2021 to 2036
- Table 12: Western Europe Market Value (USD Million) Forecast by Distribution Channel, 2021 to 2036
- Table 13: East Asia Market Value (USD Million) Forecast by Country, 2021 to 2036
- Table 14: East Asia Market Value (USD Million) Forecast by Product, 2021 to 2036
- Table 15: East Asia Market Value (USD Million) Forecast by Ingredient, 2021 to 2036
- Table 16: East Asia Market Value (USD Million) Forecast by Distribution Channel, 2021 to 2036
- Table 17: South Asia and Pacific Market Value (USD Million) Forecast by Country, 2021 to 2036
- Table 18: South Asia and Pacific Market Value (USD Million) Forecast by Product, 2021 to 2036
- Table 19: South Asia and Pacific Market Value (USD Million) Forecast by Ingredient, 2021 to 2036
- Table 20: South Asia and Pacific Market Value (USD Million) Forecast by Distribution Channel, 2021 to 2036
List of Figures
- Figure 1: Global Market Pricing Analysis
- Figure 2: Global Market Value (USD Million) Forecast 2021-2036
- Figure 3: Global Market Value Share and BPS Analysis by Product, 2026 and 2036
- Figure 4: Global Market Y-o-Y Growth Comparison by Product, 2026-2036
- Figure 5: Global Market Attractiveness Analysis by Product
- Figure 6: Global Market Value Share and BPS Analysis by Ingredient, 2026 and 2036
- Figure 7: Global Market Y-o-Y Growth Comparison by Ingredient, 2026-2036
- Figure 8: Global Market Attractiveness Analysis by Ingredient
- Figure 9: Global Market Value Share and BPS Analysis by Distribution Channel, 2026 and 2036
- Figure 10: Global Market Y-o-Y Growth Comparison by Distribution Channel, 2026-2036
- Figure 11: Global Market Attractiveness Analysis by Distribution Channel
- Figure 12: Global Market Value (USD Million) Share and BPS Analysis by Region, 2026 and 2036
- Figure 13: Global Market Y-o-Y Growth Comparison by Region, 2026-2036
- Figure 14: Global Market Attractiveness Analysis by Region
- Figure 15: North America Market Incremental Dollar Opportunity, 2026-2036
- Figure 16: Western Europe Market Incremental Dollar Opportunity, 2026-2036
- Figure 17: East Asia Market Incremental Dollar Opportunity, 2026-2036
- Figure 18: South Asia and Pacific Market Incremental Dollar Opportunity, 2026-2036
- Figure 19: North America Market Value Share and BPS Analysis by Country, 2026 and 2036
- Figure 20: North America Market Value Share and BPS Analysis by Product, 2026 and 2036
- Figure 21: North America Market Y-o-Y Growth Comparison by Product, 2026-2036
- Figure 22: North America Market Attractiveness Analysis by Product
- Figure 23: North America Market Value Share and BPS Analysis by Ingredient, 2026 and 2036
- Figure 24: North America Market Y-o-Y Growth Comparison by Ingredient, 2026-2036
- Figure 25: North America Market Attractiveness Analysis by Ingredient
- Figure 26: North America Market Value Share and BPS Analysis by Distribution Channel, 2026 and 2036
- Figure 27: North America Market Y-o-Y Growth Comparison by Distribution Channel, 2026-2036
- Figure 28: North America Market Attractiveness Analysis by Distribution Channel
- Figure 29: Western Europe Market Value Share and BPS Analysis by Country, 2026 and 2036
- Figure 30: Western Europe Market Value Share and BPS Analysis by Product, 2026 and 2036
- Figure 31: Western Europe Market Y-o-Y Growth Comparison by Product, 2026-2036
- Figure 32: Western Europe Market Attractiveness Analysis by Product
- Figure 33: Western Europe Market Value Share and BPS Analysis by Ingredient, 2026 and 2036
- Figure 34: Western Europe Market Y-o-Y Growth Comparison by Ingredient, 2026-2036
- Figure 35: Western Europe Market Attractiveness Analysis by Ingredient
- Figure 36: Western Europe Market Value Share and BPS Analysis by Distribution Channel, 2026 and 2036
- Figure 37: Western Europe Market Y-o-Y Growth Comparison by Distribution Channel, 2026-2036
- Figure 38: Western Europe Market Attractiveness Analysis by Distribution Channel
- Figure 39: East Asia Market Value Share and BPS Analysis by Country, 2026 and 2036
- Figure 40: East Asia Market Value Share and BPS Analysis by Product, 2026 and 2036
- Figure 41: East Asia Market Y-o-Y Growth Comparison by Product, 2026-2036
- Figure 42: East Asia Market Attractiveness Analysis by Product
- Figure 43: East Asia Market Value Share and BPS Analysis by Ingredient, 2026 and 2036
- Figure 44: East Asia Market Y-o-Y Growth Comparison by Ingredient, 2026-2036
- Figure 45: East Asia Market Attractiveness Analysis by Ingredient
- Figure 46: East Asia Market Value Share and BPS Analysis by Distribution Channel, 2026 and 2036
- Figure 47: East Asia Market Y-o-Y Growth Comparison by Distribution Channel, 2026-2036
- Figure 48: East Asia Market Attractiveness Analysis by Distribution Channel
- Figure 49: South Asia and Pacific Market Value Share and BPS Analysis by Country, 2026 and 2036
- Figure 50: South Asia and Pacific Market Value Share and BPS Analysis by Product, 2026 and 2036
- Figure 51: South Asia and Pacific Market Y-o-Y Growth Comparison by Product, 2026-2036
- Figure 52: South Asia and Pacific Market Attractiveness Analysis by Product
- Figure 53: South Asia and Pacific Market Value Share and BPS Analysis by Ingredient, 2026 and 2036
- Figure 54: South Asia and Pacific Market Y-o-Y Growth Comparison by Ingredient, 2026-2036
- Figure 55: South Asia and Pacific Market Attractiveness Analysis by Ingredient
- Figure 56: South Asia and Pacific Market Value Share and BPS Analysis by Distribution Channel, 2026 and 2036
- Figure 57: South Asia and Pacific Market Y-o-Y Growth Comparison by Distribution Channel, 2026-2036
- Figure 58: South Asia and Pacific Market Attractiveness Analysis by Distribution Channel
- Figure 59: Global Market - Tier Structure Analysis
- Figure 60: Global Market - Company Share Analysis
Frequently Asked Questions
How big is the moringa juice market in 2026?
Future Market Insights estimates the global moringa juice market valuation at USD 363.7 million in 2026, advancing from USD 328.5 million in 2025 across bottled moringa juices and liquid blends.
How fast is the moringa juice market expected to grow through 2036?
Global moringa juice sales are projected to grow at a 10.7% CAGR from 2026 to 2036, reaching USD 1,005.0 million by 2036 and generating USD 641.3 million in incremental revenue.
Which Product segment leads the moringa juice market?
Pure Juice leads the Product axis with a 42.0% revenue share in 2026, driven by strong consumer preference for unadulterated botanical tonics in daily wellness routines.
Which Ingredient segment leads the moringa juice market?
Conventional ingredients capture 63.0% of Ingredient revenue in 2026, as established farm-gate leaf supply enables accessible retail price points.
Which Distribution Channel leads the moringa juice market?
Supermarkets/Hypermarkets channel holds 38.0% of global moringa juice sales in 2026, anchored by dedicated health and functional beverage aisles.
Which countries are the largest moringa juice markets?
United States leads profiled country revenue in 2026, supported by expanding distribution across natural grocery chains and online wellness stores.
Which profiled countries are expected to grow fastest in the moringa juice market?
Japan is projected to register the fastest growth at a 13.5% CAGR from 2026 to 2036, followed by South Korea at 13.0% and India at 12.5% as functional green drinks and Ayurvedic tonics scale.
Which companies are notable players in the moringa juice market?
Notable companies operating in the moringa juice market include Dynamic Health Laboratories, Sri Sri Tattva, Baidyanath Group, Organic India Private Limited, Grenera Nutrients Private Limited, Dabur India Limited, Basic Ayurveda Private Limited, Patanjali Ayurved Limited, and Vinayak Ayurveda Private Limited.
Preview the report firsthand - request a free sample
Get SampleGet the brochure for pricing and purchase details.
Get PDF
