Multi-Modal Biometric Cabin Sensors Market Forecast and Outlook 2025 to 2035

The multi-modal biometric cabin sensors market is projected to grow from USD 1,786.7 million in 2025 to approximately USD 2,554.4 million by 2035, recording an absolute increase of USD 767.7 million over the forecast period. This translates into a total growth of 43.0%, with the market forecast to expand at a compound annual growth rate (CAGR) of 3.6% between 2025 and 2035. The overall market size is expected to grow by nearly 1.4X during the same period, supported by increasing demand for advanced biometric authentication systems, growing security requirements in vehicles and access control systems, and rising adoption of multi-modal sensing technologies in critical security applications across global automotive and industrial infrastructure.
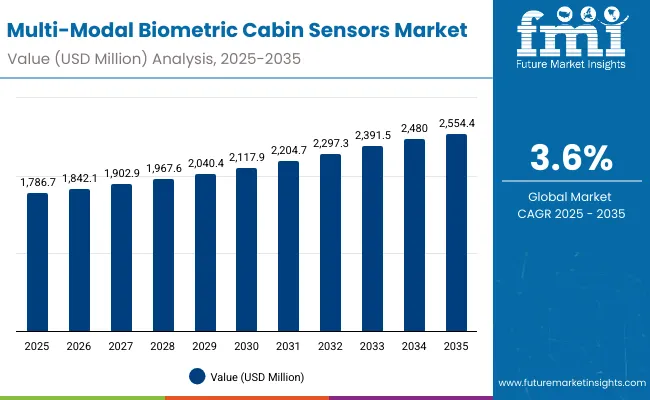
Quick Stats for Multi-Modal Biometric Cabin Sensors Market

  • Multi-Modal Biometric Cabin Sensors Market Value (2025): USD 1,786.7 million
  • Multi-Modal Biometric Cabin Sensors Market Forecast Value (2035): USD 2,554.4 million
  • Multi-Modal Biometric Cabin Sensors Market Forecast CAGR: 3.6%
  • Leading Measurement Principle in Multi-Modal Biometric Cabin Sensors Market: Optical/Imaging (35.0%)
  • Key Growth Regions in Multi-Modal Biometric Cabin Sensors Market: Asia Pacific, North America, and Europe
  • Top Key Players in Multi-Modal Biometric Cabin Sensors Market: Bosch, Continental, Denso, OmniVision, Seeing Machines, Smart Eye, Valeo, NXP Semiconductors, Infineon Technologies, STMicroelectronics, Magna International, Aptiv, Veoneer, ZF Friedrichshafen, Gentex Corporation

Multi Modal Biometric Cabin Sensors Market

Multi-Modal Biometric Cabin Sensors Market Key Takeaways

Metric Value
Estimated Value in (2025E) USD 1,786.7 million
Forecast Value in (2035F) USD 2,554.4 million
Forecast CAGR (2025 to 2035) 3.6%

Between 2025 and 2030, the multi-modal biometric cabin sensors market is projected to expand from USD 1,786.7 million to USD 2,117.9 million, resulting in a value increase of USD 331.2 million, which represents 43.1% of the total forecast growth for the decade. This phase of development will be shaped by increasing automotive safety regulations, rising adoption of biometric authentication in vehicles, and growing utilization in smart access control and security applications. Equipment manufacturers and sensor suppliers are expanding their production capabilities to address the growing preference for advanced biometric solutions in critical security operations and identity verification applications.

From 2030 to 2035, the market is forecast to grow from USD 2,117.9 million to USD 2,554.4 million, adding another USD 436.5 million, which constitutes 56.9% of the overall ten-year expansion. This period is expected to be characterized by the expansion of advanced biometric technologies, the integration of artificial intelligence and machine learning capabilities, and the development of specialized sensor solutions for emerging security applications. The growing emphasis on cybersecurity and identity protection will drive demand for intelligent biometric systems with enhanced accuracy and multi-factor authentication capabilities.

Between 2020 and 2024, the multi-modal biometric cabin sensors market experienced robust growth, driven by increasing security concerns and growing recognition of biometric authentication's importance in maintaining secure access control systems. The market developed as security providers recognized the potential for multi-modal sensors to enhance identification accuracy while meeting stringent security requirements. Technological advancement in sensor fusion and biometric algorithms began emphasizing the critical importance of maintaining identity verification while reducing false positives and improving authentication reliability.

Why is the Multi-Modal Biometric Cabin Sensors Market Growing?

Market expansion is being supported by the increasing global demand for advanced security solutions and the corresponding shift toward biometric technologies that can provide superior authentication accuracy while meeting stringent security requirements for critical access control applications. Modern automotive manufacturers and security system providers are increasingly focused on incorporating multi-modal biometric sensors to enhance security reliability while satisfying demands for seamless user experience and proven performance in demanding operational environments. Multi-modal biometric cabin sensors' proven ability to deliver superior identification accuracy, operational reliability, and fraud prevention capabilities makes them essential components for advanced security operations and critical authentication applications.

The growing emphasis on automotive safety and smart vehicle technologies is driving demand for intelligent biometric systems that can support distinctive security characteristics and mission-critical applications across vehicle access, driver monitoring, and passenger identification categories. Security provider preference for solutions that combine authentication excellence with proven reliability credentials is creating opportunities for innovative biometric implementations in both traditional and emerging security applications. The rising influence of regulatory compliance and cybersecurity protocols is also contributing to increased adoption of multi-modal authentication systems that can provide real-time identity verification and enhanced security monitoring.

Segmental Analysis

The market is segmented by measurement principle, interface, form factor, and end-use sector. By measurement principle, the market is divided into optical/imaging, electromagnetic/inductive, acoustic/ultrasonic, and other principles. Based on interface, the market is categorized into ethernet/fieldbus, serial/discrete, I2C line/proprietary, and analog. By form factor, the market is divided into fixed, portable, and embedded/board-level. Based on end-use sector, the market is segmented into electronics/semiconductor, F&B/packaging, industrial process, and others.
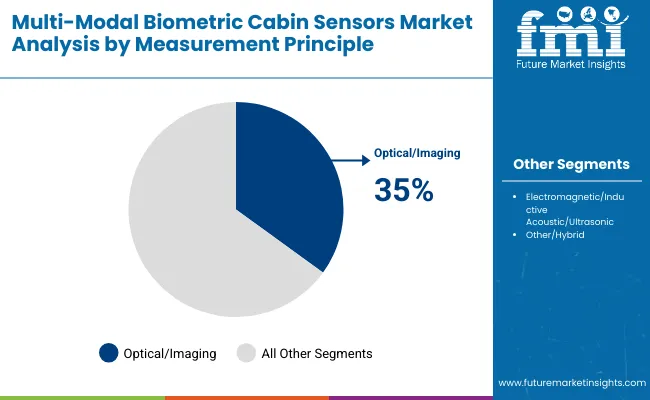
By Measurement Principle, Optical/Imaging Segment Accounts for 35.0% Market Share

Multi Modal Biometric Cabin Sensors Market By Measurement Principle

The optical/imaging segment is projected to account for 35.0% of the multi-modal biometric cabin sensors market in 2025, reaffirming its position as the leading measurement principle category. Automotive manufacturers and security system designers increasingly utilize optical/imaging sensors for their superior resolution capabilities, advanced image processing features, and ease of integration in complex biometric systems across diverse security applications. This sensor type's proven design directly addresses security requirements for reliable facial recognition and efficient operation in variable lighting conditions.

This segment forms the foundation of modern biometric authentication applications, as it represents the configuration with the greatest versatility and established compatibility across multiple identification systems. Security provider investments in optical technology optimization and image processing enhancement continue to strengthen adoption among system integrators. With security facilities prioritizing authentication accuracy and consistent performance characteristics, optical/imaging sensors align with both reliability objectives and user experience requirements, making them the central component of comprehensive biometric authentication strategies.
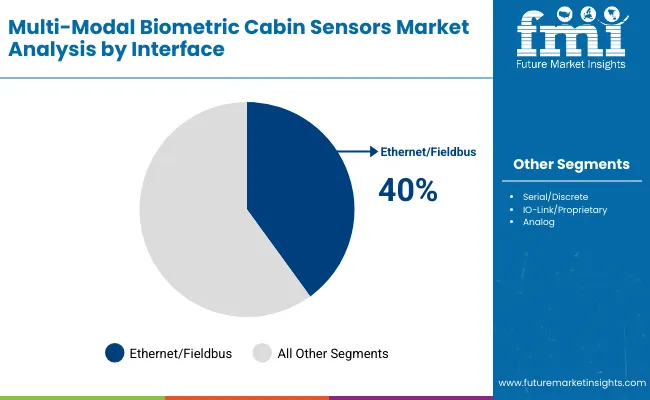
By Interface, Ethernet/Fieldbus Segment Dominates Market Connectivity

Multi Modal Biometric Cabin Sensors Market By Interface

Ethernet/Fieldbus applications represent the dominant segment of multi-modal biometric cabin sensors interface demand in 2025, accounting for 40.0% market share, underscoring their critical role as essential components for industrial communication operations. System integrators prefer ethernet/fieldbus connectivity for their operational reliability, data transmission capacity, and ability to support both standard operations and specialized applications while offering proven effectiveness in demanding industrial environments. Positioned as essential components for industrial connectivity, ethernet/fieldbus interfaces offer both communication capability and integration advantages.

The segment is supported by continuous growth in industrial automation programs and the growing availability of specialized connectivity variants that enable system differentiation and operational effectiveness at the industrial level. Additionally, automation providers are investing in advanced communication technologies to support real-time data transmission and operational accessibility. As industrial connectivity continues to gain priority and providers seek reliable solutions, ethernet/fieldbus applications will continue to dominate the market landscape while supporting operational excellence and system integration strategies.

What are the Drivers, Restraints, and Key Trends of the Multi-Modal Biometric Cabin Sensors Market?

The multi-modal biometric cabin sensors market is advancing steadily due to increasing security preference for biometric authentication systems and growing demand for multi-factor identification that emphasizes reliable verification across automotive and access control applications. However, the market faces challenges, including high development costs due to advanced sensor fusion requirements, technical complexity from multi-modal integration needs, and competition from single-mode biometric solutions. Innovation in AI-powered sensor systems and privacy protection integration continues to influence market development and expansion patterns.

Expansion of Automotive Security Applications

The growing adoption of multi-modal biometric cabin sensors in advanced vehicle security systems and automated authentication applications is enabling automotive manufacturers to develop vehicles that provide distinctive security capabilities while commanding premium positioning and enhanced safety characteristics. Automated security applications provide superior operational differentiation while allowing more sophisticated vehicle development across various automotive categories and safety segments. Automotive manufacturers are increasingly recognizing the competitive advantages of biometric integration for advanced security development and vehicle automation penetration.

Integration of AI and Machine Learning Technologies

Modern sensor manufacturers are incorporating artificial intelligence, deep learning algorithms, and behavioral analytics capabilities to enhance sensor performance, improve identification accuracy, and meet security demands for intelligent authentication solutions. These technologies enhance operational efficiency while enabling new applications, including adaptive learning and smart security systems for sensors. Advanced technology integration also allows suppliers to support premium market positioning and security trust building beyond traditional sensor supply relationships.
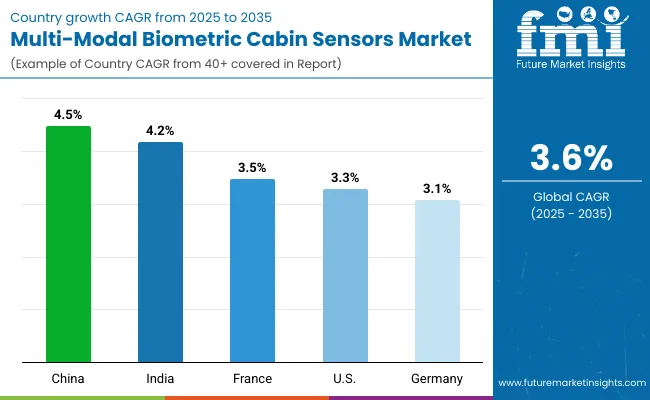
Analysis of the Multi-Modal Biometric Cabin Sensors Market by Key Country

Multi Modal Biometric Cabin Sensors Market By Country

Country CAGR (2025 to 2035)
China 4.5%
India 4.2%
France 3.5%
USA 3.3%
Germany 3.1%
UK 3.4%
Japan 3.2%

The multi-modal biometric cabin sensors market is experiencing steady growth globally, with China leading at a 4.5% CAGR through 2035, driven by the expanding automotive sector, growing security system adoption, and increasing biometric infrastructure development across industrial facilities. India follows at 4.2%, supported by rapid digitalization, rising automotive investments, and increasing demand for security solutions in emerging technology sectors.

The USA shows growth at 3.3%, emphasizing advanced automotive applications and security technology requirements. France records 3.5%, focusing on automotive innovation excellence and security system modernization. Germany demonstrates 3.1% growth, prioritizing precision automotive technology and advanced sensor integration. The UK exhibits 3.4% growth, supported by automotive security capabilities and biometric technology expertise. Japan shows 3.2% growth, emphasizing precision sensor manufacturing and technological innovation.

The report covers an in-depth analysis of 40+ countries; seven top-performing countries are highlighted below.

China Leads Global Market Growth with Automotive Sector Expansion

Revenue from multi-modal biometric cabin sensors in China is projected to exhibit robust growth with a CAGR of 4.5% through 2035, driven by the rapidly expanding automotive sector and increasing security system adoption across manufacturing facilities seeking advanced biometric solutions. The country's growing automotive infrastructure and strategic security technology development are creating substantial demand for biometric sensors in both traditional and advanced automotive applications. Major sensor manufacturers and automotive suppliers are establishing comprehensive production and distribution capabilities to serve both domestic security requirements and export markets.

  • Rising automotive sector development and expanding security system adoption are driving demand for biometric sensors across vehicle manufacturers, automotive suppliers, and security providers throughout major Chinese automotive centers.
  • Strong economic growth and increasing automotive investment toward advanced and security technologies are supporting the rapid adoption of biometric systems among automotive manufacturers seeking to meet evolving security requirements and competitive expectations.

India Demonstrates Strong Market Potential with Digital Infrastructure Impact

Revenue from multi-modal biometric cabin sensors in India is expanding at a CAGR of 4.2%, supported by rapid digitalization, increasing automotive facility investments, and growing focus on security infrastructure development requiring biometric solutions. The country's developing automotive sector and expanding digital infrastructure are driving demand for sensor systems across both traditional and modern security applications. International sensor companies and domestic manufacturers are establishing comprehensive distribution and production capabilities to address growing market demand for reliable biometric authentication.
  • Rising digitalization and expanding automotive capabilities are creating opportunities for biometric adoption across security establishments, automotive administrators, and infrastructure projects in major industrial regions throughout India.
  • Growing government focus on digital security and automotive development is driving adoption of biometric solutions among security providers seeking to meet digital standards and competitive objectives for operational effectiveness.

USA Maintains Strong Position with Advanced Automotive Focus

Multi Modal Biometric Cabin Sensors Market Usa

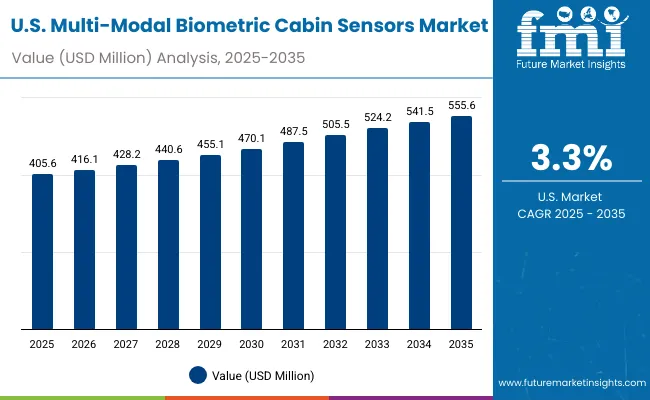
Revenue from multi-modal biometric cabin sensors in the United States is projected to grow at a CAGR of 3.3% through 2035, driven by the country's advanced automotive capabilities, security technology requirements, and continued focus on biometric solutions for critical applications. The USA's sophisticated automotive infrastructure and willingness to invest in sensor systems are creating substantial demand for both standard and specialized biometric variants. Leading automotive companies and technology suppliers are establishing comprehensive sourcing strategies to serve both automotive operations and specialized security markets.

  • Rising advanced automotive operations and security technology applications are driving demand for biometric systems across automotive contractors, vehicle manufacturers, and technology providers seeking reliable performance and proven operational effectiveness.
  • Strong automotive expertise and security sophistication are supporting the adoption of specialized and high-performance biometric systems among automotive organizations and vehicle manufacturers, prioritizing sensor reliability and operational precision.

France Strengthens Market with Automotive Innovation Excellence

Revenue from multi-modal biometric cabin sensors in France is projected to grow at a CAGR of 3.5% through 2035, supported by the country's advanced automotive innovation industry, vehicle security modernization sector, and established tradition of automotive excellence requiring high-quality sensor solutions. French automotive providers and vehicle manufacturers consistently demand superior biometric systems that meet exacting quality standards for both domestic operations and international automotive markets. The country's position as an automotive technology leader continues to drive innovation in sensor applications and quality standards.

  • Strong automotive innovation and vehicle security modernization industries are driving demand for advanced sensor systems across traditional vehicle manufacturers, automotive providers, and technology suppliers seeking to maintain France's reputation for automotive excellence.
  • Growing export of French automotive technologies and increasing international automotive cooperation are supporting the adoption of high-quality sensor solutions among automotive providers seeking to differentiate their vehicles in global markets.

Germany Anchors Growth with Precision Automotive Technology

Revenue from multi-modal biometric cabin sensors in Germany is projected to grow at a CAGR of 3.1% through 2035, supported by the country's precision automotive technology programs, expanding vehicle capabilities, and focus on advanced automotive infrastructure requiring sensor solutions. German automotive facilities prioritize operational effectiveness, technology reliability, and vehicle capability enhancement, making biometric sensors essential components for both domestic operations and regional automotive applications. The country's comprehensive automotive development programs and strategic emphasis support continued sensor market development.

  • Advanced precision automotive capabilities and vehicle infrastructure development are driving demand for specialized sensor solutions across automotive facilities, vehicle contractors, and technology providers serving German and regional markets.
  • Strong focus on vehicle capability enhancement and operational effectiveness is encouraging automotive organizations to adopt advanced sensor systems that support competitive positioning and meet German standards for automotive equipment.

UK Demonstrates Steady Growth with Automotive Excellence

Revenue from multi-modal biometric cabin sensors in the UK is projected to grow at a CAGR of 3.4% through 2035, supported by the country's advanced automotive industry, expertise in security technology, and established automotive tradition requiring high-quality sensor solutions. British automotive organizations' focus on operational excellence and proven technologies creates steady demand for reliable sensor systems and specialized variants. The country's attention to technology quality and operational effectiveness drives consistent adoption across both traditional and specialized automotive applications.

  • Advanced automotive industry and security technology expertise are driving steady demand for high-quality sensor systems across automotive contractors, vehicle manufacturers, and technology companies seeking proven performance and superior quality.
  • Strong automotive tradition and operational excellence focus are supporting the adoption of specialized sensor solutions among automotive organizations seeking to meet British standards and operational preferences for reliable technologies.

Japan Focuses on Precision Sensor Manufacturing and Innovation

Revenue from multi-modal biometric cabin sensors in Japan is projected to grow at a CAGR of 3.2% through 2035, supported by the country's advanced automotive capabilities, precision sensor expertise, and focus on developing high-quality automotive technologies. Japan's automotive sector continues to benefit from its reputation for producing superior precision products while working to address evolving automotive requirements and develop advanced sensor technologies through continuous innovation.
  • Advanced automotive capabilities and precision sensor expertise are driving the development of high-quality sensor systems that command premium positioning in specialized markets while supporting technological advancement and automotive excellence.
  • Growing focus on automotive technology development and precision sensor production is supporting the adoption of advanced sensor systems among automotive organizations seeking to ensure operational effectiveness and technological superiority.

Europe Market Split by Country

Multi Modal Biometric Cabin Sensors Market Europe

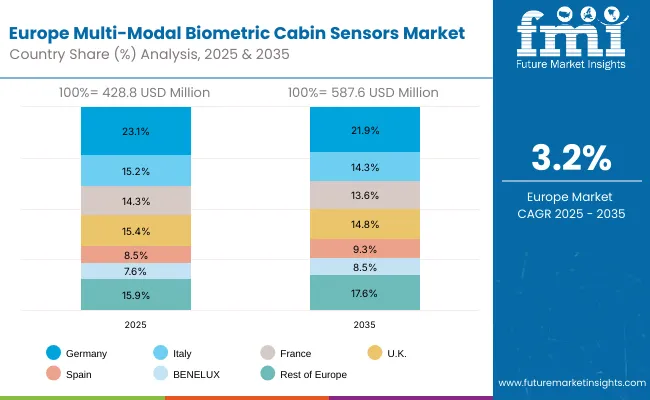
The multi-modal biometric cabin sensors market in Europe is projected to grow from USD 428.8 million in 2025 to USD 587.6 million by 2035, registering a CAGR of 3.2% over the forecast period. Germany is expected to maintain its leadership position with a 23.1% market share in 2025, declining slightly to 21.9% by 2035, supported by its advanced precision automotive sector and sensor technology manufacturing capabilities serving European and international markets.

The United Kingdom follows with a 15.9% share in 2025, projected to reach 17.6% by 2035, driven by established automotive expertise and security technology capabilities. France holds a 14.3% share in 2025, expected to reach 13.6% by 2035, supported by growing automotive innovation programs and sensor technology development. Italy commands a 15.2% share in 2025, projected to reach 14.3% by 2035, while Spain accounts for 8.5% in 2025, expected to reach 8.3% by 2035.

BENELUX maintains a 7.6% share in 2025, growing to 8.5% by 2035. The Rest of Europe region, including Nordic countries, Eastern Europe, and other European nations, is anticipated to hold 15.4% in 2025, declining to 15.8% by 2035, attributed to mixed growth patterns with steady expansion in some Eastern European markets balanced by slower growth in smaller Western European countries implementing automotive modernization programs.

Automotive-Centric Adoption Defines Japan’s Market Structure In Japan, the biometric cabin sensors market is primarily driven by automotive applications (52.8% share in 2025), reflecting the country’s strong automotive manufacturing base and rapid adoption of advanced driver and passenger monitoring systems. Automotive OEMs deploy facial recognition and voice-based biometrics to enhance driver safety, reduce distraction, and support regulatory compliance for intelligent transport systems. Aviation security (28.4%) remains the second-largest segment, spurred by Japan’s emphasis on border control, identity verification, and airport modernization. Building automation accounts for 18.8%, primarily in high-security facilities, though adoption is slower compared to transport-led use cases.

Market Characteristics

  • Automotive dominates biometric sensor demand (52.8%), supported by cabin monitoring regulations and driver-assistance integration.
  • Aviation sector expands steadily with airport security digitization and contactless boarding initiatives.
  • Preference for facial recognition (35% global share) and embedded systems (60% global share) reflects OEM-led integration models.
  • Japan’s biometric market growth (13.4% CAGR) is fueled by domestic innovation and international partnerships with cabin monitoring solution providers.

Technology Manufacturers Anchor South Korea’s Market Ecosystem In South Korea, the biometric cabin sensors market is structured around technology manufacturers (48.5% share in 2025), which collaborate with automotive OEMs (31.2%) and security companies (14.8%) to deploy multi-modal biometric solutions. Local electronics and semiconductor giants play a central role by supplying embedded biometric hardware and software platforms tailored for both automotive and aviation environments.

Automotive integration focuses on driver monitoring, fatigue detection, and personalized infotainment access, while security firms deploy biometric authentication in airports and high-security buildings. Collaboration between global biometric leaders and Korean tech manufacturers accelerates innovation, but international players such as NEC, Thales, and IDEMIA retain strong influence through advanced algorithm development.

Channel Insights
  • Technology manufacturers dominate the value chain (48.5%) by supplying biometric modules for automotive and aviation OEMs.
  • Automotive industry remains a high-growth vertical (31.2%), leveraging in-cabin safety regulations and personalized experience features.
  • Security sector adoption (14.8%) is reinforced by smart-city and infrastructure modernization projects.
  • South Korea’s growth trajectory (13.0% CAGR) is supported by domestic tech leadership and integration of AI-driven multi-modal authentication platforms.

Competitive Landscape of the Multi-Modal Biometric Cabin Sensors Market

Multi Modal Biometric Cabin Sensors Market By Company

The multi-modal biometric cabin sensors market is characterized by competition among established sensor manufacturers, specialized biometric technology producers, and integrated automotive suppliers. Companies are investing in advanced sensor technologies, artificial intelligence systems, accuracy enhancement processes, and comprehensive validation protocols to deliver consistent, high-performance, and reliable biometric solutions. Innovation in sensor fusion, multi-modal authentication, and specialized automotive applications is central to strengthening market position and customer confidence.

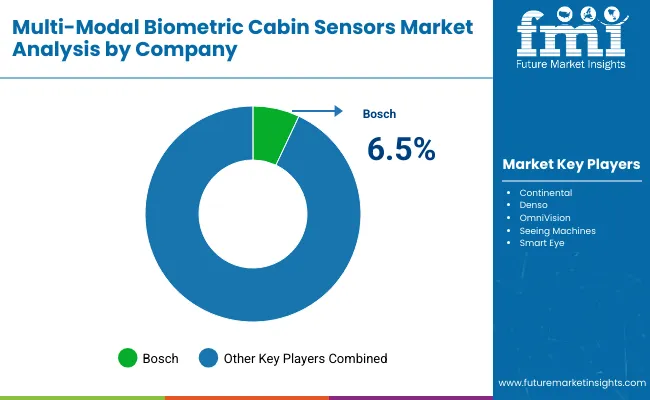
Bosch leads the market with a strong focus on automotive sensor innovation and precision manufacturing, offering comprehensive sensor solutions that emphasize quality assurance and operational reliability with a 6.5% market share. Continental provides integrated automotive sensor and electronic component capabilities with a focus on advanced engineering and global automotive networks. Denso delivers specialized automotive sensor systems with a focus on vehicle excellence and automotive applications. OmniVision specializes in imaging sensor solutions with emphasis on optical technology and visual recognition applications. Seeing Machines focuses on driver monitoring technology and automotive safety applications. Smart Eye emphasizes eye tracking and driver attention monitoring with a focus on automotive safety integration.

Global Multi-Modal Biometric Cabin Sensors Market - Stakeholder Contribution Framework

The global multi-modal biometric cabin sensors market represents a critical technology segment within automotive safety and security authentication, projected to grow from USD 1,786.7 million in 2025 to USD 2,554.4 million by 2035 at a CAGR of 3.6%. Optical/Imaging sensors dominate with 35% market share, serving primarily automotive and security applications that demand exceptional authentication accuracy, operational reliability, and extended service capabilities.

The market's expansion is driven by automotive safety adoption, security requirement enhancement, and growing emphasis on multi-factor authentication across critical security applications. Achieving sustained growth requires coordinated efforts across automotive policy makers, security standards organizations, sensor manufacturers, system integrators, and investment providers.

How Governments Could Accelerate Automotive Innovation and Market Growth?

Automotive Infrastructure Investment: Establish dedicated automotive technology zones and innovation hubs with specialized facilities for sensor development, including biometric testing centers, safety validation laboratories, and skilled workforce training institutes to support domestic automotive sensor capabilities.

R&D and Innovation Support: Fund research programs focused on advanced automotive sensors, AI integration with vehicle systems, and security authentication technologies. Support collaborative projects between universities, research institutes, and sensor manufacturers to develop next-generation automotive biometric solutions.

Skills Development Programs: Invest in technical education and vocational training programs that develop expertise in automotive electronics, biometric technology, sensor integration, and advanced manufacturing techniques required for automotive sensor production and deployment.

Regulatory Framework Development: Create comprehensive automotive standards for biometric sensors covering safety requirements, data privacy protocols, cybersecurity measures, and operational guidelines that ensure secure deployment while encouraging innovation in automotive biometrics.

Automotive Technology Adoption: Provide incentives for automotive manufacturers to adopt biometric solutions, establish pilot programs for sensor deployment, and create regulatory frameworks that support automotive safety technology investments.

How Industry Bodies Could Support Market Standardization and Technical Excellence?

Technical Standards Development: Establish comprehensive quality standards for automotive biometric sensors covering authentication accuracy, environmental durability, automotive compatibility, and performance criteria that ensure consistent quality across manufacturers and automotive applications.

Safety Certification Protocols: Develop standardized testing methodologies for automotive sensor evaluation including safety validation, authentication accuracy assessment, operational reliability testing, and automotive integration protocols that support procurement decisions.

Best Practices Documentation: Create technical guidelines for sensor deployment, authentication procedures, installation protocols, and maintenance methodologies that help automotive providers optimize sensor performance and ensure safety compliance across automotive applications.

Professional Certification Programs: Establish technical certification courses for automotive sensor specialists, integration engineers, and safety personnel to ensure industry-wide competency in automotive biometric technology and application expertise.

Market Intelligence & Analytics: Provide regular industry reports covering technology trends, automotive developments, competitive analysis, and emerging applications to guide strategic planning for manufacturers, integrators, and automotive providers across global markets.

How Sensor Manufacturers and Technology Providers Could Strengthen the Ecosystem?

Advanced Automotive Sensors: Develop precision automotive capabilities including multi-modal sensing systems, advanced authentication algorithms, environmental protection features, and automated safety protocols that ensure consistent performance meeting stringent automotive requirements.

AI Integration Capabilities: Incorporate machine learning, computer vision, and predictive analytics into sensor designs to enable intelligent authentication, adaptive security capabilities, and operational optimization for automotive system workflows.

Automotive Technology Innovation: Advanced automotive-specific features, including vibration resistance, temperature stability, automotive-grade components, and vehicle integration capabilities that improve operational effectiveness and ensure compliance with automotive standards.

Modular Automotive Platforms: Create standardized sensor families and modular automotive systems that enable rapid customization for specific vehicle applications while maintaining economies of scale and reducing development costs for specialized automotive requirements.

Technical Support Infrastructure: Establish comprehensive automotive support networks, including application engineering services, on-site technical assistance, training programs, and digital tools that help automotive providers deploy, integrate, and maintain optimal sensor solutions.

How Automotive Manufacturers Could Navigate Technology Adoption?

Integrated Design Strategies: Develop sensor integration approaches that optimize vehicle design around biometric capabilities, including user interface development, security protocol implementation, and privacy protection measures to maximize sensor effectiveness and vehicle safety.

Vendor Partnership Development: Build strategic relationships with sensor manufacturers that provide early access to automotive technologies, collaborative development opportunities, and guaranteed supply security for critical automotive applications requiring specialized sensor solutions.

Security System Integration: Implement biometric systems and security protocols that leverage automotive authentication to optimize vehicle access control, reduce security risks, and improve overall automotive safety while maintaining user convenience.

Application-Specific Solutions: Develop specialized sensor requirements for specific automotive applications including driver monitoring, passenger identification, vehicle access control, and fleet management that require unique performance characteristics and safety features.

Quality Assurance Programs: Establish comprehensive sensor validation procedures including automotive testing, safety verification, and supplier qualification processes that ensure consistent quality and performance across automotive sensor deployments.

How Investors and Financial Partners Could Unlock Market Value?

Technology Development Funding: Finance advanced research facilities, sensor development systems, and automotive technology investments that enable sensor manufacturers to scale innovation capabilities and meet growing automotive demand for biometric solutions.

Automotive Innovation Capital: Provide venture capital and growth funding for automotive sensor startups developing AI-powered systems, advanced biometric sensors, innovative automotive applications, and digital solutions that advance sensor capabilities in vehicle environments.

Market Expansion Investment: Support automotive market development initiatives, including vehicle manufacturer partnerships, safety validation programs, regulatory approval processes, and automotive provider relationships in high-growth automotive markets.

Automotive Integration Support: Finance vertical integration strategies that combine sensor manufacturing with automotive technology development, vehicle component production, and integration support capabilities to create more comprehensive automotive biometric solutions.

Industry Consolidation Facilitation: Support strategic mergers and acquisitions that create larger, more capable automotive sensor organizations with enhanced automotive expertise, broader technology portfolios, and global automotive reach necessary to serve major vehicle manufacturers effectively.

Key Players in the Multi-Modal Biometric Cabin Sensors Market

  • Bosch
  • Continental
  • Denso
  • OmniVision
  • Seeing Machines
  • Smart Eye
  • Valeo
  • NXP Semiconductors
  • Infineon Technologies
  • STMicroelectronics
  • Magna International
  • Aptiv
  • Veoneer
  • ZF Friedrichshafen
  • Gentex Corporation

Scope of the Report

Items Values
Quantitative Units (2025) USD 1,786.7 Million
Measurement Principle Optical/Imaging, Electromagnetic/Inductive, Acoustic/Ultrasonic, Other
Interface Ethernet/Fieldbus, Serial/Discrete, I2C Line/Proprietary, Analog
Form Factor Fixed, Portable, Embedded/Board-Level
End-Use Sector Electronics/Semiconductor, F&B/Packaging, Industrial Process, Others
Regions Covered North America, Europe, East Asia, South Asia & Pacific, Latin America, Middle East & Africa
Countries Covered China, India, France, the United States, Germany, the United Kingdom, Japan and 40+ countries
Key Companies Profiled Bosch, Continental, Denso, OmniVision, Seeing Machines, Smart Eye, Valeo, NXP Semiconductors, Infineon Technologies, STMicroelectronics, Magna International, Aptiv, Veoneer, ZF Friedrichshafen, Gentex Corporation
Additional Attributes Dollar sales by measurement principle and end-use sector, regional demand trends, competitive landscape, technological advancements in sensor design, multi-modal integration capabilities, automotive safety programs, and biometric authentication strategies

Multi-Modal Biometric Cabin Sensors Market by Segments

By Measurement Principle:

  • Optical/Imaging
  • Electromagnetic/Inductive
  • Acoustic/Ultrasonic
  • Other

By Interface:

  • Ethernet/Fieldbus
  • Serial/Discrete
  • I2C Line/Proprietary
  • Analog

By Form Factor:

  • Fixed
  • Portable
  • Embedded/Board-Level

By End-Use Sector:

  • Electronics/Semiconductor
  • F&B/Packaging
  • Industrial Process
  • Others

By Region:

By North America

  • United States
  • Canada
  • Mexico

By Europe

  • Germany
  • United Kingdom
  • France
  • Italy
  • Spain
  • Nordic
  • BENELUX
  • Rest of Europe

By East Asia

  • China
  • Japan
  • South Korea

By South Asia & Pacific

  • India
  • ASEAN
  • Australia & New Zealand
  • Rest of South Asia & Pacific

By Latin America

  • Brazil
  • Chile
  • Rest of Latin America

By Middle East & Africa

  • Kingdom of Saudi Arabia
  • Other GCC Countries
  • Turkiye
  • South Africa
  • Other African Union
  • Rest of Middle East & Africa

Table of Content

  1. Executive Summary
    • Global Market Outlook
    • Demand-side Trends
    • Supply-side Trends
    • Technology Roadmap Analysis
    • Analysis and Recommendations
  2. Market Overview
    • Market Coverage / Taxonomy
    • Market Definition / Scope / Limitations
  3. Market Background
    • Market Dynamics
      • Drivers
      • Restraints
      • Opportunity
      • Trends
    • Scenario Forecast
      • Demand in Optimistic Scenario
      • Demand in Likely Scenario
      • Demand in Conservative Scenario
    • Opportunity Map Analysis
    • Product Life Cycle Analysis
    • Supply Chain Analysis
      • Supply Side Participants and their Roles
        • Producers
        • Mid-Level Participants (Traders/ Agents/ Brokers)
        • Wholesalers and Distributors
      • Value Added and Value Created at Node in the Supply Chain
      • List of Raw Material Suppliers
      • List of Existing and Potential Buyer's
    • Investment Feasibility Matrix
    • Value Chain Analysis
      • Profit Margin Analysis
      • Wholesalers and Distributors
      • Retailers
    • PESTLE and Porter's Analysis
    • Regulatory Landscape
      • By Key Regions
      • By Key Countries
    • Regional Parent Market Outlook
    • Production and Consumption Statistics
    • Import and Export Statistics
  4. Global Market Analysis 2020 to 2024 and Forecast, 2025 to 2035
    • Historical Market Size Value (USD Million) Analysis, 2020 to 2024
    • Current and Future Market Size Value (USD Million) Projections, 2025 to 2035
      • Y-o-Y Growth Trend Analysis
      • Absolute $ Opportunity Analysis
  5. Global Market Pricing Analysis 2020 to 2024 and Forecast 2025 to 2035
  6. Global Market Analysis 2020 to 2024 and Forecast 2025 to 2035, By Measurement Principle
    • Introduction / Key Findings
    • Historical Market Size Value (USD Million) Analysis By Measurement Principle, 2020 to 2024
    • Current and Future Market Size Value (USD Million) Analysis and Forecast By Measurement Principle, 2025 to 2035
      • Optical/Imaging
      • Electromagnetic/Inductive
      • Acoustic/Ultrasonic
      • Other
    • Y-o-Y Growth Trend Analysis By Measurement Principle, 2020 to 2024
    • Absolute $ Opportunity Analysis By Measurement Principle, 2025 to 2035
  7. Global Market Analysis 2020 to 2024 and Forecast 2025 to 2035, By Interface
    • Introduction / Key Findings
    • Historical Market Size Value (USD Million) Analysis By Interface, 2020 to 2024
    • Current and Future Market Size Value (USD Million) Analysis and Forecast By Interface, 2025 to 2035
      • Ethernet/Fieldbus
      • Serial/Discrete
      • I2C Line/Proprietary
      • Analog
    • Y-o-Y Growth Trend Analysis By Interface, 2020 to 2024
    • Absolute $ Opportunity Analysis By Interface, 2025 to 2035
  8. Global Market Analysis 2020 to 2024 and Forecast 2025 to 2035, By Form Factor
    • Introduction / Key Findings
    • Historical Market Size Value (USD Million) Analysis By Form Factor, 2020 to 2024
    • Current and Future Market Size Value (USD Million) Analysis and Forecast By Form Factor, 2025 to 2035
      • Fixed
      • Portable
      • Embedded/Board-Level
    • Y-o-Y Growth Trend Analysis By Form Factor, 2020 to 2024
    • Absolute $ Opportunity Analysis By Form Factor, 2025 to 2035
  9. Global Market Analysis 2020 to 2024 and Forecast 2025 to 2035, By End-Use Sector
    • Introduction / Key Findings
    • Historical Market Size Value (USD Million) Analysis By End-Use Sector, 2020 to 2024
    • Current and Future Market Size Value (USD Million) Analysis and Forecast By End-Use Sector, 2025 to 2035
      • Electronics/Semiconductor
      • F&B/Packaging
      • Industrial Process
      • Others
    • Y-o-Y Growth Trend Analysis By End-Use Sector, 2020 to 2024
    • Absolute $ Opportunity Analysis By End-Use Sector, 2025 to 2035
  10. Global Market Analysis 2020 to 2024 and Forecast 2025 to 2035, By Region
    • Introduction
    • Historical Market Size Value (USD Million) Analysis By Region, 2020 to 2024
    • Current Market Size Value (USD Million) Analysis and Forecast By Region, 2025 to 2035
      • North America
      • Europe
      • East Asia
      • South Asia & Pacific
      • Latin America
      • Middle East & Africa
    • Market Attractiveness Analysis By Region
  11. North America Market Analysis 2020 to 2024 and Forecast 2025 to 2035, By Country
    • Historical Market Size Value (USD Million) Trend Analysis By Market Taxonomy, 2020 to 2024
    • Market Size Value (USD Million) Forecast By Market Taxonomy, 2025 to 2035
      • By Country
        • United States
        • Canada
        • Mexico
      • By Measurement Principle
      • By Interface
      • By Form Factor
      • By End-Use Sector
    • Market Attractiveness Analysis
      • By Country
      • By Measurement Principle
      • By Interface
      • By Form Factor
      • By End-Use Sector
    • Key Takeaways
  12. Europe Market Analysis 2020 to 2024 and Forecast 2025 to 2035, By Country
    • Historical Market Size Value (USD Million) Trend Analysis By Market Taxonomy, 2020 to 2024
    • Market Size Value (USD Million) Forecast By Market Taxonomy, 2025 to 2035
      • By Country
        • Germany
        • United Kingdom
        • France
        • Italy
        • Spain
        • Nordic
        • BENELUX
        • Rest of Europe
      • By Measurement Principle
      • By Interface
      • By Form Factor
      • By End-Use Sector
    • Market Attractiveness Analysis
      • By Country
      • By Measurement Principle
      • By Interface
      • By Form Factor
      • By End-Use Sector
    • Key Takeaways
  13. East Asia Market Analysis 2020 to 2024 and Forecast 2025 to 2035, By Country
    • Historical Market Size Value (USD Million) Trend Analysis By Market Taxonomy, 2020 to 2024
    • Market Size Value (USD Million) Forecast By Market Taxonomy, 2025 to 2035
      • By Country
        • China
        • Japan
        • South Korea
      • By Measurement Principle
      • By Interface
      • By Form Factor
      • By End-Use Sector
    • Market Attractiveness Analysis
      • By Country
      • By Measurement Principle
      • By Interface
      • By Form Factor
      • By End-Use Sector
    • Key Takeaways
  14. South Asia & Pacific Market Analysis 2020 to 2024 and Forecast 2025 to 2035, By Country
    • Historical Market Size Value (USD Million) Trend Analysis By Market Taxonomy, 2020 to 2024
    • Market Size Value (USD Million) Forecast By Market Taxonomy, 2025 to 2035
      • By Country
        • India
        • ASEAN
        • Australia & New Zealand
        • Rest of South Asia & Pacific
      • By Measurement Principle
      • By Interface
      • By Form Factor
      • By End-Use Sector
    • Market Attractiveness Analysis
      • By Country
      • By Measurement Principle
      • By Interface
      • By Form Factor
      • By End-Use Sector
    • Key Takeaways
  15. Latin America Market Analysis 2020 to 2024 and Forecast 2025 to 2035, By Country
    • Historical Market Size Value (USD Million) Trend Analysis By Market Taxonomy, 2020 to 2024
    • Market Size Value (USD Million) Forecast By Market Taxonomy, 2025 to 2035
      • By Country
        • Brazil
        • Chile
        • Rest of Latin America
      • By Measurement Principle
      • By Interface
      • By Form Factor
      • By End-Use Sector
    • Market Attractiveness Analysis
      • By Country
      • By Measurement Principle
      • By Interface
      • By Form Factor
      • By End-Use Sector
    • Key Takeaways
  16. Middle East & Africa Market Analysis 2020 to 2024 and Forecast 2025 to 2035, By Country
    • Historical Market Size Value (USD Million) Trend Analysis By Market Taxonomy, 2020 to 2024
    • Market Size Value (USD Million) Forecast By Market Taxonomy, 2025 to 2035
      • By Country
        • Kingdom of Saudi Arabia
        • Other GCC Countries
        • Turkiye
        • South Africa
        • Other African Union
        • Rest of Middle East & Africa
      • By Measurement Principle
      • By Interface
      • By Form Factor
      • By End-Use Sector
    • Market Attractiveness Analysis
      • By Country
      • By Measurement Principle
      • By Interface
      • By Form Factor
      • By End-Use Sector
    • Key Takeaways
  17. Key Countries Market Analysis
    • United States
      • Pricing Analysis
      • Market Share Analysis, 2024
        • By Measurement Principle
        • By Interface
        • By Form Factor
        • By End-Use Sector
    • China
      • Pricing Analysis
      • Market Share Analysis, 2024
        • By Measurement Principle
        • By Interface
        • By Form Factor
        • By End-Use Sector
    • Germany
      • Pricing Analysis
      • Market Share Analysis, 2024
        • By Measurement Principle
        • By Interface
        • By Form Factor
        • By End-Use Sector
    • India
      • Pricing Analysis
      • Market Share Analysis, 2024
        • By Measurement Principle
        • By Interface
        • By Form Factor
        • By End-Use Sector
    • France
      • Pricing Analysis
      • Market Share Analysis, 2024
        • By Measurement Principle
        • By Interface
        • By Form Factor
        • By End-Use Sector
    • United Kingdom
      • Pricing Analysis
      • Market Share Analysis, 2024
        • By Measurement Principle
        • By Interface
        • By Form Factor
        • By End-Use Sector
    • Japan
      • Pricing Analysis
      • Market Share Analysis, 2024
        • By Measurement Principle
        • By Interface
        • By Form Factor
        • By End-Use Sector
    • South Korea
      • Pricing Analysis
      • Market Share Analysis, 2024
        • By Measurement Principle
        • By Interface
        • By Form Factor
        • By End-Use Sector
  18. Market Structure Analysis
    • Competition Dashboard
    • Competition Benchmarking
    • Market Share Analysis of Top Players
      • By Regional
      • By Measurement Principle
      • By Interface
      • By Form Factor
      • By End-Use Sector
  19. Competition Analysis
    • Competition Deep Dive
      • Bosch
        • Overview
        • Product Portfolio
        • Profitability by Market Segments (Product/Sales Channel/Region)
        • Sales Footprint
        • Strategy Overview
          • Marketing Strategy
          • Product Strategy
          • Channel Strategy
      • Continental
        • Overview
        • Product Portfolio
        • Profitability by Market Segments (Product/Sales Channel/Region)
        • Sales Footprint
        • Strategy Overview
          • Marketing Strategy
          • Product Strategy
          • Channel Strategy
      • Denso
        • Overview
        • Product Portfolio
        • Profitability by Market Segments (Product/Sales Channel/Region)
        • Sales Footprint
        • Strategy Overview
          • Marketing Strategy
          • Product Strategy
          • Channel Strategy
      • OmniVision
        • Overview
        • Product Portfolio
        • Profitability by Market Segments (Product/Sales Channel/Region)
        • Sales Footprint
        • Strategy Overview
          • Marketing Strategy
          • Product Strategy
          • Channel Strategy
      • Seeing Machines
        • Overview
        • Product Portfolio
        • Profitability by Market Segments (Product/Sales Channel/Region)
        • Sales Footprint
        • Strategy Overview
          • Marketing Strategy
          • Product Strategy
          • Channel Strategy
      • Smart Eye
        • Overview
        • Product Portfolio
        • Profitability by Market Segments (Product/Sales Channel/Region)
        • Sales Footprint
        • Strategy Overview
          • Marketing Strategy
          • Product Strategy
          • Channel Strategy
      • Valeo
        • Overview
        • Product Portfolio
        • Profitability by Market Segments (Product/Sales Channel/Region)
        • Sales Footprint
        • Strategy Overview
          • Marketing Strategy
          • Product Strategy
          • Channel Strategy
      • NXP Semiconductors
        • Overview
        • Product Portfolio
        • Profitability by Market Segments (Product/Sales Channel/Region)
        • Sales Footprint
        • Strategy Overview
          • Marketing Strategy
          • Product Strategy
          • Channel Strategy
      • Infineon Technologies
        • Overview
        • Product Portfolio
        • Profitability by Market Segments (Product/Sales Channel/Region)
        • Sales Footprint
        • Strategy Overview
          • Marketing Strategy
          • Product Strategy
          • Channel Strategy
      • STMicroelectronics
        • Overview
        • Product Portfolio
        • Profitability by Market Segments (Product/Sales Channel/Region)
        • Sales Footprint
        • Strategy Overview
          • Marketing Strategy
          • Product Strategy
          • Channel Strategy
      • Magna International
        • Overview
        • Product Portfolio
        • Profitability by Market Segments (Product/Sales Channel/Region)
        • Sales Footprint
        • Strategy Overview
          • Marketing Strategy
          • Product Strategy
          • Channel Strategy
      • Aptiv
        • Overview
        • Product Portfolio
        • Profitability by Market Segments (Product/Sales Channel/Region)
        • Sales Footprint
        • Strategy Overview
          • Marketing Strategy
          • Product Strategy
          • Channel Strategy
      • Veoneer
        • Overview
        • Product Portfolio
        • Profitability by Market Segments (Product/Sales Channel/Region)
        • Sales Footprint
        • Strategy Overview
          • Marketing Strategy
          • Product Strategy
          • Channel Strategy
      • ZF Friedrichshafen
        • Overview
        • Product Portfolio
        • Profitability by Market Segments (Product/Sales Channel/Region)
        • Sales Footprint
        • Strategy Overview
          • Marketing Strategy
          • Product Strategy
          • Channel Strategy
      • Gentex Corporation
        • Overview
        • Product Portfolio
        • Profitability by Market Segments (Product/Sales Channel/Region)
        • Sales Footprint
        • Strategy Overview
          • Marketing Strategy
          • Product Strategy
          • Channel Strategy
  20. Assumptions & Acronyms Used
  21. Research Methodology

List of Tables

  • Table 1: Global Market Value (USD Million) Forecast by Region, 2020-2035
  • Table 2: Global Market Value (USD Million) Forecast by Measurement Principle, 2020-2035
  • Table 3: Global Market Value (USD Million) Forecast by Interface, 2020-2035
  • Table 4: Global Market Value (USD Million) Forecast by Form Factor, 2020-2035
  • Table 5: Global Market Value (USD Million) Forecast by End-Use Sector, 2020-2035
  • Table 6: North America Market Value (USD Million) Forecast by Country, 2020-2035
  • Table 7: North America Market Value (USD Million) Forecast by Measurement Principle, 2020-2035
  • Table 8: North America Market Value (USD Million) Forecast by Interface, 2020-2035
  • Table 9: North America Market Value (USD Million) Forecast by Form Factor, 2020-2035
  • Table 10: North America Market Value (USD Million) Forecast by End-Use Sector, 2020-2035
  • Table 11: Europe Market Value (USD Million) Forecast by Country, 2020-2035
  • Table 12: Europe Market Value (USD Million) Forecast by Measurement Principle, 2020-2035
  • Table 13: Europe Market Value (USD Million) Forecast by Interface, 2020-2035
  • Table 14: Europe Market Value (USD Million) Forecast by Form Factor, 2020-2035
  • Table 15: Europe Market Value (USD Million) Forecast by End-Use Sector, 2020-2035
  • Table 16: East Asia Market Value (USD Million) Forecast by Country, 2020-2035
  • Table 17: East Asia Market Value (USD Million) Forecast by Measurement Principle, 2020-2035
  • Table 18: East Asia Market Value (USD Million) Forecast by Interface, 2020-2035
  • Table 19: East Asia Market Value (USD Million) Forecast by Form Factor, 2020-2035
  • Table 20: East Asia Market Value (USD Million) Forecast by End-Use Sector, 2020-2035
  • Table 21: South Asia & Pacific Market Value (USD Million) Forecast by Country, 2020-2035
  • Table 22: South Asia & Pacific Market Value (USD Million) Forecast by Measurement Principle, 2020-2035
  • Table 23: South Asia & Pacific Market Value (USD Million) Forecast by Interface, 2020-2035
  • Table 24: South Asia & Pacific Market Value (USD Million) Forecast by Form Factor, 2020-2035
  • Table 25: South Asia & Pacific Market Value (USD Million) Forecast by End-Use Sector, 2020-2035
  • Table 26: Latin America Market Value (USD Million) Forecast by Country, 2020-2035
  • Table 27: Latin America Market Value (USD Million) Forecast by Measurement Principle, 2020-2035
  • Table 28: Latin America Market Value (USD Million) Forecast by Interface, 2020-2035
  • Table 29: Latin America Market Value (USD Million) Forecast by Form Factor, 2020-2035
  • Table 30: Latin America Market Value (USD Million) Forecast by End-Use Sector, 2020-2035
  • Table 31: Middle East & Africa Market Value (USD Million) Forecast by Country, 2020-2035
  • Table 32: Middle East & Africa Market Value (USD Million) Forecast by Measurement Principle, 2020-2035
  • Table 33: Middle East & Africa Market Value (USD Million) Forecast by Interface, 2020-2035
  • Table 34: Middle East & Africa Market Value (USD Million) Forecast by Form Factor, 2020-2035
  • Table 35: Middle East & Africa Market Value (USD Million) Forecast by End-Use Sector, 2020-2035
  • Table 36: United States Market Value (USD Million) Forecast by Measurement Principle, 2020-2035
  • Table 37: United States Market Value (USD Million) Forecast by Interface, 2020-2035
  • Table 38: United States Market Value (USD Million) Forecast by Form Factor, 2020-2035
  • Table 39: United States Market Value (USD Million) Forecast by End-Use Sector, 2020-2035
  • Table 40: Canada Market Value (USD Million) Forecast by Measurement Principle, 2020-2035
  • Table 41: Canada Market Value (USD Million) Forecast by Interface, 2020-2035
  • Table 42: Canada Market Value (USD Million) Forecast by Form Factor, 2020-2035
  • Table 43: Canada Market Value (USD Million) Forecast by End-Use Sector, 2020-2035
  • Table 44: Mexico Market Value (USD Million) Forecast by Measurement Principle, 2020-2035
  • Table 45: Mexico Market Value (USD Million) Forecast by Interface, 2020-2035
  • Table 46: Mexico Market Value (USD Million) Forecast by Form Factor, 2020-2035
  • Table 47: Mexico Market Value (USD Million) Forecast by End-Use Sector, 2020-2035
  • Table 48: Germany Market Value (USD Million) Forecast by Measurement Principle, 2020-2035
  • Table 49: Germany Market Value (USD Million) Forecast by Interface, 2020-2035
  • Table 50: Germany Market Value (USD Million) Forecast by Form Factor, 2020-2035
  • Table 51: Germany Market Value (USD Million) Forecast by End-Use Sector, 2020-2035
  • Table 52: United Kingdom Market Value (USD Million) Forecast by Measurement Principle, 2020-2035
  • Table 53: United Kingdom Market Value (USD Million) Forecast by Interface, 2020-2035
  • Table 54: United Kingdom Market Value (USD Million) Forecast by Form Factor, 2020-2035
  • Table 55: United Kingdom Market Value (USD Million) Forecast by End-Use Sector, 2020-2035
  • Table 56: France Market Value (USD Million) Forecast by Measurement Principle, 2020-2035
  • Table 57: France Market Value (USD Million) Forecast by Interface, 2020-2035
  • Table 58: France Market Value (USD Million) Forecast by Form Factor, 2020-2035
  • Table 59: France Market Value (USD Million) Forecast by End-Use Sector, 2020-2035
  • Table 60: Italy Market Value (USD Million) Forecast by Measurement Principle, 2020-2035
  • Table 61: Italy Market Value (USD Million) Forecast by Interface, 2020-2035
  • Table 62: Italy Market Value (USD Million) Forecast by Form Factor, 2020-2035
  • Table 63: Italy Market Value (USD Million) Forecast by End-Use Sector, 2020-2035
  • Table 64: Spain Market Value (USD Million) Forecast by Measurement Principle, 2020-2035
  • Table 65: Spain Market Value (USD Million) Forecast by Interface, 2020-2035
  • Table 66: Spain Market Value (USD Million) Forecast by Form Factor, 2020-2035
  • Table 67: Spain Market Value (USD Million) Forecast by End-Use Sector, 2020-2035
  • Table 68: China Market Value (USD Million) Forecast by Measurement Principle, 2020-2035
  • Table 69: China Market Value (USD Million) Forecast by Interface, 2020-2035
  • Table 70: China Market Value (USD Million) Forecast by Form Factor, 2020-2035
  • Table 71: China Market Value (USD Million) Forecast by End-Use Sector, 2020-2035
  • Table 72: Japan Market Value (USD Million) Forecast by Measurement Principle, 2020-2035
  • Table 73: Japan Market Value (USD Million) Forecast by Interface, 2020-2035
  • Table 74: Japan Market Value (USD Million) Forecast by Form Factor, 2020-2035
  • Table 75: Japan Market Value (USD Million) Forecast by End-Use Sector, 2020-2035
  • Table 76: South Korea Market Value (USD Million) Forecast by Measurement Principle, 2020-2035
  • Table 77: South Korea Market Value (USD Million) Forecast by Interface, 2020-2035
  • Table 78: South Korea Market Value (USD Million) Forecast by Form Factor, 2020-2035
  • Table 79: South Korea Market Value (USD Million) Forecast by End-Use Sector, 2020-2035
  • Table 80: India Market Value (USD Million) Forecast by Measurement Principle, 2020-2035
  • Table 81: India Market Value (USD Million) Forecast by Interface, 2020-2035
  • Table 82: India Market Value (USD Million) Forecast by Form Factor, 2020-2035
  • Table 83: India Market Value (USD Million) Forecast by End-Use Sector, 2020-2035
  • Table 84: ASEAN Market Value (USD Million) Forecast by Measurement Principle, 2020-2035
  • Table 85: ASEAN Market Value (USD Million) Forecast by Interface, 2020-2035
  • Table 86: ASEAN Market Value (USD Million) Forecast by Form Factor, 2020-2035
  • Table 87: ASEAN Market Value (USD Million) Forecast by End-Use Sector, 2020-2035
  • Table 88: Australia & New Zealand Market Value (USD Million) Forecast by Measurement Principle, 2020-2035
  • Table 89: Australia & New Zealand Market Value (USD Million) Forecast by Interface, 2020-2035
  • Table 90: Australia & New Zealand Market Value (USD Million) Forecast by Form Factor, 2020-2035
  • Table 91: Australia & New Zealand Market Value (USD Million) Forecast by End-Use Sector, 2020-2035
  • Table 92: Brazil Market Value (USD Million) Forecast by Measurement Principle, 2020-2035
  • Table 93: Brazil Market Value (USD Million) Forecast by Interface, 2020-2035
  • Table 94: Brazil Market Value (USD Million) Forecast by Form Factor, 2020-2035
  • Table 95: Brazil Market Value (USD Million) Forecast by End-Use Sector, 2020-2035
  • Table 96: Chile Market Value (USD Million) Forecast by Measurement Principle, 2020-2035
  • Table 97: Chile Market Value (USD Million) Forecast by Interface, 2020-2035
  • Table 98: Chile Market Value (USD Million) Forecast by Form Factor, 2020-2035
  • Table 99: Chile Market Value (USD Million) Forecast by End-Use Sector, 2020-2035
  • Table 100: Kingdom of Saudi Arabia Market Value (USD Million) Forecast by Measurement Principle, 2020-2035
  • Table 101: Kingdom of Saudi Arabia Market Value (USD Million) Forecast by Interface, 2020-2035
  • Table 102: Kingdom of Saudi Arabia Market Value (USD Million) Forecast by Form Factor, 2020-2035
  • Table 103: Kingdom of Saudi Arabia Market Value (USD Million) Forecast by End-Use Sector, 2020-2035
  • Table 104: Other GCC Countries Market Value (USD Million) Forecast by Measurement Principle, 2020-2035
  • Table 105: Other GCC Countries Market Value (USD Million) Forecast by Interface, 2020-2035
  • Table 106: Other GCC Countries Market Value (USD Million) Forecast by Form Factor, 2020-2035
  • Table 107: Other GCC Countries Market Value (USD Million) Forecast by End-Use Sector, 2020-2035
  • Table 108: Turkiye Market Value (USD Million) Forecast by Measurement Principle, 2020-2035
  • Table 109: Turkiye Market Value (USD Million) Forecast by Interface, 2020-2035
  • Table 110: Turkiye Market Value (USD Million) Forecast by Form Factor, 2020-2035
  • Table 111: Turkiye Market Value (USD Million) Forecast by End-Use Sector, 2020-2035
  • Table 112: South Africa Market Value (USD Million) Forecast by Measurement Principle, 2020-2035
  • Table 113: South Africa Market Value (USD Million) Forecast by Interface, 2020-2035
  • Table 114: South Africa Market Value (USD Million) Forecast by Form Factor, 2020-2035
  • Table 115: South Africa Market Value (USD Million) Forecast by End-Use Sector, 2020-2035
  • Table 116: Other African Union Market Value (USD Million) Forecast by Measurement Principle, 2020-2035
  • Table 117: Other African Union Market Value (USD Million) Forecast by Interface, 2020-2035
  • Table 118: Other African Union Market Value (USD Million) Forecast by Form Factor, 2020-2035
  • Table 119: Other African Union Market Value (USD Million) Forecast by End-Use Sector, 2020-2035
  • Table 120: Nordic Market Value (USD Million) Forecast by Measurement Principle, 2020-2035
  • Table 121: Nordic Market Value (USD Million) Forecast by Interface, 2020-2035
  • Table 122: Nordic Market Value (USD Million) Forecast by Form Factor, 2020-2035
  • Table 123: Nordic Market Value (USD Million) Forecast by End-Use Sector, 2020-2035
  • Table 124: BENELUX Market Value (USD Million) Forecast by Measurement Principle, 2020-2035
  • Table 125: BENELUX Market Value (USD Million) Forecast by Interface, 2020-2035
  • Table 126: BENELUX Market Value (USD Million) Forecast by Form Factor, 2020-2035
  • Table 127: BENELUX Market Value (USD Million) Forecast by End-Use Sector, 2020-2035
  • Table 128: Rest of Europe Market Value (USD Million) Forecast by Measurement Principle, 2020-2035
  • Table 129: Rest of Europe Market Value (USD Million) Forecast by Interface, 2020-2035
  • Table 130: Rest of Europe Market Value (USD Million) Forecast by Form Factor, 2020-2035
  • Table 131: Rest of Europe Market Value (USD Million) Forecast by End-Use Sector, 2020-2035
  • Table 132: Rest of South Asia & Pacific Market Value (USD Million) Forecast by Measurement Principle, 2020-2035
  • Table 133: Rest of South Asia & Pacific Market Value (USD Million) Forecast by Interface, 2020-2035
  • Table 134: Rest of South Asia & Pacific Market Value (USD Million) Forecast by Form Factor, 2020-2035
  • Table 135: Rest of South Asia & Pacific Market Value (USD Million) Forecast by End-Use Sector, 2020-2035
  • Table 136: Rest of Latin America Market Value (USD Million) Forecast by Measurement Principle, 2020-2035
  • Table 137: Rest of Latin America Market Value (USD Million) Forecast by Interface, 2020-2035
  • Table 138: Rest of Latin America Market Value (USD Million) Forecast by Form Factor, 2020-2035
  • Table 139: Rest of Latin America Market Value (USD Million) Forecast by End-Use Sector, 2020-2035
  • Table 140: Rest of Middle East & Africa Market Value (USD Million) Forecast by Measurement Principle, 2020-2035
  • Table 141: Rest of Middle East & Africa Market Value (USD Million) Forecast by Interface, 2020-2035
  • Table 142: Rest of Middle East & Africa Market Value (USD Million) Forecast by Form Factor, 2020-2035
  • Table 143: Rest of Middle East & Africa Market Value (USD Million) Forecast by End-Use Sector, 2020-2035
  • Table 144: Global Market Volume (Units) Forecast by Region, 2020-2035
  • Table 145: Global Market Volume (Units) Forecast by Measurement Principle, 2020-2035
  • Table 146: Global Market Volume (Units) Forecast by Interface, 2020-2035
  • Table 147: Global Market Volume (Units) Forecast by Form Factor, 2020-2035
  • Table 148: Global Market Volume (Units) Forecast by End-Use Sector, 2020-2035
  • Table 149: North America Market Volume (Units) Forecast by Country, 2020-2035
  • Table 150: North America Market Volume (Units) Forecast by Measurement Principle, 2020-2035
  • Table 151: North America Market Volume (Units) Forecast by Interface, 2020-2035
  • Table 152: North America Market Volume (Units) Forecast by Form Factor, 2020-2035
  • Table 153: North America Market Volume (Units) Forecast by End-Use Sector, 2020-2035
  • Table 154: Europe Market Volume (Units) Forecast by Country, 2020-2035
  • Table 155: Europe Market Volume (Units) Forecast by Measurement Principle, 2020-2035
  • Table 156: Europe Market Volume (Units) Forecast by Interface, 2020-2035
  • Table 157: Europe Market Volume (Units) Forecast by Form Factor, 2020-2035
  • Table 158: Europe Market Volume (Units) Forecast by End-Use Sector, 2020-2035
  • Table 159: East Asia Market Volume (Units) Forecast by Country, 2020-2035
  • Table 160: East Asia Market Volume (Units) Forecast by Measurement Principle, 2020-2035
  • Table 161: East Asia Market Volume (Units) Forecast by Interface, 2020-2035
  • Table 162: East Asia Market Volume (Units) Forecast by Form Factor, 2020-2035
  • Table 163: East Asia Market Volume (Units) Forecast by End-Use Sector, 2020-2035
  • Table 164: South Asia & Pacific Market Volume (Units) Forecast by Country, 2020-2035
  • Table 165: South Asia & Pacific Market Volume (Units) Forecast by Measurement Principle, 2020-2035
  • Table 166: South Asia & Pacific Market Volume (Units) Forecast by Interface, 2020-2035
  • Table 167: South Asia & Pacific Market Volume (Units) Forecast by Form Factor, 2020-2035
  • Table 168: South Asia & Pacific Market Volume (Units) Forecast by End-Use Sector, 2020-2035
  • Table 169: Latin America Market Volume (Units) Forecast by Country, 2020-2035
  • Table 170: Latin America Market Volume (Units) Forecast by Measurement Principle, 2020-2035
  • Table 171: Latin America Market Volume (Units) Forecast by Interface, 2020-2035
  • Table 172: Latin America Market Volume (Units) Forecast by Form Factor, 2020-2035
  • Table 173: Latin America Market Volume (Units) Forecast by End-Use Sector, 2020-2035
  • Table 174: Middle East & Africa Market Volume (Units) Forecast by Country, 2020-2035
  • Table 175: Middle East & Africa Market Volume (Units) Forecast by Measurement Principle, 2020-2035
  • Table 176: Middle East & Africa Market Volume (Units) Forecast by Interface, 2020-2035
  • Table 177: Middle East & Africa Market Volume (Units) Forecast by Form Factor, 2020-2035
  • Table 178: Middle East & Africa Market Volume (Units) Forecast by End-Use Sector, 2020-2035
  • Table 179: United States Market Volume (Units) Forecast by Measurement Principle, 2020-2035
  • Table 180: United States Market Volume (Units) Forecast by Interface, 2020-2035
  • Table 181: United States Market Volume (Units) Forecast by Form Factor, 2020-2035
  • Table 182: United States Market Volume (Units) Forecast by End-Use Sector, 2020-2035
  • Table 183: Canada Market Volume (Units) Forecast by Measurement Principle, 2020-2035
  • Table 184: Canada Market Volume (Units) Forecast by Interface, 2020-2035
  • Table 185: Canada Market Volume (Units) Forecast by Form Factor, 2020-2035
  • Table 186: Canada Market Volume (Units) Forecast by End-Use Sector, 2020-2035
  • Table 187: Mexico Market Volume (Units) Forecast by Measurement Principle, 2020-2035
  • Table 188: Mexico Market Volume (Units) Forecast by Interface, 2020-2035
  • Table 189: Mexico Market Volume (Units) Forecast by Form Factor, 2020-2035
  • Table 190: Mexico Market Volume (Units) Forecast by End-Use Sector, 2020-2035
  • Table 191: Germany Market Volume (Units) Forecast by Measurement Principle, 2020-2035
  • Table 192: Germany Market Volume (Units) Forecast by Interface, 2020-2035
  • Table 193: Germany Market Volume (Units) Forecast by Form Factor, 2020-2035
  • Table 194: Germany Market Volume (Units) Forecast by End-Use Sector, 2020-2035
  • Table 195: United Kingdom Market Volume (Units) Forecast by Measurement Principle, 2020-2035
  • Table 196: United Kingdom Market Volume (Units) Forecast by Interface, 2020-2035
  • Table 197: United Kingdom Market Volume (Units) Forecast by Form Factor, 2020-2035
  • Table 198: United Kingdom Market Volume (Units) Forecast by End-Use Sector, 2020-2035
  • Table 199: France Market Volume (Units) Forecast by Measurement Principle, 2020-2035
  • Table 200: France Market Volume (Units) Forecast by Interface, 2020-2035
  • Table 201: France Market Volume (Units) Forecast by Form Factor, 2020-2035
  • Table 202: France Market Volume (Units) Forecast by End-Use Sector, 2020-2035
  • Table 203: Italy Market Volume (Units) Forecast by Measurement Principle, 2020-2035
  • Table 204: Italy Market Volume (Units) Forecast by Interface, 2020-2035
  • Table 205: Italy Market Volume (Units) Forecast by Form Factor, 2020-2035
  • Table 206: Italy Market Volume (Units) Forecast by End-Use Sector, 2020-2035
  • Table 207: Spain Market Volume (Units) Forecast by Measurement Principle, 2020-2035
  • Table 208: Spain Market Volume (Units) Forecast by Interface, 2020-2035
  • Table 209: Spain Market Volume (Units) Forecast by Form Factor, 2020-2035
  • Table 210: Spain Market Volume (Units) Forecast by End-Use Sector, 2020-2035
  • Table 211: China Market Volume (Units) Forecast by Measurement Principle, 2020-2035
  • Table 212: China Market Volume (Units) Forecast by Interface, 2020-2035
  • Table 213: China Market Volume (Units) Forecast by Form Factor, 2020-2035
  • Table 214: China Market Volume (Units) Forecast by End-Use Sector, 2020-2035
  • Table 215: Japan Market Volume (Units) Forecast by Measurement Principle, 2020-2035
  • Table 216: Japan Market Volume (Units) Forecast by Interface, 2020-2035
  • Table 217: Japan Market Volume (Units) Forecast by Form Factor, 2020-2035
  • Table 218: Japan Market Volume (Units) Forecast by End-Use Sector, 2020-2035
  • Table 219: South Korea Market Volume (Units) Forecast by Measurement Principle, 2020-2035
  • Table 220: South Korea Market Volume (Units) Forecast by Interface, 2020-2035
  • Table 221: South Korea Market Volume (Units) Forecast by Form Factor, 2020-2035
  • Table 222: South Korea Market Volume (Units) Forecast by End-Use Sector, 2020-2035
  • Table 223: India Market Volume (Units) Forecast by Measurement Principle, 2020-2035
  • Table 224: India Market Volume (Units) Forecast by Interface, 2020-2035
  • Table 225: India Market Volume (Units) Forecast by Form Factor, 2020-2035
  • Table 226: India Market Volume (Units) Forecast by End-Use Sector, 2020-2035
  • Table 227: ASEAN Market Volume (Units) Forecast by Measurement Principle, 2020-2035
  • Table 228: ASEAN Market Volume (Units) Forecast by Interface, 2020-2035
  • Table 229: ASEAN Market Volume (Units) Forecast by Form Factor, 2020-2035
  • Table 230: ASEAN Market Volume (Units) Forecast by End-Use Sector, 2020-2035
  • Table 231: Australia & New Zealand Market Volume (Units) Forecast by Measurement Principle, 2020-2035
  • Table 232: Australia & New Zealand Market Volume (Units) Forecast by Interface, 2020-2035
  • Table 233: Australia & New Zealand Market Volume (Units) Forecast by Form Factor, 2020-2035
  • Table 234: Australia & New Zealand Market Volume (Units) Forecast by End-Use Sector, 2020-2035
  • Table 235: Brazil Market Volume (Units) Forecast by Measurement Principle, 2020-2035
  • Table 236: Brazil Market Volume (Units) Forecast by Interface, 2020-2035
  • Table 237: Brazil Market Volume (Units) Forecast by Form Factor, 2020-2035
  • Table 238: Brazil Market Volume (Units) Forecast by End-Use Sector, 2020-2035
  • Table 239: Chile Market Volume (Units) Forecast by Measurement Principle, 2020-2035
  • Table 240: Chile Market Volume (Units) Forecast by Interface, 2020-2035
  • Table 241: Chile Market Volume (Units) Forecast by Form Factor, 2020-2035
  • Table 242: Chile Market Volume (Units) Forecast by End-Use Sector, 2020-2035

List of Figures

  • Figure 1: Global Market Value (USD Million) by Measurement Principle, 2025-2035
  • Figure 2: Global Market Value (USD Million) by Interface, 2025-2035
  • Figure 3: Global Market Value (USD Million) by Form Factor, 2025-2035
  • Figure 4: Global Market Value (USD Million) by End-Use Sector, 2025-2035
  • Figure 5: Global Market Value (USD Million) by Region, 2025-2035
  • Figure 6: Global Market Value (USD Million) Analysis by Region, 2020-2035
  • Figure 7: Global Market Value Share (%) and BPS Analysis by Region, 2025-2035
  • Figure 8: Global Market Y-o-Y Growth (%) Projections by Region, 2025-2035
  • Figure 9: Global Market Value (USD Million) Analysis by Measurement Principle, 2020-2035
  • Figure 10: Global Market Value Share (%) and BPS Analysis by Measurement Principle, 2025-2035
  • Figure 11: Global Market Y-o-Y Growth (%) Projections by Measurement Principle, 2025-2035
  • Figure 12: Global Market Value (USD Million) Analysis by Interface, 2020-2035
  • Figure 13: Global Market Value Share (%) and BPS Analysis by Interface, 2025-2035
  • Figure 14: Global Market Y-o-Y Growth (%) Projections by Interface, 2025-2035
  • Figure 15: Global Market Value (USD Million) Analysis by Form Factor, 2020-2035
  • Figure 16: Global Market Value Share (%) and BPS Analysis by Form Factor, 2025-2035
  • Figure 17: Global Market Y-o-Y Growth (%) Projections by Form Factor, 2025-2035
  • Figure 18: Global Market Value (USD Million) Analysis by End-Use Sector, 2020-2035
  • Figure 19: Global Market Value Share (%) and BPS Analysis by End-Use Sector, 2025-2035
  • Figure 20: Global Market Y-o-Y Growth (%) Projections by End-Use Sector, 2025-2035
  • Figure 21: Global Market Attractiveness by Measurement Principle, 2025-2035
  • Figure 22: Global Market Attractiveness by Interface, 2025-2035
  • Figure 23: Global Market Attractiveness by Form Factor, 2025-2035
  • Figure 24: Global Market Attractiveness by End-Use Sector, 2025-2035
  • Figure 25: Global Market Attractiveness by Region, 2025-2035
  • Figure 26: North America Market Value (USD Million) by Measurement Principle, 2025-2035
  • Figure 27: North America Market Value (USD Million) by Interface, 2025-2035
  • Figure 28: North America Market Value (USD Million) by Form Factor, 2025-2035
  • Figure 29: North America Market Value (USD Million) by End-Use Sector, 2025-2035
  • Figure 30: North America Market Value (USD Million) by Country, 2025-2035
  • Figure 31: North America Market Value (USD Million) Analysis by Country, 2020-2035
  • Figure 32: North America Market Value Share (%) and BPS Analysis by Country, 2025-2035
  • Figure 33: North America Market Y-o-Y Growth (%) Projections by Country, 2025-2035
  • Figure 34: North America Market Value (USD Million) Analysis by Measurement Principle, 2020-2035
  • Figure 35: North America Market Value Share (%) and BPS Analysis by Measurement Principle, 2025-2035
  • Figure 36: North America Market Y-o-Y Growth (%) Projections by Measurement Principle, 2025-2035
  • Figure 37: North America Market Value (USD Million) Analysis by Interface, 2020-2035
  • Figure 38: North America Market Value Share (%) and BPS Analysis by Interface, 2025-2035
  • Figure 39: North America Market Y-o-Y Growth (%) Projections by Interface, 2025-2035
  • Figure 40: North America Market Value (USD Million) Analysis by Form Factor, 2020-2035
  • Figure 41: North America Market Value Share (%) and BPS Analysis by Form Factor, 2025-2035
  • Figure 42: North America Market Y-o-Y Growth (%) Projections by Form Factor, 2025-2035
  • Figure 43: North America Market Value (USD Million) Analysis by End-Use Sector, 2020-2035
  • Figure 44: North America Market Value Share (%) and BPS Analysis by End-Use Sector, 2025-2035
  • Figure 45: North America Market Y-o-Y Growth (%) Projections by End-Use Sector, 2025-2035
  • Figure 46: North America Market Attractiveness by Measurement Principle, 2025-2035
  • Figure 47: North America Market Attractiveness by Interface, 2025-2035
  • Figure 48: North America Market Attractiveness by Form Factor, 2025-2035
  • Figure 49: North America Market Attractiveness by End-Use Sector, 2025-2035
  • Figure 50: North America Market Attractiveness by Country, 2025-2035
  • Figure 51: Europe Market Value (USD Million) by Measurement Principle, 2025-2035
  • Figure 52: Europe Market Value (USD Million) by Interface, 2025-2035
  • Figure 53: Europe Market Value (USD Million) by Form Factor, 2025-2035
  • Figure 54: Europe Market Value (USD Million) by End-Use Sector, 2025-2035
  • Figure 55: Europe Market Value (USD Million) by Country, 2025-2035
  • Figure 56: Europe Market Value (USD Million) Analysis by Country, 2020-2035
  • Figure 57: Europe Market Value Share (%) and BPS Analysis by Country, 2025-2035
  • Figure 58: Europe Market Y-o-Y Growth (%) Projections by Country, 2025-2035
  • Figure 59: Europe Market Value (USD Million) Analysis by Measurement Principle, 2020-2035
  • Figure 60: Europe Market Value Share (%) and BPS Analysis by Measurement Principle, 2025-2035
  • Figure 61: Europe Market Y-o-Y Growth (%) Projections by Measurement Principle, 2025-2035
  • Figure 62: Europe Market Value (USD Million) Analysis by Interface, 2020-2035
  • Figure 63: Europe Market Value Share (%) and BPS Analysis by Interface, 2025-2035
  • Figure 64: Europe Market Y-o-Y Growth (%) Projections by Interface, 2025-2035
  • Figure 65: Europe Market Value (USD Million) Analysis by Form Factor, 2020-2035
  • Figure 66: Europe Market Value Share (%) and BPS Analysis by Form Factor, 2025-2035
  • Figure 67: Europe Market Y-o-Y Growth (%) Projections by Form Factor, 2025-2035
  • Figure 68: Europe Market Value (USD Million) Analysis by End-Use Sector, 2020-2035
  • Figure 69: Europe Market Value Share (%) and BPS Analysis by End-Use Sector, 2025-2035
  • Figure 70: Europe Market Y-o-Y Growth (%) Projections by End-Use Sector, 2025-2035
  • Figure 71: Europe Market Attractiveness by Measurement Principle, 2025-2035
  • Figure 72: Europe Market Attractiveness by Interface, 2025-2035
  • Figure 73: Europe Market Attractiveness by Form Factor, 2025-2035
  • Figure 74: Europe Market Attractiveness by End-Use Sector, 2025-2035
  • Figure 75: Europe Market Attractiveness by Country, 2025-2035
  • Figure 76: East Asia Market Value (USD Million) by Measurement Principle, 2025-2035
  • Figure 77: East Asia Market Value (USD Million) by Interface, 2025-2035
  • Figure 78: East Asia Market Value (USD Million) by Form Factor, 2025-2035
  • Figure 79: East Asia Market Value (USD Million) by End-Use Sector, 2025-2035
  • Figure 80: East Asia Market Value (USD Million) by Country, 2025-2035
  • Figure 81: East Asia Market Value (USD Million) Analysis by Country, 2020-2035
  • Figure 82: East Asia Market Value Share (%) and BPS Analysis by Country, 2025-2035
  • Figure 83: East Asia Market Y-o-Y Growth (%) Projections by Country, 2025-2035
  • Figure 84: East Asia Market Value (USD Million) Analysis by Measurement Principle, 2020-2035
  • Figure 85: East Asia Market Value Share (%) and BPS Analysis by Measurement Principle, 2025-2035
  • Figure 86: East Asia Market Y-o-Y Growth (%) Projections by Measurement Principle, 2025-2035
  • Figure 87: East Asia Market Value (USD Million) Analysis by Interface, 2020-2035
  • Figure 88: East Asia Market Value Share (%) and BPS Analysis by Interface, 2025-2035
  • Figure 89: East Asia Market Y-o-Y Growth (%) Projections by Interface, 2025-2035
  • Figure 90: East Asia Market Value (USD Million) Analysis by Form Factor, 2020-2035
  • Figure 91: East Asia Market Value Share (%) and BPS Analysis by Form Factor, 2025-2035
  • Figure 92: East Asia Market Y-o-Y Growth (%) Projections by Form Factor, 2025-2035
  • Figure 93: East Asia Market Value (USD Million) Analysis by End-Use Sector, 2020-2035
  • Figure 94: East Asia Market Value Share (%) and BPS Analysis by End-Use Sector, 2025-2035
  • Figure 95: East Asia Market Y-o-Y Growth (%) Projections by End-Use Sector, 2025-2035
  • Figure 96: East Asia Market Attractiveness by Measurement Principle, 2025-2035
  • Figure 97: East Asia Market Attractiveness by Interface, 2025-2035
  • Figure 98: East Asia Market Attractiveness by Form Factor, 2025-2035
  • Figure 99: East Asia Market Attractiveness by End-Use Sector, 2025-2035
  • Figure 100: East Asia Market Attractiveness by Country, 2025-2035
  • Figure 101: South Asia & Pacific Market Value (USD Million) by Measurement Principle, 2025-2035
  • Figure 102: South Asia & Pacific Market Value (USD Million) by Interface, 2025-2035
  • Figure 103: South Asia & Pacific Market Value (USD Million) by Form Factor, 2025-2035
  • Figure 104: South Asia & Pacific Market Value (USD Million) by End-Use Sector, 2025-2035
  • Figure 105: South Asia & Pacific Market Value (USD Million) by Country, 2025-2035
  • Figure 106: South Asia & Pacific Market Value (USD Million) Analysis by Country, 2020-2035
  • Figure 107: South Asia & Pacific Market Value Share (%) and BPS Analysis by Country, 2025-2035
  • Figure 108: South Asia & Pacific Market Y-o-Y Growth (%) Projections by Country, 2025-2035
  • Figure 109: South Asia & Pacific Market Value (USD Million) Analysis by Measurement Principle, 2020-2035
  • Figure 110: South Asia & Pacific Market Value Share (%) and BPS Analysis by Measurement Principle, 2025-2035
  • Figure 111: South Asia & Pacific Market Y-o-Y Growth (%) Projections by Measurement Principle, 2025-2035
  • Figure 112: South Asia & Pacific Market Value (USD Million) Analysis by Interface, 2020-2035
  • Figure 113: South Asia & Pacific Market Value Share (%) and BPS Analysis by Interface, 2025-2035
  • Figure 114: South Asia & Pacific Market Y-o-Y Growth (%) Projections by Interface, 2025-2035
  • Figure 115: South Asia & Pacific Market Value (USD Million) Analysis by Form Factor, 2020-2035
  • Figure 116: South Asia & Pacific Market Value Share (%) and BPS Analysis by Form Factor, 2025-2035
  • Figure 117: South Asia & Pacific Market Y-o-Y Growth (%) Projections by Form Factor, 2025-2035
  • Figure 118: South Asia & Pacific Market Value (USD Million) Analysis by End-Use Sector, 2020-2035
  • Figure 119: South Asia & Pacific Market Value Share (%) and BPS Analysis by End-Use Sector, 2025-2035
  • Figure 120: South Asia & Pacific Market Y-o-Y Growth (%) Projections by End-Use Sector, 2025-2035
  • Figure 121: South Asia & Pacific Market Attractiveness by Measurement Principle, 2025-2035
  • Figure 122: South Asia & Pacific Market Attractiveness by Interface, 2025-2035
  • Figure 123: South Asia & Pacific Market Attractiveness by Form Factor, 2025-2035
  • Figure 124: South Asia & Pacific Market Attractiveness by End-Use Sector, 2025-2035
  • Figure 125: South Asia & Pacific Market Attractiveness by Country, 2025-2035
  • Figure 126: Latin America Market Value (USD Million) by Measurement Principle, 2025-2035
  • Figure 127: Latin America Market Value (USD Million) by Interface, 2025-2035
  • Figure 128: Latin America Market Value (USD Million) by Form Factor, 2025-2035
  • Figure 129: Latin America Market Value (USD Million) by End-Use Sector, 2025-2035
  • Figure 130: Latin America Market Value (USD Million) by Country, 2025-2035
  • Figure 131: Latin America Market Value (USD Million) Analysis by Country, 2020-2035
  • Figure 132: Latin America Market Value Share (%) and BPS Analysis by Country, 2025-2035
  • Figure 133: Latin America Market Y-o-Y Growth (%) Projections by Country, 2025-2035
  • Figure 134: Latin America Market Value (USD Million) Analysis by Measurement Principle, 2020-2035
  • Figure 135: Latin America Market Value Share (%) and BPS Analysis by Measurement Principle, 2025-2035
  • Figure 136: Latin America Market Y-o-Y Growth (%) Projections by Measurement Principle, 2025-2035
  • Figure 137: Latin America Market Value (USD Million) Analysis by Interface, 2020-2035
  • Figure 138: Latin America Market Value Share (%) and BPS Analysis by Interface, 2025-2035
  • Figure 139: Latin America Market Y-o-Y Growth (%) Projections by Interface, 2025-2035
  • Figure 140: Latin America Market Value (USD Million) Analysis by Form Factor, 2020-2035
  • Figure 141: Latin America Market Value Share (%) and BPS Analysis by Form Factor, 2025-2035
  • Figure 142: Latin America Market Y-o-Y Growth (%) Projections by Form Factor, 2025-2035
  • Figure 143: Latin America Market Value (USD Million) Analysis by End-Use Sector, 2020-2035
  • Figure 144: Latin America Market Value Share (%) and BPS Analysis by End-Use Sector, 2025-2035
  • Figure 145: Latin America Market Y-o-Y Growth (%) Projections by End-Use Sector, 2025-2035
  • Figure 146: Latin America Market Attractiveness by Measurement Principle, 2025-2035
  • Figure 147: Latin America Market Attractiveness by Interface, 2025-2035
  • Figure 148: Latin America Market Attractiveness by Form Factor, 2025-2035
  • Figure 149: Latin America Market Attractiveness by End-Use Sector, 2025-2035
  • Figure 150: Latin America Market Attractiveness by Country, 2025-2035
  • Figure 151: Middle East & Africa Market Value (USD Million) by Measurement Principle, 2025-2035
  • Figure 152: Middle East & Africa Market Value (USD Million) by Interface, 2025-2035
  • Figure 153: Middle East & Africa Market Value (USD Million) by Form Factor, 2025-2035
  • Figure 154: Middle East & Africa Market Value (USD Million) by End-Use Sector, 2025-2035
  • Figure 155: Middle East & Africa Market Value (USD Million) by Country, 2025-2035
  • Figure 156: Middle East & Africa Market Value (USD Million) Analysis by Country, 2020-2035
  • Figure 157: Middle East & Africa Market Value Share (%) and BPS Analysis by Country, 2025-2035
  • Figure 158: Middle East & Africa Market Y-o-Y Growth (%) Projections by Country, 2025-2035
  • Figure 159: Middle East & Africa Market Value (USD Million) Analysis by Measurement Principle, 2020-2035
  • Figure 160: Middle East & Africa Market Value Share (%) and BPS Analysis by Measurement Principle, 2025-2035
  • Figure 161: Middle East & Africa Market Y-o-Y Growth (%) Projections by Measurement Principle, 2025-2035
  • Figure 162: Middle East & Africa Market Value (USD Million) Analysis by Interface, 2020-2035
  • Figure 163: Middle East & Africa Market Value Share (%) and BPS Analysis by Interface, 2025-2035
  • Figure 164: Middle East & Africa Market Y-o-Y Growth (%) Projections by Interface, 2025-2035
  • Figure 165: Middle East & Africa Market Value (USD Million) Analysis by Form Factor, 2020-2035
  • Figure 166: Middle East & Africa Market Value Share (%) and BPS Analysis by Form Factor, 2025-2035
  • Figure 167: Middle East & Africa Market Y-o-Y Growth (%) Projections by Form Factor, 2025-2035
  • Figure 168: Middle East & Africa Market Value (USD Million) Analysis by End-Use Sector, 2020-2035
  • Figure 169: Middle East & Africa Market Value Share (%) and BPS Analysis by End-Use Sector, 2025-2035
  • Figure 170: Middle East & Africa Market Y-o-Y Growth (%) Projections by End-Use Sector, 2025-2035
  • Figure 171: Middle East & Africa Market Attractiveness by Measurement Principle, 2025-2035
  • Figure 172: Middle East & Africa Market Attractiveness by Interface, 2025-2035
  • Figure 173: Middle East & Africa Market Attractiveness by Form Factor, 2025-2035
  • Figure 174: Middle East & Africa Market Attractiveness by End-Use Sector, 2025-2035
  • Figure 175: Middle East & Africa Market Attractiveness by Country, 2025-2035

Frequently Asked Questions

What is the market outlook for multi-modal biometric cabin sensors from 2025 to 2035?

The market will expand from USD 1,786.7 million in 2025 to USD 2,554.4 million by 2035, growing at a CAGR of 3.6%.

Which measurement principle holds the largest share in this market?

The Optical/Imaging segment dominates with a 35.0% share in 2025, widely used for facial recognition and high-resolution biometric applications.

What are the main drivers of market growth?

Growth is supported by rising demand for advanced security, regulatory compliance in vehicles, and the integration of AI-driven biometric technologies.

Which countries are leading in growth?

China (4.5% CAGR) and India (4.2% CAGR) are the fastest-growing markets, driven by rapid digitalization, automotive expansion, and security system adoption.

Explore Similar Insights

Future Market Insights

Multi-Modal Biometric Cabin Sensors Market

Chat With

MaRIA

Hi There, I am MaRIA, Your Market Research Intelligence Assistant. How may I help you?