Reports

- Global Locations -

Headquarters

Future Market Insights, Inc.

Christiana Corporate, 200
Continental Drive, Suite 401,
Newark, Delaware - 19713,
United States

T: +1-845-579-5705

Americas

Future Market Insights, Inc.

616 Corporate Way, Suite 2-9018,
Valley Cottage, NY 10989, United States

T: +1-347-918-3531

MEA

Future Market Insights

1602-6 Jumeirah Bay X2 Tower, Plot No: JLT-PH2-X2A,
Jumeirah Lakes Towers, Dubai,
United Arab Emirates

Europe

Future Market Insights

3rd Floor, 207 Regent Street,
W1B 3HH London
United Kingdom

T: + 44 (0) 20 8123 9659
D: +44 (0) 20 3287 4268

Asia Pacific

Future Market Insights

IndiaLand Global Tech Park, Unit UG-1, Behind Grand HighStreet, Phase 1, Hinjawadi, MH, Pune – 411057, India

Nerve Repair Market Outlook (2023 to 2033)

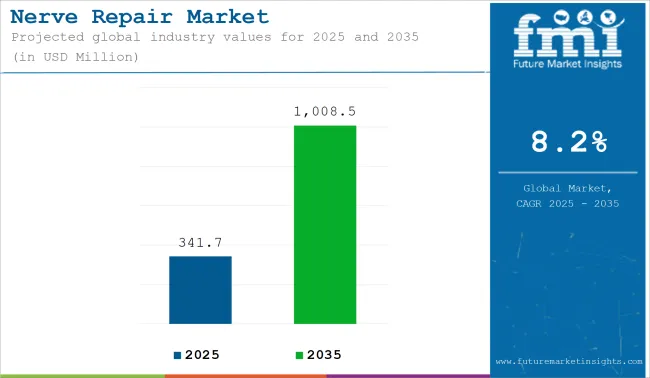
The overall sales in the global nerve repair market are expected to surpass US$ 272.4 million in 2023, registering growth at 12.2% CAGR between 2023 and 2033. With the growing prevalence of neurological illness, the sales in the market are projected to reach US$ 861.4 million in 2033.

As the cases of several chronic nervous systems such as Alzheimer's and Parkinson’s disease rise, the demand for nerve repair products is predicted to burgeon over the forecast period. Further, growth in the market will accelerate on the back of technological advancements in neurological treatments.

For instance, in 2022, Medtronic announced the approval for its Intellis neurostimulator and the Vanta neurostimulator from the United States Food and Drug Administration (FDA) for the chronic pain treatment associated with diabetic peripheral neuropathy (DPN).

When a nerve is damaged, it can lead to serious motor and sensory issues that ache and cause the appendages to malfunction. Hence, health professionals are employing biomaterials in the nerve repair process and are included in products for nerve repair. Autograft is the gold standard for nerve repair procedures, although the specifics of the procedure are determined by the type and severity of the nerve injury.

Advanced nerve repair therapies are used to treat nerve damage brought on by trauma and other factors, which is a key driver influencing the market. Adult stem cells, which can be obtained from adipose tissue, skin, and bone marrow, are now being employed in many developed nations to repair and regenerate nerves.

Attributes Details
Historical Value (2022) US$ 242.8 million
Current Year Value (2023) US$ 272.4 million
Expected Forecast Value (2033) US$ 861.4 million
Projected CAGR (2023 to 2033) 12.2%

Don't pay for what you don't need

Customize your report by selecting specific countries or regions and save 30%!

Sales Analysis of Nerve Repair Market from 2018 to 2022 Vs Market Outlook for 2023 to 2033

Sales in the nerve repair market expanded at a CAGR of 10.6% between 2018 and 2022. However, growth in the market is predicted to surge by 3.1xxthrough 2023 & beyond.

Key players in the market are increasing the manufacturing of nerve repair products as the prevalence of neurological disorders surges. Additionally, an increase in nerve repair expenditure is likely to drive sales in the nerve repair market over the forecast period (2023 to 2033).

As per the study, cases of nerve damage in developed countries are increasing, fuelling the demand in the market. According to the American Society for Peripheral Nerve, an average of 1.2 million procedures are performed alone in the United States.

An estimated US$ 150 billion are spent on medical care for nerve injuries yearly in the US. This portrays the expenditure on nerve repair, replacement, and regeneration due to a rise in cases of indications like amyotrophic lateral sclerosis, multiple system atrophy, Parkinson’s disease, Alzheimer’s disease, and multiple sclerosis.

According to the Pan American Health Organization in 2019, neurological conditions account for 32.9 deaths per 100,000 populations, out of which 33.1 deaths per 100,000 populations in men and 32.2 deaths per 100,000 populations in women.

Hence, to reduce the global burden, key players are increasing the manufacturing of nerve repair products. Consequently, governments across the globe are also investing in creating awareness across countries such as India, South Africa, and others, propelling the sales of nerve repair products over the forecast period. On the back of this, the demand for nerve repair is poised to expand at a CAGR of 12.2% from 2023 to 2033.

What are the Key Trends Driving the Growth in Nerve Repair Market?

Key Players are Capitalizing on Untapped Opportunities in South & East Asia

Key players are eyeing the East and South Asia markets to capitalize on the growing demand for neurological products coupled with rising awareness in countries such as India, China, and Japan. They are also tapping into the markets of Mexico, Indonesia, and other Middle Eastern nations. This is also expected to fuel the demand in the nerve repair market.

Further, leading producers are investing a great deal of effort into streamlining their Research and Development and improving production for nerve repair products. Due to the cost-effectiveness achieved by outsourcing their manufacturing capabilities, CDMOs will likely anticipate a profitable decade.

Sabyasachi Ghosh
Sabyasachi Ghosh

Principal Consultant

Talk to Analyst

Find your sweet spots for generating winning opportunities in this market.

What are the Factors Restraining the Demand within the Nerve Repair Market?

In addition to grafting, there are a number of other treatment options for nerve repair. Stem cell treatment is another method for regenerating damaged nerves. The injured nerve is ultimately repaired by the adult stem cells, which are applied directly to the affected area. Over the projected period, this is expected to impede the growth of the market's sales revenues for nerve repair.

Furthermore, the infrastructure for health care is typically inadequate in emerging economies like Brazil, Argentina, and a number of Middle Eastern and African nations. There are an insufficient number of highly skilled healthcare practitioners due to the underdeveloped healthcare infrastructure. This has ultimately resulted in the lack of adoption of cutting-edge therapies for nerve repair and other treatments in emerging economies, which has limited sales revenue in the market for nerve repair.

These factors cumulatively propose a negative effect on the developmental growth of the nerve repair market.

Country-wise Insights

Country 2022 Value Share in Global Market
United States 39.7%
Germany 6.6%
Japan 4.8%

What Makes the United States a Highly Lucrative Nerve Repair Market?

Availability of Favorable Reimbursement Policies in the United States to Fuel the Sales

Growth in the market is underpinned by the strong presence of several health insurance companies. These companies incorporate government programs to provide insurance coverage for standard procedures in nerve repair and regeneration. Backed by this, the United States nerve repair market is set to witness stupendous growth over the upcoming decade.

In the United States, the reimbursement system is a combination of public/private payers, where government, employers, and individuals, bear the cost. Around 200 million people in the United States were insured with some form of private insurance, while 70 - 80 million were insured by public insurance in 2020, as per the Commonwealth Fund.

What is the Demand Outlook for Germany Nerve Repair Market?

Increasing Cases of Nerve Injury to Create Lucrative Sales Prospects in Germany

The motor reflexes become less active among patients with neurological trauma and minor accidents. In Germany, the number of patients with nerve injury is surging as the population ages. According to a study, people aged 50 and older undergo over 65% of limb surgeries, and 82% of surgeries worldwide are performed as a result of diabetes and peripheral vascular diseases. This is anticipated to propel the demand for nerve repair products in the country.

How is Japan Nerve Repair Market Becoming a Hotbed of Medical Innovation?

The Rising Geriatric Population Drives Demand for Nerve Repair Solutions in Japan

Japan has one of the world's leading aging populations, which is prone to nerve-related disorders and injuries. The increasing geriatric population presents a significant market opportunity. There is a growing demand for nerve repair products and services to cater to this population. This trend is expected to continue due to ongoing demographic shifts. The government has implemented various initiatives to address the healthcare needs of its population.

The country's high healthcare expenditure, strong research and development activities, government initiatives, and collaborations contribute to the overall development of the market. The Trauma and Microsurgery Center at Toyohashi Municipal Hospital in Japan conducted a study in 2023 to evaluate the mid-term outcomes of digital nerve injuries treated with Renerve® synthetic collagen nerve conduits. The success rate of the treatment was found to be 85%.

Country Value CAGR (2023 to 2033)
United Kingdom 12%
China 11.9%
India 9.1%

What Factors Contribute to the Demand for Nerve Repair Treatments in the United Kingdom?

United Kingdom Nerve Repair Market Surges as Minimally Invasive Procedures Gain Popularity

The United Kingdom has witnessed a rise in nerve injuries. Around one out of every six individuals in this country is affected by at least one neurological condition, resulting in an estimated annual diagnosis of 600,000 people. These conditions have the potential to impact individuals from all walks of life without any specific age or time restrictions.

The United Kingdom has a well-established healthcare system. It is considered one of the leading markets for medical devices and treatments. Nerve repair is a rapidly evolving field within the healthcare sector in the United Kingdom. Continuous innovations in surgical techniques, regenerative medicine, and neurostimulation technologies drive it. These advancements are enhancing the treatment options available for nerve repair patients.

Minimally invasive nerve repair procedures are becoming increasingly popular in the United Kingdom. These procedures offer numerous advantages, such as reduced scarring, shorter recovery time, and fewer post-operative complications. The demand for minimally invasive techniques in nerve repair in this country is expected to witness significant growth during the forecast period.

Will China Emerge as the Most Remunerative Nerve Repair Market?

China to Contribute Nearly 2/5th of Sales in the Global Nerve Repair Market

With growing awareness regarding neurological disorders and increasing government initiatives, China is anticipated to witness favorable growth during the forecast period. This is mostly due to the presence of numerous biomaterial and mobility devices manufacturing companies.

The country also has a robust supply-chain system, and with burgeoning cases of Alzheimer's among the geriatric population, the demand in the market is predicted to rise at a rapid pace. Further, improved healthcare infrastructure and technological advancements in the treatment of nerve repair and regeneration will create a conducive environment for the market.

How has Telemedicine Transformed Patient Care in the India Nerve Repair Market?

India's Booming Medical Tourism Industry Boosts Nerve Repair Sector

India has been a popular place for medical tourism. It is estimated that about 50,000 nerve repair surgeries are conducted in India annually. This is due to its high-quality healthcare infrastructure. Skilled healthcare professionals are another contributing factor. Cost-effective treatments in India attract international patients. The growth of medical tourism has positively impacted the nerve repair industry. International patients specifically seek advanced nerve repair procedures in India.

The spectrum of neurological disorders is prevalent in various regions of the country, with rates ranging from 967 to 4,070 cases per 100,000 population. On average, there are around 2,394 cases per 100,000 population. This estimate suggests that over 30 million individuals are affected by neurological disorders in the country. The success rate of nerve repair in India is generally good, with a reported success rate of up to 90% for certain types of injuries.

Teleconsultations and remote monitoring are now common for follow-up care. This reduces the necessity for physical visits to healthcare facilities. Telemedicine has the potential to improve access to nerve repair specialists. Patients in remote areas can benefit significantly from this advancement. It enables them to connect with specialists without the need for travel. Access to nerve repair expertise becomes more convenient and accessible.

Get the data you need at a Fraction of the cost

Personalize your report by choosing insights you need
and save 40%!

Category-wise Insights

Segment 2022 Value Share in Global Market
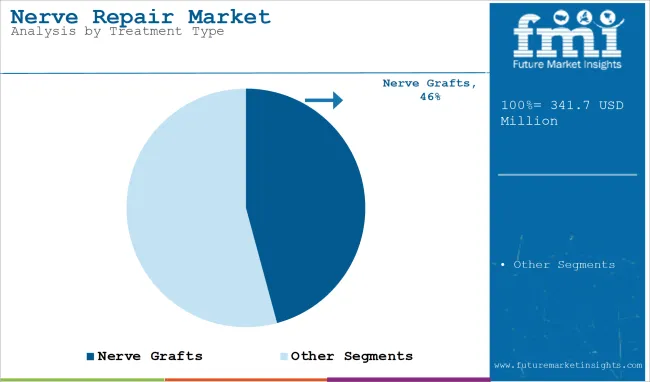
Nerve Graft 42.8%
Epineural Nerve Repair 65.2%

Which Type of Nerve Repair Product is Gaining Traction?

Over 42% of Revenue in the Nerve Repair Market to be Contributed by Nerve Grafts

A nerve graft is a self-healthy cell made from a human nerve allograft, which is applied on a damaged nerve and proposed for the surgical repair of peripheral nerve breaks. Effective results of this grafting make this segment a leading factor driving the growth of the overall nerve repair market. Nerve grafts excel at bridging critical gaps between severed nerve endings. In cases of complete nerve severance, nerve grafts serve as indispensable conduits, reestablishing connections and facilitating regeneration. Their ability to bridge these gaps is crucial for repairing important nerve injuries and restoring functionality.

Nerve grafts foster nerve regeneration through the inclusion of endoneurial tubes. These tubular structures within the grafts facilitate the growth of regenerating nerve fibers. By serving as a conducive environment for regeneration, nerve grafts promote the intricate process of nerve repair, leading to improved outcomes for patients. Moreover, advancements in nerve graft technology have bolstered their standing in the market. Processed nerve allografts, derived from human tissue donors, have emerged as a promising alternative to autografts.

What Type of Nerve Repair will Generate Maximum Revenue in the Market?

Epineural Nerve Repair is the Most Preferred among Neurologists

The epineural nerve repair procedure is a common surgical process to repair a nerve cut via the epineurium and repair the nerve fibers originating from the spinal cord. This procedure is very effective and easy to conduct, improving the adoption among healthcare professionals. Epineural nerve repair is highly effective in restoring nerve function and improving patient outcomes. It surpasses alternative methods in promoting successful nerve regeneration. Its consistent high success rates have established it as a reliable and trusted solution. The medical community recognizes its efficacy and relies on it for nerve repair. The safety profile of Epineural Nerve Repair is exceptional. It has minimal complications and adverse effects reported. This outstanding safety record appeals to healthcare providers and patients. It offers a reliable and low-risk option for nerve repair.

Which is the Leading End User in the Nerve Repair Market?

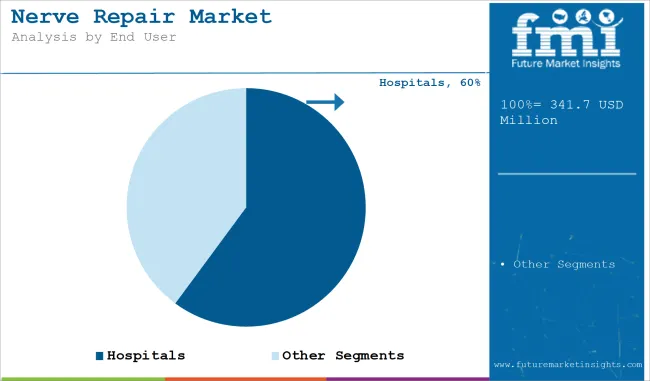
Hospitals to Generate Nearly 3/5th of Revenue in Nerve Repair Market

The availability of advanced medical equipment for comprehensive patient care in hospitals is the key factor propelling the growth in the segment. Moreover, with contracts through multiple distribution channels, hospitals can provide services with subsidized costs for equipment. With a large patient footfall and a growing burden of neurological disorders, the adoption of nerve repair products in hospitals is predicted to surge over the forecast period.

Competitive Landscape

With several established nerve repair production companies across the globe, the overall market is estimated to be highly fragmented. To maintain a strong foothold in the industry, key players are increasing Research and Development efforts to expand their novel product portfolios. Several products are in their pipeline stage, and the companies are moving their efforts into promoting the regularization and licensing of these pipelined products after assessing their efficacy.

For instance:

  • In May 2023, a new compound was discovered by the United Kingdom Research and Innovation during their research. This compound exhibits the ability to promote nerve regeneration following injuries and safeguard cardiac tissue against the type of harm observed in heart attacks.
  • In October 2022, Phageneis obtained de novo approval from the United States FDA for their Phagenyx neurostimulation system. This innovative system utilizes pharyngeal electrical stimulation to restore the ability to swallow in individuals suffering from severe dysphagia following a stroke.
  • In August 2022, Abbott received United States FDA approval for the ProClaim plus spinal cord stimulation system. The ProClaim Plus system features FlexBurst therapy developed by Abbott. This system is the next generation of Abbott's BurstDR stimulation technology. It provides FlexBurst 360 therapy. FlexBurst 360 therapy effectively alleviates pain. The therapy targets six specific regions of the torso and extremities.
  • Integra LifeSciences Holding Corporation announced the launch of NeuraGen® 3D Nerve Guide Matrix, a resorbable implant for the repair of peripheral nerve discontinuities, in March 2022.
  • Topline findings from Avance Nerve Graft vs. compared with Conduits in Digital Nerve Injuries from the RECON Clinical Study were released by Axogen, Inc. in May 2022. The company will submit a biologics license application (BLA) in the second half of 2023 with the help of the data collected from this clinical study.
  • Checkpoint Surgical, Inc. introduced The NeuroShield® Chitosan Nerve Wrap in August 2021, expanding its portfolio of intraoperative nerve care products.

Key Market Players

  • Axogen Inc.
  • Stryker Corporation
  • Baxter International Inc.
  • Integra Lifesciences Holdings Corp
  • Neurotex Ltd
  • Polyganics B.V.
  • Abbott Laboratories
  • Boston Scientific Inc
  • Medtronic Plc
  • Checkpoint Surgical
  • Polyganics
  • Synovis Micro Companies Alliance
  • Orthomed, Inc

Key Market Segments Covered in Nerve Repair Industry Research

By Product:

  • Nerve Wrap
  • Nerve Protector
  • Nerve Connector
  • Nerve Graft

By Nerve Repair:

  • Epineural Nerve Repair
  • Perineural Nerve Repair
  • Fascicular Nerve Repair

By End User:

  • Hospitals
  • Ambulatory Surgical Centers
  • Specialty Clinics

By Region:

  • North America
  • Latin America
  • Europe
  • South Asia
  • East Asia
  • Oceania
  • The Middle East and Africa (MEA)

Frequently Asked Questions

What is the Growth Outlook of the Nerve Repair Market?

The market is expected to expand at a CAGR of 12.2%.

What is the Projected Value of the Nerve Repair Market by 2023?

The market is expected to reach US$ 272.4 million in 2023.

How Did the Market Perform in the Past?

From 2018 to 2022, the market expanded at a 10.6% CAGR.

Which Country Leads the Global Market?

The United States is expected to record a 12% CAGR throughout 2033.

Which Nerve Repair Segment is the Most Promising for Growth?

Epineural nerve repair is the preferred choice in the market.

Table of Content

1. Executive Summary

    1.1. Global Market Outlook

    1.2. Demand-side Trends

    1.3. Supply-side Trends

    1.4. Technology Roadmap Analysis

    1.5. Analysis and Recommendations

2. Market Overview

    2.1. Market Coverage / Taxonomy

    2.2. Market Definition / Scope / Limitations

3. Market Background

    3.1. Market Dynamics

        3.1.1. Drivers

        3.1.2. Restraints

        3.1.3. Opportunity

        3.1.4. Trends

    3.2. Scenario Forecast

        3.2.1. Demand in Optimistic Scenario

        3.2.2. Demand in Likely Scenario

        3.2.3. Demand in Conservative Scenario

    3.3. Opportunity Map Analysis

    3.4. Investment Feasibility Matrix

    3.5. PESTLE and Porter’s Analysis

    3.6. Regulatory Landscape

        3.6.1. By Key Regions

        3.6.2. By Key Countries

    3.7. Regional Parent Market Outlook

4. Global Market Analysis 2018 to 2022 and Forecast, 2023 to 2033

    4.1. Historical Market Size Value (US$ Million) Analysis, 2018 to 2022

    4.2. Current and Future Market Size Value (US$ Million) Projections, 2023 to 2033

        4.2.1. Y-o-Y Growth Trend Analysis

        4.2.2. Absolute $ Opportunity Analysis

5. Global Market Analysis 2018 to 2022 and Forecast 2023 to 2033, By Product

    5.1. Introduction / Key Findings

    5.2. Historical Market Size Value (US$ Million) Analysis By Product, 2018 to 2022

    5.3. Current and Future Market Size Value (US$ Million) Analysis and Forecast By Product, 2023 to 2033

        5.3.1. Nerve Wrap

        5.3.2. Nerve Protector

        5.3.3. Nerve Connector

        5.3.4. Nerve Graft

    5.4. Y-o-Y Growth Trend Analysis By Product, 2018 to 2022

    5.5. Absolute $ Opportunity Analysis By Product, 2023 to 2033

6. Global Market Analysis 2018 to 2022 and Forecast 2023 to 2033, By Nerve Repair

    6.1. Introduction / Key Findings

    6.2. Historical Market Size Value (US$ Million) Analysis By Nerve Repair, 2018 to 2022

    6.3. Current and Future Market Size Value (US$ Million) Analysis and Forecast By Nerve Repair, 2023 to 2033

        6.3.1. Epineural Nerve Repair

        6.3.2. Perineural Nerve Repair

        6.3.3. Fascicular Nerve Repair

    6.4. Y-o-Y Growth Trend Analysis By Nerve Repair, 2018 to 2022

    6.5. Absolute $ Opportunity Analysis By Nerve Repair, 2023 to 2033

7. Global Market Analysis 2018 to 2022 and Forecast 2023 to 2033, By End User

    7.1. Introduction / Key Findings

    7.2. Historical Market Size Value (US$ Million) Analysis By End User, 2018 to 2022

    7.3. Current and Future Market Size Value (US$ Million) Analysis and Forecast By End User, 2023 to 2033

        7.3.1. Hospitals

        7.3.2. Ambulatory Surgical Centers

        7.3.3. Specialty Clinics

    7.4. Y-o-Y Growth Trend Analysis By End User, 2018 to 2022

    7.5. Absolute $ Opportunity Analysis By End User, 2023 to 2033

8. Global Market Analysis 2018 to 2022 and Forecast 2023 to 2033, By Region

    8.1. Introduction

    8.2. Historical Market Size Value (US$ Million) Analysis By Region, 2018 to 2022

    8.3. Current Market Size Value (US$ Million) Analysis and Forecast By Region, 2023 to 2033

        8.3.1. North America

        8.3.2. Latin America

        8.3.3. Western Europe

        8.3.4. Eastern Europe

        8.3.5. South Asia and Pacific

        8.3.6. East Asia

        8.3.7. Middle East and Africa

    8.4. Market Attractiveness Analysis By Region

9. North America Market Analysis 2018 to 2022 and Forecast 2023 to 2033, By Country

    9.1. Historical Market Size Value (US$ Million) Trend Analysis By Market Taxonomy, 2018 to 2022

    9.2. Market Size Value (US$ Million) Forecast By Market Taxonomy, 2023 to 2033

        9.2.1. By Country

            9.2.1.1. U.S.

            9.2.1.2. Canada

        9.2.2. By Product

        9.2.3. By Nerve Repair

        9.2.4. By End User

    9.3. Market Attractiveness Analysis

        9.3.1. By Country

        9.3.2. By Product

        9.3.3. By Nerve Repair

        9.3.4. By End User

    9.4. Key Takeaways

10. Latin America Market Analysis 2018 to 2022 and Forecast 2023 to 2033, By Country

    10.1. Historical Market Size Value (US$ Million) Trend Analysis By Market Taxonomy, 2018 to 2022

    10.2. Market Size Value (US$ Million) Forecast By Market Taxonomy, 2023 to 2033

        10.2.1. By Country

            10.2.1.1. Brazil

            10.2.1.2. Mexico

            10.2.1.3. Rest of Latin America

        10.2.2. By Product

        10.2.3. By Nerve Repair

        10.2.4. By End User

    10.3. Market Attractiveness Analysis

        10.3.1. By Country

        10.3.2. By Product

        10.3.3. By Nerve Repair

        10.3.4. By End User

    10.4. Key Takeaways

11. Western Europe Market Analysis 2018 to 2022 and Forecast 2023 to 2033, By Country

    11.1. Historical Market Size Value (US$ Million) Trend Analysis By Market Taxonomy, 2018 to 2022

    11.2. Market Size Value (US$ Million) Forecast By Market Taxonomy, 2023 to 2033

        11.2.1. By Country

            11.2.1.1. Germany

            11.2.1.2. U.K.

            11.2.1.3. France

            11.2.1.4. Spain

            11.2.1.5. Italy

            11.2.1.6. Rest of Western Europe

        11.2.2. By Product

        11.2.3. By Nerve Repair

        11.2.4. By End User

    11.3. Market Attractiveness Analysis

        11.3.1. By Country

        11.3.2. By Product

        11.3.3. By Nerve Repair

        11.3.4. By End User

    11.4. Key Takeaways

12. Eastern Europe Market Analysis 2018 to 2022 and Forecast 2023 to 2033, By Country

    12.1. Historical Market Size Value (US$ Million) Trend Analysis By Market Taxonomy, 2018 to 2022

    12.2. Market Size Value (US$ Million) Forecast By Market Taxonomy, 2023 to 2033

        12.2.1. By Country

            12.2.1.1. Poland

            12.2.1.2. Russia

            12.2.1.3. Czech Republic

            12.2.1.4. Romania

            12.2.1.5. Rest of Eastern Europe

        12.2.2. By Product

        12.2.3. By Nerve Repair

        12.2.4. By End User

    12.3. Market Attractiveness Analysis

        12.3.1. By Country

        12.3.2. By Product

        12.3.3. By Nerve Repair

        12.3.4. By End User

    12.4. Key Takeaways

13. South Asia and Pacific Market Analysis 2018 to 2022 and Forecast 2023 to 2033, By Country

    13.1. Historical Market Size Value (US$ Million) Trend Analysis By Market Taxonomy, 2018 to 2022

    13.2. Market Size Value (US$ Million) Forecast By Market Taxonomy, 2023 to 2033

        13.2.1. By Country

            13.2.1.1. India

            13.2.1.2. Bangladesh

            13.2.1.3. Australia

            13.2.1.4. New Zealand

            13.2.1.5. Rest of South Asia and Pacific

        13.2.2. By Product

        13.2.3. By Nerve Repair

        13.2.4. By End User

    13.3. Market Attractiveness Analysis

        13.3.1. By Country

        13.3.2. By Product

        13.3.3. By Nerve Repair

        13.3.4. By End User

    13.4. Key Takeaways

14. East Asia Market Analysis 2018 to 2022 and Forecast 2023 to 2033, By Country

    14.1. Historical Market Size Value (US$ Million) Trend Analysis By Market Taxonomy, 2018 to 2022

    14.2. Market Size Value (US$ Million) Forecast By Market Taxonomy, 2023 to 2033

        14.2.1. By Country

            14.2.1.1. China

            14.2.1.2. Japan

            14.2.1.3. South Korea

        14.2.2. By Product

        14.2.3. By Nerve Repair

        14.2.4. By End User

    14.3. Market Attractiveness Analysis

        14.3.1. By Country

        14.3.2. By Product

        14.3.3. By Nerve Repair

        14.3.4. By End User

    14.4. Key Takeaways

15. Middle East and Africa Market Analysis 2018 to 2022 and Forecast 2023 to 2033, By Country

    15.1. Historical Market Size Value (US$ Million) Trend Analysis By Market Taxonomy, 2018 to 2022

    15.2. Market Size Value (US$ Million) Forecast By Market Taxonomy, 2023 to 2033

        15.2.1. By Country

            15.2.1.1. GCC Countries

            15.2.1.2. South Africa

            15.2.1.3. Israel

            15.2.1.4. Rest of MEA

        15.2.2. By Product

        15.2.3. By Nerve Repair

        15.2.4. By End User

    15.3. Market Attractiveness Analysis

        15.3.1. By Country

        15.3.2. By Product

        15.3.3. By Nerve Repair

        15.3.4. By End User

    15.4. Key Takeaways

16. Key Countries Market Analysis

    16.1. U.S.

        16.1.1. Pricing Analysis

        16.1.2. Market Share Analysis, 2022

            16.1.2.1. By Product

            16.1.2.2. By Nerve Repair

            16.1.2.3. By End User

    16.2. Canada

        16.2.1. Pricing Analysis

        16.2.2. Market Share Analysis, 2022

            16.2.2.1. By Product

            16.2.2.2. By Nerve Repair

            16.2.2.3. By End User

    16.3. Brazil

        16.3.1. Pricing Analysis

        16.3.2. Market Share Analysis, 2022

            16.3.2.1. By Product

            16.3.2.2. By Nerve Repair

            16.3.2.3. By End User

    16.4. Mexico

        16.4.1. Pricing Analysis

        16.4.2. Market Share Analysis, 2022

            16.4.2.1. By Product

            16.4.2.2. By Nerve Repair

            16.4.2.3. By End User

    16.5. Germany

        16.5.1. Pricing Analysis

        16.5.2. Market Share Analysis, 2022

            16.5.2.1. By Product

            16.5.2.2. By Nerve Repair

            16.5.2.3. By End User

    16.6. U.K.

        16.6.1. Pricing Analysis

        16.6.2. Market Share Analysis, 2022

            16.6.2.1. By Product

            16.6.2.2. By Nerve Repair

            16.6.2.3. By End User

    16.7. France

        16.7.1. Pricing Analysis

        16.7.2. Market Share Analysis, 2022

            16.7.2.1. By Product

            16.7.2.2. By Nerve Repair

            16.7.2.3. By End User

    16.8. Spain

        16.8.1. Pricing Analysis

        16.8.2. Market Share Analysis, 2022

            16.8.2.1. By Product

            16.8.2.2. By Nerve Repair

            16.8.2.3. By End User

    16.9. Italy

        16.9.1. Pricing Analysis

        16.9.2. Market Share Analysis, 2022

            16.9.2.1. By Product

            16.9.2.2. By Nerve Repair

            16.9.2.3. By End User

    16.10. Poland

        16.10.1. Pricing Analysis

        16.10.2. Market Share Analysis, 2022

            16.10.2.1. By Product

            16.10.2.2. By Nerve Repair

            16.10.2.3. By End User

    16.11. Russia

        16.11.1. Pricing Analysis

        16.11.2. Market Share Analysis, 2022

            16.11.2.1. By Product

            16.11.2.2. By Nerve Repair

            16.11.2.3. By End User

    16.12. Czech Republic

        16.12.1. Pricing Analysis

        16.12.2. Market Share Analysis, 2022

            16.12.2.1. By Product

            16.12.2.2. By Nerve Repair

            16.12.2.3. By End User

    16.13. Romania

        16.13.1. Pricing Analysis

        16.13.2. Market Share Analysis, 2022

            16.13.2.1. By Product

            16.13.2.2. By Nerve Repair

            16.13.2.3. By End User

    16.14. India

        16.14.1. Pricing Analysis

        16.14.2. Market Share Analysis, 2022

            16.14.2.1. By Product

            16.14.2.2. By Nerve Repair

            16.14.2.3. By End User

    16.15. Bangladesh

        16.15.1. Pricing Analysis

        16.15.2. Market Share Analysis, 2022

            16.15.2.1. By Product

            16.15.2.2. By Nerve Repair

            16.15.2.3. By End User

    16.16. Australia

        16.16.1. Pricing Analysis

        16.16.2. Market Share Analysis, 2022

            16.16.2.1. By Product

            16.16.2.2. By Nerve Repair

            16.16.2.3. By End User

    16.17. New Zealand

        16.17.1. Pricing Analysis

        16.17.2. Market Share Analysis, 2022

            16.17.2.1. By Product

            16.17.2.2. By Nerve Repair

            16.17.2.3. By End User

    16.18. China

        16.18.1. Pricing Analysis

        16.18.2. Market Share Analysis, 2022

            16.18.2.1. By Product

            16.18.2.2. By Nerve Repair

            16.18.2.3. By End User

    16.19. Japan

        16.19.1. Pricing Analysis

        16.19.2. Market Share Analysis, 2022

            16.19.2.1. By Product

            16.19.2.2. By Nerve Repair

            16.19.2.3. By End User

    16.20. South Korea

        16.20.1. Pricing Analysis

        16.20.2. Market Share Analysis, 2022

            16.20.2.1. By Product

            16.20.2.2. By Nerve Repair

            16.20.2.3. By End User

    16.21. GCC Countries

        16.21.1. Pricing Analysis

        16.21.2. Market Share Analysis, 2022

            16.21.2.1. By Product

            16.21.2.2. By Nerve Repair

            16.21.2.3. By End User

    16.22. South Africa

        16.22.1. Pricing Analysis

        16.22.2. Market Share Analysis, 2022

            16.22.2.1. By Product

            16.22.2.2. By Nerve Repair

            16.22.2.3. By End User

    16.23. Israel

        16.23.1. Pricing Analysis

        16.23.2. Market Share Analysis, 2022

            16.23.2.1. By Product

            16.23.2.2. By Nerve Repair

            16.23.2.3. By End User

17. Market Structure Analysis

    17.1. Competition Dashboard

    17.2. Competition Benchmarking

    17.3. Market Share Analysis of Top Players

        17.3.1. By Regional

        17.3.2. By Product

        17.3.3. By Nerve Repair

        17.3.4. By End User

18. Competition Analysis

    18.1. Competition Deep Dive

        18.1.1. Axogen Inc.

            18.1.1.1. Overview

            18.1.1.2. Product Portfolio

            18.1.1.3. Profitability by Market Segments

            18.1.1.4. Sales Footprint

            18.1.1.5. Strategy Overview

                18.1.1.5.1. Marketing Strategy

        18.1.2. Stryker Corporation

            18.1.2.1. Overview

            18.1.2.2. Product Portfolio

            18.1.2.3. Profitability by Market Segments

            18.1.2.4. Sales Footprint

            18.1.2.5. Strategy Overview

                18.1.2.5.1. Marketing Strategy

        18.1.3. Baxter International Inc.

            18.1.3.1. Overview

            18.1.3.2. Product Portfolio

            18.1.3.3. Profitability by Market Segments

            18.1.3.4. Sales Footprint

            18.1.3.5. Strategy Overview

                18.1.3.5.1. Marketing Strategy

        18.1.4. Integra Lifesciences Holdings Corp

            18.1.4.1. Overview

            18.1.4.2. Product Portfolio

            18.1.4.3. Profitability by Market Segments

            18.1.4.4. Sales Footprint

            18.1.4.5. Strategy Overview

                18.1.4.5.1. Marketing Strategy

        18.1.5. Neurotex Ltd

            18.1.5.1. Overview

            18.1.5.2. Product Portfolio

            18.1.5.3. Profitability by Market Segments

            18.1.5.4. Sales Footprint

            18.1.5.5. Strategy Overview

                18.1.5.5.1. Marketing Strategy

        18.1.6. Polyganics B.V.

            18.1.6.1. Overview

            18.1.6.2. Product Portfolio

            18.1.6.3. Profitability by Market Segments

            18.1.6.4. Sales Footprint

            18.1.6.5. Strategy Overview

                18.1.6.5.1. Marketing Strategy

        18.1.7. Abbott Laboratories

            18.1.7.1. Overview

            18.1.7.2. Product Portfolio

            18.1.7.3. Profitability by Market Segments

            18.1.7.4. Sales Footprint

            18.1.7.5. Strategy Overview

                18.1.7.5.1. Marketing Strategy

        18.1.8. Boston Scientific Inc

            18.1.8.1. Overview

            18.1.8.2. Product Portfolio

            18.1.8.3. Profitability by Market Segments

            18.1.8.4. Sales Footprint

            18.1.8.5. Strategy Overview

                18.1.8.5.1. Marketing Strategy

        18.1.9. Medtronic Plc

            18.1.9.1. Overview

            18.1.9.2. Product Portfolio

            18.1.9.3. Profitability by Market Segments

            18.1.9.4. Sales Footprint

            18.1.9.5. Strategy Overview

                18.1.9.5.1. Marketing Strategy

        18.1.10. Checkpoint Surgical

            18.1.10.1. Overview

            18.1.10.2. Product Portfolio

            18.1.10.3. Profitability by Market Segments

            18.1.10.4. Sales Footprint

            18.1.10.5. Strategy Overview

                18.1.10.5.1. Marketing Strategy

        18.1.11. Polyganics

            18.1.11.1. Overview

            18.1.11.2. Product Portfolio

            18.1.11.3. Profitability by Market Segments

            18.1.11.4. Sales Footprint

            18.1.11.5. Strategy Overview

                18.1.11.5.1. Marketing Strategy

        18.1.12. Synovis Micro Companies Alliance

            18.1.12.1. Overview

            18.1.12.2. Product Portfolio

            18.1.12.3. Profitability by Market Segments

            18.1.12.4. Sales Footprint

            18.1.12.5. Strategy Overview

                18.1.12.5.1. Marketing Strategy

        18.1.13. Orthomed, Inc

            18.1.13.1. Overview

            18.1.13.2. Product Portfolio

            18.1.13.3. Profitability by Market Segments

            18.1.13.4. Sales Footprint

            18.1.13.5. Strategy Overview

                18.1.13.5.1. Marketing Strategy

19. Assumptions & Acronyms Used

20. Research Methodology

Don't pay for what you don't need

Customize your report by selecting specific countries or regions and save 30%!

List of Tables

Table 1: Global Market Value (US$ Million) Forecast by Region, 2018 to 2033

Table 2: Global Market Value (US$ Million) Forecast by Product, 2018 to 2033

Table 3: Global Market Value (US$ Million) Forecast by Nerve Repair, 2018 to 2033

Table 4: Global Market Value (US$ Million) Forecast by End User, 2018 to 2033

Table 5: North America Market Value (US$ Million) Forecast by Country, 2018 to 2033

Table 6: North America Market Value (US$ Million) Forecast by Product, 2018 to 2033

Table 7: North America Market Value (US$ Million) Forecast by Nerve Repair, 2018 to 2033

Table 8: North America Market Value (US$ Million) Forecast by End User, 2018 to 2033

Table 9: Latin America Market Value (US$ Million) Forecast by Country, 2018 to 2033

Table 10: Latin America Market Value (US$ Million) Forecast by Product, 2018 to 2033

Table 11: Latin America Market Value (US$ Million) Forecast by Nerve Repair, 2018 to 2033

Table 12: Latin America Market Value (US$ Million) Forecast by End User, 2018 to 2033

Table 13: Western Europe Market Value (US$ Million) Forecast by Country, 2018 to 2033

Table 14: Western Europe Market Value (US$ Million) Forecast by Product, 2018 to 2033

Table 15: Western Europe Market Value (US$ Million) Forecast by Nerve Repair, 2018 to 2033

Table 16: Western Europe Market Value (US$ Million) Forecast by End User, 2018 to 2033

Table 17: Eastern Europe Market Value (US$ Million) Forecast by Country, 2018 to 2033

Table 18: Eastern Europe Market Value (US$ Million) Forecast by Product, 2018 to 2033

Table 19: Eastern Europe Market Value (US$ Million) Forecast by Nerve Repair, 2018 to 2033

Table 20: Eastern Europe Market Value (US$ Million) Forecast by End User, 2018 to 2033

Table 21: South Asia and Pacific Market Value (US$ Million) Forecast by Country, 2018 to 2033

Table 22: South Asia and Pacific Market Value (US$ Million) Forecast by Product, 2018 to 2033

Table 23: South Asia and Pacific Market Value (US$ Million) Forecast by Nerve Repair, 2018 to 2033

Table 24: South Asia and Pacific Market Value (US$ Million) Forecast by End User, 2018 to 2033

Table 25: East Asia Market Value (US$ Million) Forecast by Country, 2018 to 2033

Table 26: East Asia Market Value (US$ Million) Forecast by Product, 2018 to 2033

Table 27: East Asia Market Value (US$ Million) Forecast by Nerve Repair, 2018 to 2033

Table 28: East Asia Market Value (US$ Million) Forecast by End User, 2018 to 2033

Table 29: Middle East and Africa Market Value (US$ Million) Forecast by Country, 2018 to 2033

Table 30: Middle East and Africa Market Value (US$ Million) Forecast by Product, 2018 to 2033

Table 31: Middle East and Africa Market Value (US$ Million) Forecast by Nerve Repair, 2018 to 2033

Table 32: Middle East and Africa Market Value (US$ Million) Forecast by End User, 2018 to 2033
Sabyasachi Ghosh
Sabyasachi Ghosh

Principal Consultant

Talk to Analyst

Find your sweet spots for generating winning opportunities in this market.

List of Charts

Figure 1: Global Market Value (US$ Million) by Product, 2023 to 2033

Figure 2: Global Market Value (US$ Million) by Nerve Repair, 2023 to 2033

Figure 3: Global Market Value (US$ Million) by End User, 2023 to 2033

Figure 4: Global Market Value (US$ Million) by Region, 2023 to 2033

Figure 5: Global Market Value (US$ Million) Analysis by Region, 2018 to 2033

Figure 6: Global Market Value Share (%) and BPS Analysis by Region, 2023 to 2033

Figure 7: Global Market Y-o-Y Growth (%) Projections by Region, 2023 to 2033

Figure 8: Global Market Value (US$ Million) Analysis by Product, 2018 to 2033

Figure 9: Global Market Value Share (%) and BPS Analysis by Product, 2023 to 2033

Figure 10: Global Market Y-o-Y Growth (%) Projections by Product, 2023 to 2033

Figure 11: Global Market Value (US$ Million) Analysis by Nerve Repair, 2018 to 2033

Figure 12: Global Market Value Share (%) and BPS Analysis by Nerve Repair, 2023 to 2033

Figure 13: Global Market Y-o-Y Growth (%) Projections by Nerve Repair, 2023 to 2033

Figure 14: Global Market Value (US$ Million) Analysis by End User, 2018 to 2033

Figure 15: Global Market Value Share (%) and BPS Analysis by End User, 2023 to 2033

Figure 16: Global Market Y-o-Y Growth (%) Projections by End User, 2023 to 2033

Figure 17: Global Market Attractiveness by Product, 2023 to 2033

Figure 18: Global Market Attractiveness by Nerve Repair, 2023 to 2033

Figure 19: Global Market Attractiveness by End User, 2023 to 2033

Figure 20: Global Market Attractiveness by Region, 2023 to 2033

Figure 21: North America Market Value (US$ Million) by Product, 2023 to 2033

Figure 22: North America Market Value (US$ Million) by Nerve Repair, 2023 to 2033

Figure 23: North America Market Value (US$ Million) by End User, 2023 to 2033

Figure 24: North America Market Value (US$ Million) by Country, 2023 to 2033

Figure 25: North America Market Value (US$ Million) Analysis by Country, 2018 to 2033

Figure 26: North America Market Value Share (%) and BPS Analysis by Country, 2023 to 2033

Figure 27: North America Market Y-o-Y Growth (%) Projections by Country, 2023 to 2033

Figure 28: North America Market Value (US$ Million) Analysis by Product, 2018 to 2033

Figure 29: North America Market Value Share (%) and BPS Analysis by Product, 2023 to 2033

Figure 30: North America Market Y-o-Y Growth (%) Projections by Product, 2023 to 2033

Figure 31: North America Market Value (US$ Million) Analysis by Nerve Repair, 2018 to 2033

Figure 32: North America Market Value Share (%) and BPS Analysis by Nerve Repair, 2023 to 2033

Figure 33: North America Market Y-o-Y Growth (%) Projections by Nerve Repair, 2023 to 2033

Figure 34: North America Market Value (US$ Million) Analysis by End User, 2018 to 2033

Figure 35: North America Market Value Share (%) and BPS Analysis by End User, 2023 to 2033

Figure 36: North America Market Y-o-Y Growth (%) Projections by End User, 2023 to 2033

Figure 37: North America Market Attractiveness by Product, 2023 to 2033

Figure 38: North America Market Attractiveness by Nerve Repair, 2023 to 2033

Figure 39: North America Market Attractiveness by End User, 2023 to 2033

Figure 40: North America Market Attractiveness by Country, 2023 to 2033

Figure 41: Latin America Market Value (US$ Million) by Product, 2023 to 2033

Figure 42: Latin America Market Value (US$ Million) by Nerve Repair, 2023 to 2033

Figure 43: Latin America Market Value (US$ Million) by End User, 2023 to 2033

Figure 44: Latin America Market Value (US$ Million) by Country, 2023 to 2033

Figure 45: Latin America Market Value (US$ Million) Analysis by Country, 2018 to 2033

Figure 46: Latin America Market Value Share (%) and BPS Analysis by Country, 2023 to 2033

Figure 47: Latin America Market Y-o-Y Growth (%) Projections by Country, 2023 to 2033

Figure 48: Latin America Market Value (US$ Million) Analysis by Product, 2018 to 2033

Figure 49: Latin America Market Value Share (%) and BPS Analysis by Product, 2023 to 2033

Figure 50: Latin America Market Y-o-Y Growth (%) Projections by Product, 2023 to 2033

Figure 51: Latin America Market Value (US$ Million) Analysis by Nerve Repair, 2018 to 2033

Figure 52: Latin America Market Value Share (%) and BPS Analysis by Nerve Repair, 2023 to 2033

Figure 53: Latin America Market Y-o-Y Growth (%) Projections by Nerve Repair, 2023 to 2033

Figure 54: Latin America Market Value (US$ Million) Analysis by End User, 2018 to 2033

Figure 55: Latin America Market Value Share (%) and BPS Analysis by End User, 2023 to 2033

Figure 56: Latin America Market Y-o-Y Growth (%) Projections by End User, 2023 to 2033

Figure 57: Latin America Market Attractiveness by Product, 2023 to 2033

Figure 58: Latin America Market Attractiveness by Nerve Repair, 2023 to 2033

Figure 59: Latin America Market Attractiveness by End User, 2023 to 2033

Figure 60: Latin America Market Attractiveness by Country, 2023 to 2033

Figure 61: Western Europe Market Value (US$ Million) by Product, 2023 to 2033

Figure 62: Western Europe Market Value (US$ Million) by Nerve Repair, 2023 to 2033

Figure 63: Western Europe Market Value (US$ Million) by End User, 2023 to 2033

Figure 64: Western Europe Market Value (US$ Million) by Country, 2023 to 2033

Figure 65: Western Europe Market Value (US$ Million) Analysis by Country, 2018 to 2033

Figure 66: Western Europe Market Value Share (%) and BPS Analysis by Country, 2023 to 2033

Figure 67: Western Europe Market Y-o-Y Growth (%) Projections by Country, 2023 to 2033

Figure 68: Western Europe Market Value (US$ Million) Analysis by Product, 2018 to 2033

Figure 69: Western Europe Market Value Share (%) and BPS Analysis by Product, 2023 to 2033

Figure 70: Western Europe Market Y-o-Y Growth (%) Projections by Product, 2023 to 2033

Figure 71: Western Europe Market Value (US$ Million) Analysis by Nerve Repair, 2018 to 2033

Figure 72: Western Europe Market Value Share (%) and BPS Analysis by Nerve Repair, 2023 to 2033

Figure 73: Western Europe Market Y-o-Y Growth (%) Projections by Nerve Repair, 2023 to 2033

Figure 74: Western Europe Market Value (US$ Million) Analysis by End User, 2018 to 2033

Figure 75: Western Europe Market Value Share (%) and BPS Analysis by End User, 2023 to 2033

Figure 76: Western Europe Market Y-o-Y Growth (%) Projections by End User, 2023 to 2033

Figure 77: Western Europe Market Attractiveness by Product, 2023 to 2033

Figure 78: Western Europe Market Attractiveness by Nerve Repair, 2023 to 2033

Figure 79: Western Europe Market Attractiveness by End User, 2023 to 2033

Figure 80: Western Europe Market Attractiveness by Country, 2023 to 2033

Figure 81: Eastern Europe Market Value (US$ Million) by Product, 2023 to 2033

Figure 82: Eastern Europe Market Value (US$ Million) by Nerve Repair, 2023 to 2033

Figure 83: Eastern Europe Market Value (US$ Million) by End User, 2023 to 2033

Figure 84: Eastern Europe Market Value (US$ Million) by Country, 2023 to 2033

Figure 85: Eastern Europe Market Value (US$ Million) Analysis by Country, 2018 to 2033

Figure 86: Eastern Europe Market Value Share (%) and BPS Analysis by Country, 2023 to 2033

Figure 87: Eastern Europe Market Y-o-Y Growth (%) Projections by Country, 2023 to 2033

Figure 88: Eastern Europe Market Value (US$ Million) Analysis by Product, 2018 to 2033

Figure 89: Eastern Europe Market Value Share (%) and BPS Analysis by Product, 2023 to 2033

Figure 90: Eastern Europe Market Y-o-Y Growth (%) Projections by Product, 2023 to 2033

Figure 91: Eastern Europe Market Value (US$ Million) Analysis by Nerve Repair, 2018 to 2033

Figure 92: Eastern Europe Market Value Share (%) and BPS Analysis by Nerve Repair, 2023 to 2033

Figure 93: Eastern Europe Market Y-o-Y Growth (%) Projections by Nerve Repair, 2023 to 2033

Figure 94: Eastern Europe Market Value (US$ Million) Analysis by End User, 2018 to 2033

Figure 95: Eastern Europe Market Value Share (%) and BPS Analysis by End User, 2023 to 2033

Figure 96: Eastern Europe Market Y-o-Y Growth (%) Projections by End User, 2023 to 2033

Figure 97: Eastern Europe Market Attractiveness by Product, 2023 to 2033

Figure 98: Eastern Europe Market Attractiveness by Nerve Repair, 2023 to 2033

Figure 99: Eastern Europe Market Attractiveness by End User, 2023 to 2033

Figure 100: Eastern Europe Market Attractiveness by Country, 2023 to 2033

Figure 101: South Asia and Pacific Market Value (US$ Million) by Product, 2023 to 2033

Figure 102: South Asia and Pacific Market Value (US$ Million) by Nerve Repair, 2023 to 2033

Figure 103: South Asia and Pacific Market Value (US$ Million) by End User, 2023 to 2033

Figure 104: South Asia and Pacific Market Value (US$ Million) by Country, 2023 to 2033

Figure 105: South Asia and Pacific Market Value (US$ Million) Analysis by Country, 2018 to 2033

Figure 106: South Asia and Pacific Market Value Share (%) and BPS Analysis by Country, 2023 to 2033

Figure 107: South Asia and Pacific Market Y-o-Y Growth (%) Projections by Country, 2023 to 2033

Figure 108: South Asia and Pacific Market Value (US$ Million) Analysis by Product, 2018 to 2033

Figure 109: South Asia and Pacific Market Value Share (%) and BPS Analysis by Product, 2023 to 2033

Figure 110: South Asia and Pacific Market Y-o-Y Growth (%) Projections by Product, 2023 to 2033

Figure 111: South Asia and Pacific Market Value (US$ Million) Analysis by Nerve Repair, 2018 to 2033

Figure 112: South Asia and Pacific Market Value Share (%) and BPS Analysis by Nerve Repair, 2023 to 2033

Figure 113: South Asia and Pacific Market Y-o-Y Growth (%) Projections by Nerve Repair, 2023 to 2033

Figure 114: South Asia and Pacific Market Value (US$ Million) Analysis by End User, 2018 to 2033

Figure 115: South Asia and Pacific Market Value Share (%) and BPS Analysis by End User, 2023 to 2033

Figure 116: South Asia and Pacific Market Y-o-Y Growth (%) Projections by End User, 2023 to 2033

Figure 117: South Asia and Pacific Market Attractiveness by Product, 2023 to 2033

Figure 118: South Asia and Pacific Market Attractiveness by Nerve Repair, 2023 to 2033

Figure 119: South Asia and Pacific Market Attractiveness by End User, 2023 to 2033

Figure 120: South Asia and Pacific Market Attractiveness by Country, 2023 to 2033

Figure 121: East Asia Market Value (US$ Million) by Product, 2023 to 2033

Figure 122: East Asia Market Value (US$ Million) by Nerve Repair, 2023 to 2033

Figure 123: East Asia Market Value (US$ Million) by End User, 2023 to 2033

Figure 124: East Asia Market Value (US$ Million) by Country, 2023 to 2033

Figure 125: East Asia Market Value (US$ Million) Analysis by Country, 2018 to 2033

Figure 126: East Asia Market Value Share (%) and BPS Analysis by Country, 2023 to 2033

Figure 127: East Asia Market Y-o-Y Growth (%) Projections by Country, 2023 to 2033

Figure 128: East Asia Market Value (US$ Million) Analysis by Product, 2018 to 2033

Figure 129: East Asia Market Value Share (%) and BPS Analysis by Product, 2023 to 2033

Figure 130: East Asia Market Y-o-Y Growth (%) Projections by Product, 2023 to 2033

Figure 131: East Asia Market Value (US$ Million) Analysis by Nerve Repair, 2018 to 2033

Figure 132: East Asia Market Value Share (%) and BPS Analysis by Nerve Repair, 2023 to 2033

Figure 133: East Asia Market Y-o-Y Growth (%) Projections by Nerve Repair, 2023 to 2033

Figure 134: East Asia Market Value (US$ Million) Analysis by End User, 2018 to 2033

Figure 135: East Asia Market Value Share (%) and BPS Analysis by End User, 2023 to 2033

Figure 136: East Asia Market Y-o-Y Growth (%) Projections by End User, 2023 to 2033

Figure 137: East Asia Market Attractiveness by Product, 2023 to 2033

Figure 138: East Asia Market Attractiveness by Nerve Repair, 2023 to 2033

Figure 139: East Asia Market Attractiveness by End User, 2023 to 2033

Figure 140: East Asia Market Attractiveness by Country, 2023 to 2033

Figure 141: Middle East and Africa Market Value (US$ Million) by Product, 2023 to 2033

Figure 142: Middle East and Africa Market Value (US$ Million) by Nerve Repair, 2023 to 2033

Figure 143: Middle East and Africa Market Value (US$ Million) by End User, 2023 to 2033

Figure 144: Middle East and Africa Market Value (US$ Million) by Country, 2023 to 2033

Figure 145: Middle East and Africa Market Value (US$ Million) Analysis by Country, 2018 to 2033

Figure 146: Middle East and Africa Market Value Share (%) and BPS Analysis by Country, 2023 to 2033

Figure 147: Middle East and Africa Market Y-o-Y Growth (%) Projections by Country, 2023 to 2033

Figure 148: Middle East and Africa Market Value (US$ Million) Analysis by Product, 2018 to 2033

Figure 149: Middle East and Africa Market Value Share (%) and BPS Analysis by Product, 2023 to 2033

Figure 150: Middle East and Africa Market Y-o-Y Growth (%) Projections by Product, 2023 to 2033

Figure 151: Middle East and Africa Market Value (US$ Million) Analysis by Nerve Repair, 2018 to 2033

Figure 152: Middle East and Africa Market Value Share (%) and BPS Analysis by Nerve Repair, 2023 to 2033

Figure 153: Middle East and Africa Market Y-o-Y Growth (%) Projections by Nerve Repair, 2023 to 2033

Figure 154: Middle East and Africa Market Value (US$ Million) Analysis by End User, 2018 to 2033

Figure 155: Middle East and Africa Market Value Share (%) and BPS Analysis by End User, 2023 to 2033

Figure 156: Middle East and Africa Market Y-o-Y Growth (%) Projections by End User, 2023 to 2033

Figure 157: Middle East and Africa Market Attractiveness by Product, 2023 to 2033

Figure 158: Middle East and Africa Market Attractiveness by Nerve Repair, 2023 to 2033

Figure 159: Middle East and Africa Market Attractiveness by End User, 2023 to 2033

Figure 160: Middle East and Africa Market Attractiveness by Country, 2023 to 2033

Recommendations

Healthcare

Nerve Monitoring Devices Market

Published : June 2022

Healthcare

Vagus Nerve Stimulator Market

Published : November 2018

Explore Healthcare Insights

View Reports