Reports

- Global Locations -

Headquarters

Future Market Insights, Inc.

Christiana Corporate, 200
Continental Drive, Suite 401,
Newark, Delaware - 19713,
United States

T: +1-845-579-5705

Americas

Future Market Insights, Inc.

616 Corporate Way, Suite 2-9018,
Valley Cottage, NY 10989, United States

T: +1-347-918-3531

MEA

Future Market Insights

1602-6 Jumeirah Bay X2 Tower, Plot No: JLT-PH2-X2A,
Jumeirah Lakes Towers, Dubai,
United Arab Emirates

Europe

Future Market Insights

3rd Floor, 207 Regent Street,
W1B 3HH London
United Kingdom

T: + 44 (0) 20 8123 9659
D: +44 (0) 20 3287 4268

Asia Pacific

Future Market Insights

IndiaLand Global Tech Park, Unit UG-1, Behind Grand HighStreet, Phase 1, Hinjawadi, MH, Pune – 411057, India

Off-highway Electric Vehicle Market Outlook (2023 to 2033)

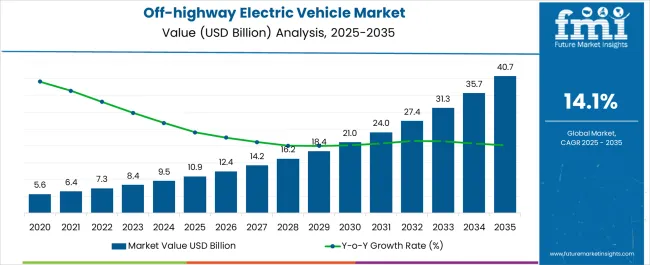
The global off-highway electric vehicle market size is projected to be valued at US$ 2.24 billion in 2023. Off-highway electric vehicle sales are expected to reach US$ 8.36 billion by 2033, inflating at a CAGR of 14.1% from 2023 to 2033.

The market is experiencing a dynamic growth trajectory, propelled by a convergence of multiple drivers, transforming the industry landscape. Key among these drivers is the rising global demand for sustainable and eco-friendly mobility solutions that minimize carbon emissions and reduce environmental impact. The growing concerns regarding environmental pollution and climate change also act as key motivators for market expansion.

The growing demand for affordable and effective transportation options, the expansion of government initiatives to encourage the use of electric vehicles, and growing consumer awareness of the advantages of electric vehicles are additional factors driving the off-highway electric vehicle market. Furthermore, the advent of cutting-edge technologies, such as battery storage systems and electric powertrains, is providing off-highway vehicle manufacturers with a unique opportunity to develop innovative products that offer enhanced performance, efficiency, and reliability.

Government policies to lower greenhouse gas emissions and advance sustainable development are encouraging investment in off-highway electric vehicle infrastructure. Off-road vehicle emissions are strictly regulated by many governmental agencies, including the China VI and India BS-VI emission standards.

Emission limits for greenhouse gases (GHGs) were also imposed by the United States Environmental Protection Agency (EPA). Equipment manufacturers focus on alternative engine alternatives, such as full and hybrid off-highway electric vehicles. This, in turn, is accelerating the use of electric cars in a variety of sectors.

The market is observing many noteworthy trends, such as the spread of hybrid and electric off-highway vehicles across numerous industries, the advancement of advanced battery and charging technologies, and the emergence of intelligent and autonomous off-highway vehicles. The use of electric tractors, excavators, loaders, and other construction equipment is significantly increasing in the market. The industry is expanding in part because of the growing demand for electric vehicles in the agricultural and mining industries.

Opportunities in the off-highway electric vehicle market include the development of new and innovative products, the diversification of product lines, and the investigation of new markets. The creation of off-highway electric vehicles that can function in harsh environments, the development of off-highway vehicles that are tailored for particular tasks and functions, and the creation of cutting-edge telematics systems that can enhance vehicle performance and efficiency. Key players in the market are concentrating on spending capital on research and development to create cutting-edge goods that can satisfy changing consumer demands.

Attributes Details
Off-highway Electric Vehicle Market Value (2023) US$ 2.24 billion
Off-highway Electric Vehicle Market Expected Value (2033) US$ 8.36 billion
Off-highway Electric Vehicle Market Projected CAGR (2023 to 2033) 14.1%

Don't pay for what you don't need

Customize your report by selecting specific countries or regions and save 30%!

2018 to 2022 Off-highway Electric Vehicle Market Outlook Compared to 2023 to 2033 Forecast

From 2018 to 2022, the off-highway electric vehicle market grew significantly. For a variety of variables, including escalating environmental concerns, strict governmental rules, and expanding investment in electric vehicle technology, the industry experienced a boom in demand.

The rise in demand for electric cars in the construction, mining, and agricultural industries is responsible for the market's expansion. The switch to electric cars has resulted in a considerable decrease in carbon emissions and increased operating efficiency for these businesses, which were previously reliant on fossil fuel-powered vehicles.

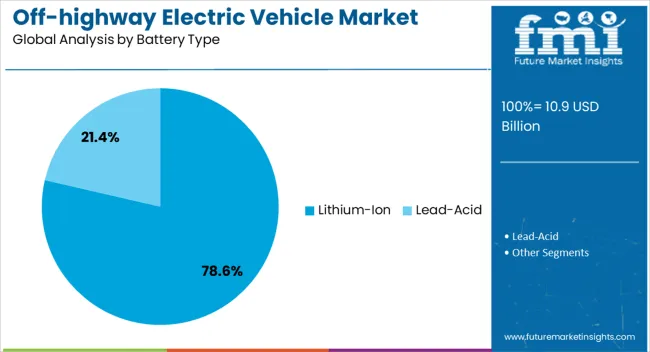
The market has expanded as a result of developments in battery technology and charging infrastructure. Longer operational ranges and quicker charging periods made possible by the use of lithium-ion batteries have improved the viability of electric cars for off-highway applications.

The off-highway electric vehicle market is expected to experience significant growth in the coming years. Here are several short-term, mid-term, and long-term growth opportunities for the market:

  • Short Term (2023 to 2026): Off-highway electric vehicles are likely to become more widely used and more inexpensive shortly as the cost of batteries and electric motors declines. To keep up with the increased demand for off-highway electric cars, several manufacturers are increasing their production capacity.

Customers could benefit from this by having more options and shorter lead times. By providing incentives and subsidies, governments throughout the world are encouraging the usage of electric cars. The demand for off-highway electric cars is projected to increase as a result in the near future.

  • Medium Term (2026 to 2029): Longer range, quicker charging times, and better performance are all going to be made possible by improvements in battery and electric motor technology for off-highway electric vehicles. Off-highway electric vehicles are projected to have a bigger market share in the medium term as the trend toward the electrification of cars is predicted to continue. Demand for electric vehicles, which have fewer emissions and a smaller environmental effect, is growing as sustainability becomes a bigger priority. These variables could probably fuel market expansion throughout this period.
  • Long Term (2029 to 2033): In a variety of sectors, including mining and construction, the development of autonomous off-highway electric vehicles is anticipated to boost production and efficiency. Off-road electric cars can function as energy storage devices to assist the grid run smoothly and promote the integration of renewable energy sources. Hydrogen fuel cells, which provide greater ranges and quicker refilling periods, could replace batteries as a practical option in off-highway electric cars. These factors are likely to fuel market expansion in a long run.

These factors are anticipated to support a 3.7X increase in the off-highway electric vehicle market between 2023 and 2033. The market is projected to be worth US$ 8.36 billion by the end of 2033, according to FMI analysts.

Comparative Analysis of the Adjacent Off-highway Electric Vehicle Market

Off-highway Electric Vehicle Market:

Differentiating Aspects Off-highway Electric Vehicle Market
CAGR (2023 to 2033) 14.1%
Market Valuation in 2023 US$ 2.24 billion
Projected Market Value in 2033 US$ 8.36 billion
Growth Factors Government initiatives and regulations promoting the adoption of electric vehicles
Opportunities Integration of renewable energy sources to power off-highway electric vehicles
Key Trends Development of specialized electric vehicles for off-road and heavy-duty applications

Off-highway Vehicle (OHV) Telematics Market:

Differentiating Aspects Off-highway Vehicle (OHV) Telematics Market
CAGR (2023 to 2033) 15%
Market Valuation in 2023 US$ 556.77 million
Projected Market Value in 2033 US$ 2.25 billion
Growth Factors Increasing demand for OHVs in various industries such as agriculture, construction, mining, and forestry
Opportunities Collaboration between telematics providers and OHV manufacturers to develop integrated solutions
Key Trends Adoption of cloud-based telematics platforms for remote monitoring and management of OHV fleets

Electric Utility Vehicle  Market:

Differentiating Aspects Electric Utility Vehicle  Market
CAGR (2023 to 2033) 15.4%
Market Valuation in 2023 US$ 9.20 million
Projected Market Value in 2033 US$ 38.55 billion
Growth Factors Growing demand for electric utility vehicles in industries due to their high performance and low operating costs
Opportunities Expansion of electric utility vehicle offerings to include new segments such as last-mile delivery
Key Trends Development of autonomous and semi-autonomous electric utility vehicles for improved safety and efficiency
Nikhil Kaitwade
Nikhil Kaitwade

Principal Consultant

Talk to Analyst

Find your sweet spots for generating winning opportunities in this market.

Exploring the Regional Patterns of the Off-highway Electric Vehicle Market: An In-depth Examination at the Country Level

Electric Excavators, Loaders, and Dozers Take Center Stage in North America's Off-highway Vehicle Industry

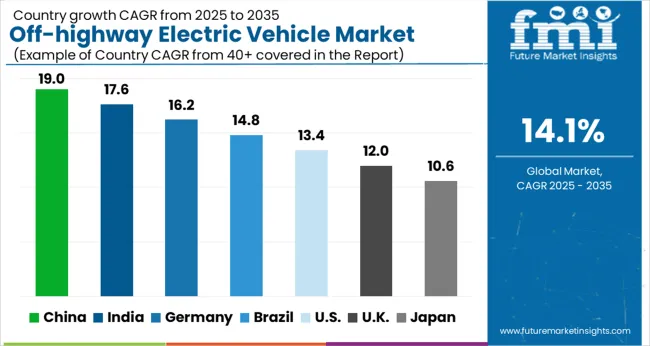
The North America off-highway electric vehicle market dominates the global market. This market is anticipated to expand at a CAGR of 29% over the projected period. The expansion can be attributable to the existence of important businesses in North America such as Deere & Company, CNH Industrial N.V., Volvo Group, and Caterpillar. Also, the expansion of the local construction sector is boosting demand for off-highway electric machinery.

The United States off-highway electric vehicle market is expected to experience significant growth in the coming years. The United States is one of the leading off-highway electric vehicle markets given its strong infrastructure and favorable government policies that promote the adoption of electric vehicles. The construction industry is one of the leading users of off-highway electric vehicles in the United States, as electric excavators, bulldozers, and other equipment have become increasingly popular due to their lower functioning expenses and condensed environmental impact.

The primary trend in the off-highway electric vehicle business is for well-known firms to introduce new products to keep ahead of their competitors. For instance, in January 2022, The Volvo Group unveiled an electric truck in the United States with a greater range. With a range extension of up to 85% and quicker charging, this truck is a modified Volvo VNR Electric. This class 8 electric truck type has an operational range of up to 440 km and a larger energy storage capacity of up to 565 kWh.

To reduce hazardous emissions, the United States has put in place severe laws. The United States Environment Protection Agency (EPA) claims that in 2018, off-road vehicles and equipment contributed close to 30% of all greenhouse gas emissions. Companies have released electric versions of their off-highway vehicles on the market in response to growing GHG emissions. The government seeks to spend US$ 906 million on the nation's infrastructure through the INFRA discretionary grant program, the United States Department of Transportation (DoT) announced in June 2020. The government places a high focus on the nation's infrastructure. As a consequence, throughout the projection period, opportunities are likely to present themselves for market players in off-road electric cars.
Government Incentives Drive Surge in Off-highway Electric Vehicle Sales across Europe

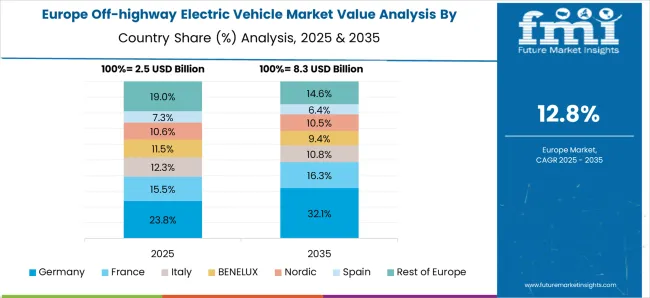
Throughout the projection period, Europe’s off-highway electric vehicle market is anticipated to expand at a CAGR of 25%. The market in Europe is expected to increase significantly as a result of rising infrastructure investments and rules limiting diesel emissions from heavy equipment.

For the past few years, the German government has continuously made investments in top-notch infrastructureThe German government has implemented several initiatives to encourage the adoption of electric vehicles, including off-highway vehicles. One of the main initiatives is the National Platform Future of Mobility, which aims to promote sustainable and eco-friendly transportation solutions, including off-highway electric vehicles.

Owing to Germany's rapidly increasing infrastructure industry, which is particularly strong in the field of roads, highways, and transportation infrastructure, other concrete and road machinery markets in the nation could experience substantial growth. The Off-highway Electrification Roadmap is an initiative that the German Federal Ministry for the Environment, Natural Conservation, and Nuclear Safety (BMU) initiated in 2019 to encourage the creation and use of electric off-highway vehicles. By 2030, the initiative hopes to reduce CO2 emissions from off-highway vehicles by 30%. Additionally, Germany has implemented the "Environmental Bonus" program that provides financial incentives for the purchase of electric vehicles, including off-highway vehicles.

Off-road electric cars have lately been created by several firms for the German market. For instance, John Deere has created the SESAM (Sustainable Energy Supply for Agricultural Machinery) electric tractor, which employs a hybrid energy source made up of batteries and an onboard generator. In the interim, Fendt created the e100 Vario electric tractor, which comes equipped with an electric motor and battery-powered driving system.

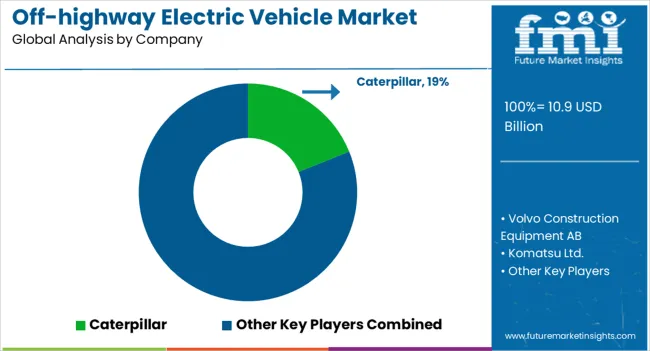
The Cat 323F Z-line is the first electric excavator produced by Caterpillar, the leading manufacturer of construction equipment in the world. The EC55 Electric, EC60E Electric, and EC220E Electric are just a few of the electric excavators that have been introduced by Volvo Construction Equipment, another significant competitor in the sector.

The United Kingdom off-highway electric vehicle market has been growing in recent years, with increasing government initiatives to promote the adoption of electric vehicles across the country. Off-highway vehicles are one of the efforts the government in the United Kingdom has made to encourage the use of electric cars there. A US$ 433.28 million fund was established by the government in 2019 to build out the nation's infrastructure for electric car charging stations. Also, the government gave subsidies and tax breaks for companies buying electric vehicles.

The government has been aggressively encouraging the use of electric cars through several programs, including the Road to Zero policy, which intends to phase out the sale of conventional petrol and diesel vehicles by 2040. The government has also unveiled a US$2.71 billion strategy to promote EV adoption, which includes boosting the use of electric public transportation and expanding EV charging infrastructure. To promote the purchase of electric cars, including off-highway EVs, the government has also established tax incentives and subsidies.

The off-highway electric vehicle market in the United Kingdom is seeing significant investment from several manufacturers. An electric mini-excavator and an electric dumper truck, for instance, were created by JCB, one of the biggest producers of construction equipment worldwide. Together with the introduction of an electric compact excavator by Volvo Construction Equipment, other businesses like Caterpillar and Komatsu are also making investments in the creation of electric machinery.

Off-highway Electric Vehicles Poised to Revolutionize Asia Pacific’s Recreational Vehicle Market

According to FMI projections, the CAGR for the Asia Pacific off-highway electric vehicle market could be 15% between 2023 and 2033. With increasing construction activities, the region is anticipated to be a prominent market. A rise in infrastructure spending helped nations like Japan and China have a successful year in 2022.

The China off-highway electric vehicle market is growing rapidly, driven by government support for electrification and the country's push toward clean energy. China is a key producer of construction equipment because of its numerous original equipment manufacturers (OEMs), inexpensive labor, low production costs, and top-notch manufacturing facilities. Given the ongoing One Belt One Road effort, crane demand is rising in China. The program is likely to support the construction of buildings, railroads, and energy projects, among other forms of infrastructure.

Off-highway vehicle sales have increased as a result of an increase in mineral exploration locations and the ensuing need for sophisticated processing equipment. In 2019, China accounted for more than 50% of the global electric vehicle market, including off-highway electric vehicles. Shanxi province in China has loosened up on strict government regulations and expects to increase coke production capacity by approximately 11 million tonnes to satisfy rising demand.

The Chinese government has implemented several policies to promote the use of off-highway electric vehicles, such as tax incentives, subsidies, and the inclusion of electric vehicles in its "Made in China 2025" plan. In 2020, the government announced a new policy that incentivizes the production and sale of off-highway EVs, including tax breaks, subsidies, and preferential treatment for companies that develop and produce these vehicles.

Many Chinese companies are investing in the development of off-highway electric vehicles, with leading players such as XCMG, Sany, and Zoomlion already offering electric versions of their construction machinery. Chinese EV manufacturer BYD has been expanding its off-highway EV portfolio, with products ranging from forklifts to excavators. In 2020, the company announced a partnership with Brazilian mining company Vale to develop a fleet of electric mining trucks.

The Japan off-highway electric vehicle market is rapidly growing, driven by government initiatives and the recent development of manufacturers. Japanese manufacturers are actively developing off-highway EVs to meet the demand and take advantage of government incentives. To cut emissions and improve energy efficiency, the Japanese government has encouraged the deployment of EVs in the off-road industry. The government introduced a subsidy scheme in 2020 to promote the purchase of off-highway EVs, including construction equipment, agricultural equipment, and forklifts. The program offers qualified organizations up to 50% of the cost of EVs.

Komatsu, one of the leading construction equipment manufacturers in Japan, has been developing hybrid and all-electric construction equipment. The company launched its first all-electric mini excavator, the PC30E-5, in 2020. In September 2022, Komatsu accomplished the actual transfiguration of biomass combustion ash into fertilizer at its Awazu Plant, assisting in the lessening of industrial waste by reprocessing forest resources in Japan's Ishikawa Prefecture's Kaga area.

Hitachi Construction Machinery Co., Ltd. is a significant competitor in the market. Over the past few years, the business has been creating electric-powered forklifts and excavators. The ZX60E-5A electric excavator from Hitachi was introduced in 2021 which has a lithium-ion battery and can run for up to five hours on a single charge. Other factors influencing the off-highway electric vehicle industry in Japan are the growing emphasis on sustainability and the demand for lower emissions. Also, the price of electric vehicles has been gradually falling, making them more accessible to both consumers and companies.

Exploring the Off-highway Electric Vehicle Market: An In-depth Segment Analysis

Hybrid Electric Vehicles Lead the Charge in Off-highway Market Revolution

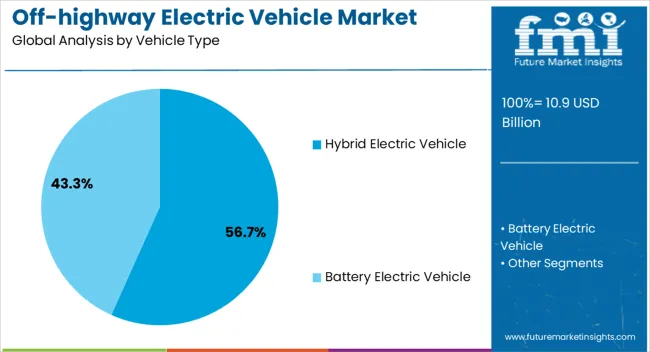
The Hybrid Electric Vehicle (HEV) segment has emerged as the dominant force in the off-highway electric vehicle market. Since they combine an electric motor with a gasoline or diesel engine, HEVs are more energy-efficient than conventional internal combustion engines. Whereas the gasoline or diesel engine delivers power at high speeds, the electric motor offers power at low speeds and during acceleration. With the help of this combination, HEVs can run more effectively while using less gasoline.

HEVs provide more versatility in terms of utilization. They can be utilized in a variety of off-highway operations like construction, mining, ranching, and forestry. HEVs are a preferred option for manufacturers of off-highway vehicles due to their adaptability. Regarding dependability and durability, HEVs have a solid track record. They have shown to be strong and reliable over their many years of usage in the automobile sector. This has increased consumer and producer trust in their performance and helped them become widely used in the off-highway industry.

The development of the HEV segment in the off-highway industry has also been significantly influenced by government incentives and restrictions. HEVs satisfy the standards set forth by several governments that are pushing for the use of cleaner and more effective automobiles. HEV uptake has also been aided by incentives like tax exemptions and subsidies for their purchase.

Construction Industry Drives Off-highway Electric Vehicle Market with Dominance in Sales

The off-highway electric vehicle market is dominated by the construction sector for several reasons. First off, there is a rising need for more sustainable practices in the construction sector because the sector contributes significantly to greenhouse gas emissions. Off-highway electric vehicle use is one such environmentally friendly approach that lowers the carbon footprint of the sector.

Second, numerous heavy-duty labor in the construction sector necessitates the use of robust equipment. Off-highway electric vehicles can give the necessary strength and durability and, over time, are more economical and energy-efficient. Eventually, since the construction market is so fiercely competitive, businesses are constantly seeking methods to cut expenses and boost productivity. Off-highway electric vehicle use contributes to the achievement of these objectives by lowering fuel consumption and upkeep expenses.

Lastly, governments and regulatory agencies are pushing harder than ever to encourage the adoption of sustainable energy in the construction sector. Off-highway electric vehicles are becoming more appealing as a consequence of incentives and tax credits being provided to firms who invest in them. This helps them to save on expenses and comply with rules.
Get the data you need at a Fraction of the cost

Personalize your report by choosing insights you need
and save 40%!

Battle of the Titans: Top Companies Vying for Dominance in the Off-highway Electric Vehicle Market

Manufacturers in the off-highway electric vehicle market have been implementing various strategies to capture a share of the growing market. Here are certain key strategies and recent developments:

Electric powertrain development: Several manufacturers are creating their own electric powertrains or collaborating with businesses that are experts in the field. For instance, Caterpillar and Fisker Inc. have collaborated on the design and production of electric off-road vehicles. The 310L EP, the company's first entirely electric digger, was unveiled by John Deere in 2021. The introduction of a solely remote-controlled, entirely electric (non-hydraulic drive), tiny excavator was announced by Komatsu Ltd. in July 2021. This 3-ton class excavator is entirely electric and is powered by a lithium-ion battery.

Electrification of existing products: Excavators, bulldozers, and loaders are just a few examples of the current goods that several manufacturers are creating electric versions of. For instance, Caterpillar introduced the Cat 323F Z-line, its first electric excavator, in 2021. It delivers performance comparable to that of its diesel cousin, but with fewer emissions and operational expenses. Using 350 kW permanent magnet synchronous motors, high-energy-density lithium iron phosphate batteries, and contemporary monitoring capabilities including real-time monitoring, performance analysis, and remote diagnostics, SANY Group introduced the electric version of its truck mixers in August 2020.

Battery technology: Off-highway electric vehicle success depends on the development of cutting-edge battery technology. Many producers are making investments in battery research & development activities and collaborations with battery suppliers. Proterra and Komatsu announced a cooperation in 2020 to manufacture electric mining machinery using Proterra's high-power battery technology.

Digitalization and connectivity: Off-highway electric vehicle performance and economy can be improved through digitalization and networking. To track and improve car performance, manufacturers are implementing digital technology like telematics, GPS, and artificial intelligence. For instance, in 2021 Volvo CE unveiled an electric wheel loader with telematics for remote vehicle performance monitoring.

Partnerships and collaborations: To expand their selection of electric vehicles, several manufacturers have formed partnerships with other businesses. For instance, Komatsu and battery producer Proterra collaborated to create an electric excavator with a quick-charging mechanism. To provide electric drivetrain solutions for off-highway vehicles, John Deere has also joined up with electric powertrain supplier AxleTech.

Acquisitions and investments: To acquire access to cutting-edge technology and experience, several firms are buying or investing in electric car businesses. To guarantee a supply of environmentally friendly batteries for its electric machinery, Volvo Construction Equipment bought a stake in battery maker FREYR in 2021. To increase its selection of electric vehicles, Hitachi Construction Machinery bought a share in KCM the same year.

Sustainability and environmental impact: Manufacturing companies are investing in electric off-highway vehicles as a method to lessen the environmental effect of their goods in light of the growing emphasis on sustainability and cutting carbon emissions. The 19C-1E, a completely electric small excavator from JCB that emits no emissions, was introduced in 2019. John Deere declared its intention to cut its greenhouse gas emissions by 30% by 2030 in 2021.

Research and development: Numerous manufacturers are spending money on research & development activities to raise the effectiveness and performance of their electric cars. For instance, Kubota has created an electric tractor with self-driving capabilities, while JCB has created an electric compact excavator with a five-hour range. The introduction of a solely remote-controlled, entirely electric (non-hydraulic drive), mini excavator was announced by Komatsu Ltd. in July 2021. This 3-ton class excavator is entirely electric and is powered by a lithium-ion battery.

Marketing and promotion: Manufacturers are also emphasizing the advantages of lower pollutants, less noise, and cheaper running costs when marketing their electric vehicles to stakeholders and consumers. To promote its electric cars and environmental activities, for instance, Volvo Construction Equipment has started a worldwide marketing campaign called "Building Future."

Prominent players in the global off-highway electric vehicle market

  • Caterpillar
  • Volvo Construction Equipment AB
  • Komatsu Ltd.
  • J C Bamford Excavators Ltd.
  • CNH Industrial N.V.
  • Deere & Company
  • Epiroc AB
  • Sandvik AB
  • Hitachi Construction Machinery Co., Ltd.
  • Doosan Corporation

Off-highway Electric Vehicle Market Segmentation

By Vehicle Type:

  • Hybrid Electric Vehicle
  • Battery Electric Vehicle

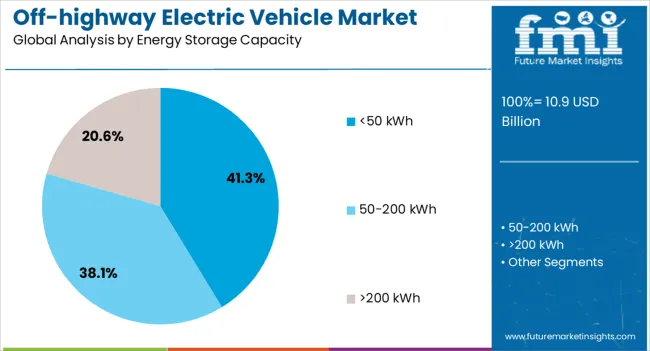
By Energy Storage Capacity:

  • <50 kWh
  • 50-200 kWh
  • >200 kWh

By Battery Type:

  • Lithium-Ion
  • Lead-Acid

By Application:

  • Construction
  • Agriculture
  • Mining
  • Others

By Region:

  • North America
  • Latin America
  • Eastern Europe
  • Western Europe
  • Asia Pacific
  • Japan
  • Middle East & Africa

Frequently Asked Questions

What Opportunity is Taken for the Growth of the Market?

Integration of renewable energy sources to power off-highway electric vehicles.

What Drives Sales of the Market?

Government initiatives and regulations promoting the adoption of electric vehicles.

How does Europe Dominate the Market?

Government incentives drive a surge in off-highway electric vehicle sales across Europe.

What is the Projected Market Value in 2033?

The market is estimated to be worth US$ 2.25 billion.

Which Region is Estimated to Drive the Global Market?

North America is estimated to secure a CAGR of 29% from 2023 to 2033.

Table of Content

1. Executive Summary | Off-highway Electric Vehicle Market

    1.1. Global Market Outlook

    1.2. Demand-side Trends

    1.3. Supply-side Trends

    1.4. Technology Roadmap Analysis

    1.5. Analysis and Recommendations

2. Market Overview

    2.1. Market Coverage / Taxonomy

    2.2. Market Definition / Scope / Limitations

3. Market Background

    3.1. Market Dynamics

        3.1.1. Drivers

        3.1.2. Restraints

        3.1.3. Opportunity

        3.1.4. Trends

    3.2. Scenario Forecast

        3.2.1. Demand in Optimistic Scenario

        3.2.2. Demand in Likely Scenario

        3.2.3. Demand in Conservative Scenario

    3.3. Opportunity Map Analysis

    3.4. Product Life Cycle Analysis

    3.5. Supply Chain Analysis

        3.5.1. Supply Side Participants and their Roles

            3.5.1.1. Producers

            3.5.1.2. Mid-Level Participants (Traders/ Agents/ Brokers)

            3.5.1.3. Wholesalers and Distributors

        3.5.2. Value Added and Value Created at Node in the Supply Chain

        3.5.3. List of Raw Material Suppliers

        3.5.4. List of Existing and Potential Buyers

    3.6. Investment Feasibility Matrix

    3.7. Value Chain Analysis

        3.7.1. Profit Margin Analysis

        3.7.2. Wholesalers and Distributors

        3.7.3. Retailers

    3.8. PESTLE and Porter’s Analysis

    3.9. Regulatory Landscape

        3.9.1. By Key Regions

        3.9.2. By Key Countries

    3.10. Regional Parent Market Outlook

    3.11. Production and Consumption Statistics

    3.12. Import and Export Statistics

4. Global Market Analysis 2018 to 2022 and Forecast, 2023 to 2033

    4.1. Historical Market Size Value (US$ Million) & Volume (Units) Analysis, 2018 to 2022

    4.2. Current and Future Market Size Value (US$ Million) & Volume (Units) Projections, 2023 to 2033

        4.2.1. Y-o-Y Growth Trend Analysis

        4.2.2. Absolute $ Opportunity Analysis

5. Global Market Analysis 2018 to 2022 and Forecast 2023 to 2033, By Application

    5.1. Introduction / Key Findings

    5.2. Historical Market Size Value (US$ Million) & Volume (Units) Analysis By Application, 2018 to 2022

    5.3. Current and Future Market Size Value (US$ Million) & Volume (Units) Analysis and Forecast By Application, 2023 to 2033

        5.3.1. Construction

        5.3.2. Agriculture

        5.3.3. Mining

    5.4. Y-o-Y Growth Trend Analysis By Application, 2018 to 2022

    5.5. Absolute $ Opportunity Analysis By Application, 2023 to 2033

6. Global Market Analysis 2018 to 2022 and Forecast 2023 to 2033, By Propulsion

    6.1. Introduction / Key Findings

    6.2. Historical Market Size Value (US$ Million) & Volume (Units) Analysis By Propulsion, 2018 to 2022

    6.3. Current and Future Market Size Value (US$ Million) & Volume (Units) Analysis and Forecast By Propulsion, 2023 to 2033

        6.3.1. Battery Electric Vehicle

        6.3.2. Hybrid Electric Vehicle

    6.4. Y-o-Y Growth Trend Analysis By Propulsion, 2018 to 2022

    6.5. Absolute $ Opportunity Analysis By Propulsion, 2023 to 2033

7. Global Market Analysis 2018 to 2022 and Forecast 2023 to 2033, By Storage Type

    7.1. Introduction / Key Findings

    7.2. Historical Market Size Value (US$ Million) & Volume (Units) Analysis By Storage Type, 2018 to 2022

    7.3. Current and Future Market Size Value (US$ Million) & Volume (Units) Analysis and Forecast By Storage Type, 2023 to 2033

        7.3.1. Li-ion

        7.3.2. Lead-acid

    7.4. Y-o-Y Growth Trend Analysis By Storage Type, 2018 to 2022

    7.5. Absolute $ Opportunity Analysis By Storage Type, 2023 to 2033

8. Global Market Analysis 2018 to 2022 and Forecast 2023 to 2033, By Region

    8.1. Introduction

    8.2. Historical Market Size Value (US$ Million) & Volume (Units) Analysis By Region, 2018 to 2022

    8.3. Current Market Size Value (US$ Million) & Volume (Units) Analysis and Forecast By Region, 2023 to 2033

        8.3.1. North America

        8.3.2. Latin America

        8.3.3. Europe

        8.3.4. Asia Pacific

        8.3.5. MEA

    8.4. Market Attractiveness Analysis By Region

9. North America Market Analysis 2018 to 2022 and Forecast 2023 to 2033, By Country

    9.1. Historical Market Size Value (US$ Million) & Volume (Units) Trend Analysis By Market Taxonomy, 2018 to 2022

    9.2. Market Size Value (US$ Million) & Volume (Units) Forecast By Market Taxonomy, 2023 to 2033

        9.2.1. By Country

            9.2.1.1. USA

            9.2.1.2. Canada

        9.2.2. By Application

        9.2.3. By Propulsion

        9.2.4. By Storage Type

    9.3. Market Attractiveness Analysis

        9.3.1. By Country

        9.3.2. By Application

        9.3.3. By Propulsion

        9.3.4. By Storage Type

    9.4. Key Takeaways

10. Latin America Market Analysis 2018 to 2022 and Forecast 2023 to 2033, By Country

    10.1. Historical Market Size Value (US$ Million) & Volume (Units) Trend Analysis By Market Taxonomy, 2018 to 2022

    10.2. Market Size Value (US$ Million) & Volume (Units) Forecast By Market Taxonomy, 2023 to 2033

        10.2.1. By Country

            10.2.1.1. Brazil

            10.2.1.2. Mexico

            10.2.1.3. Rest of Latin America

        10.2.2. By Application

        10.2.3. By Propulsion

        10.2.4. By Storage Type

    10.3. Market Attractiveness Analysis

        10.3.1. By Country

        10.3.2. By Application

        10.3.3. By Propulsion

        10.3.4. By Storage Type

    10.4. Key Takeaways

11. Europe Market Analysis 2018 to 2022 and Forecast 2023 to 2033, By Country

    11.1. Historical Market Size Value (US$ Million) & Volume (Units) Trend Analysis By Market Taxonomy, 2018 to 2022

    11.2. Market Size Value (US$ Million) & Volume (Units) Forecast By Market Taxonomy, 2023 to 2033

        11.2.1. By Country

            11.2.1.1. Germany

            11.2.1.2. UNITED KINGDOM

            11.2.1.3. France

            11.2.1.4. Spain

            11.2.1.5. Italy

            11.2.1.6. Rest of Europe

        11.2.2. By Application

        11.2.3. By Propulsion

        11.2.4. By Storage Type

    11.3. Market Attractiveness Analysis

        11.3.1. By Country

        11.3.2. By Application

        11.3.3. By Propulsion

        11.3.4. By Storage Type

    11.4. Key Takeaways

12. Asia Pacific Market Analysis 2018 to 2022 and Forecast 2023 to 2033, By Country

    12.1. Historical Market Size Value (US$ Million) & Volume (Units) Trend Analysis By Market Taxonomy, 2018 to 2022

    12.2. Market Size Value (US$ Million) & Volume (Units) Forecast By Market Taxonomy, 2023 to 2033

        12.2.1. By Country

            12.2.1.1. China

            12.2.1.2. Japan

            12.2.1.3. South Korea

            12.2.1.4. Singapore

            12.2.1.5. Thailand

            12.2.1.6. Indonesia

            12.2.1.7. Australia

            12.2.1.8. New Zealand

            12.2.1.9. Rest of Asia Pacific

        12.2.2. By Application

        12.2.3. By Propulsion

        12.2.4. By Storage Type

    12.3. Market Attractiveness Analysis

        12.3.1. By Country

        12.3.2. By Application

        12.3.3. By Propulsion

        12.3.4. By Storage Type

    12.4. Key Takeaways

13. MEA Market Analysis 2018 to 2022 and Forecast 2023 to 2033, By Country

    13.1. Historical Market Size Value (US$ Million) & Volume (Units) Trend Analysis By Market Taxonomy, 2018 to 2022

    13.2. Market Size Value (US$ Million) & Volume (Units) Forecast By Market Taxonomy, 2023 to 2033

        13.2.1. By Country

            13.2.1.1. GCC Countries

            13.2.1.2. South Africa

            13.2.1.3. Israel

            13.2.1.4. Rest of MEA

        13.2.2. By Application

        13.2.3. By Propulsion

        13.2.4. By Storage Type

    13.3. Market Attractiveness Analysis

        13.3.1. By Country

        13.3.2. By Application

        13.3.3. By Propulsion

        13.3.4. By Storage Type

    13.4. Key Takeaways

14. Key Countries Market Analysis

    14.1. USA

        14.1.1. Pricing Analysis

        14.1.2. Market Share Analysis, 2022

            14.1.2.1. By Application

            14.1.2.2. By Propulsion

            14.1.2.3. By Storage Type

    14.2. Canada

        14.2.1. Pricing Analysis

        14.2.2. Market Share Analysis, 2022

            14.2.2.1. By Application

            14.2.2.2. By Propulsion

            14.2.2.3. By Storage Type

    14.3. Brazil

        14.3.1. Pricing Analysis

        14.3.2. Market Share Analysis, 2022

            14.3.2.1. By Application

            14.3.2.2. By Propulsion

            14.3.2.3. By Storage Type

    14.4. Mexico

        14.4.1. Pricing Analysis

        14.4.2. Market Share Analysis, 2022

            14.4.2.1. By Application

            14.4.2.2. By Propulsion

            14.4.2.3. By Storage Type

    14.5. Germany

        14.5.1. Pricing Analysis

        14.5.2. Market Share Analysis, 2022

            14.5.2.1. By Application

            14.5.2.2. By Propulsion

            14.5.2.3. By Storage Type

    14.6. UNITED KINGDOM

        14.6.1. Pricing Analysis

        14.6.2. Market Share Analysis, 2022

            14.6.2.1. By Application

            14.6.2.2. By Propulsion

            14.6.2.3. By Storage Type

    14.7. France

        14.7.1. Pricing Analysis

        14.7.2. Market Share Analysis, 2022

            14.7.2.1. By Application

            14.7.2.2. By Propulsion

            14.7.2.3. By Storage Type

    14.8. Spain

        14.8.1. Pricing Analysis

        14.8.2. Market Share Analysis, 2022

            14.8.2.1. By Application

            14.8.2.2. By Propulsion

            14.8.2.3. By Storage Type

    14.9. Italy

        14.9.1. Pricing Analysis

        14.9.2. Market Share Analysis, 2022

            14.9.2.1. By Application

            14.9.2.2. By Propulsion

            14.9.2.3. By Storage Type

    14.10. China

        14.10.1. Pricing Analysis

        14.10.2. Market Share Analysis, 2022

            14.10.2.1. By Application

            14.10.2.2. By Propulsion

            14.10.2.3. By Storage Type

    14.11. Japan

        14.11.1. Pricing Analysis

        14.11.2. Market Share Analysis, 2022

            14.11.2.1. By Application

            14.11.2.2. By Propulsion

            14.11.2.3. By Storage Type

    14.12. South Korea

        14.12.1. Pricing Analysis

        14.12.2. Market Share Analysis, 2022

            14.12.2.1. By Application

            14.12.2.2. By Propulsion

            14.12.2.3. By Storage Type

    14.13. Singapore

        14.13.1. Pricing Analysis

        14.13.2. Market Share Analysis, 2022

            14.13.2.1. By Application

            14.13.2.2. By Propulsion

            14.13.2.3. By Storage Type

    14.14. Thailand

        14.14.1. Pricing Analysis

        14.14.2. Market Share Analysis, 2022

            14.14.2.1. By Application

            14.14.2.2. By Propulsion

            14.14.2.3. By Storage Type

    14.15. Indonesia

        14.15.1. Pricing Analysis

        14.15.2. Market Share Analysis, 2022

            14.15.2.1. By Application

            14.15.2.2. By Propulsion

            14.15.2.3. By Storage Type

    14.16. Australia

        14.16.1. Pricing Analysis

        14.16.2. Market Share Analysis, 2022

            14.16.2.1. By Application

            14.16.2.2. By Propulsion

            14.16.2.3. By Storage Type

    14.17. New Zealand

        14.17.1. Pricing Analysis

        14.17.2. Market Share Analysis, 2022

            14.17.2.1. By Application

            14.17.2.2. By Propulsion

            14.17.2.3. By Storage Type

    14.18. GCC Countries

        14.18.1. Pricing Analysis

        14.18.2. Market Share Analysis, 2022

            14.18.2.1. By Application

            14.18.2.2. By Propulsion

            14.18.2.3. By Storage Type

    14.19. South Africa

        14.19.1. Pricing Analysis

        14.19.2. Market Share Analysis, 2022

            14.19.2.1. By Application

            14.19.2.2. By Propulsion

            14.19.2.3. By Storage Type

    14.20. Israel

        14.20.1. Pricing Analysis

        14.20.2. Market Share Analysis, 2022

            14.20.2.1. By Application

            14.20.2.2. By Propulsion

            14.20.2.3. By Storage Type

15. Market Structure Analysis

    15.1. Competition Dashboard

    15.2. Competition Benchmarking

    15.3. Market Share Analysis of Top Players

        15.3.1. By Regional

        15.3.2. By Application

        15.3.3. By Propulsion

        15.3.4. By Storage Type

16. Competition Analysis

    16.1. Competition Deep Dive

        16.1.1. Caterpillar

            16.1.1.1. Overview

            16.1.1.2. Product Portfolio

            16.1.1.3. Profitability by Market Segments

            16.1.1.4. Sales Footprint

            16.1.1.5. Strategy Overview

                16.1.1.5.1. Marketing Strategy

                16.1.1.5.2. Product Strategy

                16.1.1.5.3. Channel Strategy

        16.1.2. Volvo Construction Equipment AB

            16.1.2.1. Overview

            16.1.2.2. Product Portfolio

            16.1.2.3. Profitability by Market Segments

            16.1.2.4. Sales Footprint

            16.1.2.5. Strategy Overview

                16.1.2.5.1. Marketing Strategy

                16.1.2.5.2. Product Strategy

                16.1.2.5.3. Channel Strategy

        16.1.3. Komatsu Ltd.

            16.1.3.1. Overview

            16.1.3.2. Product Portfolio

            16.1.3.3. Profitability by Market Segments

            16.1.3.4. Sales Footprint

            16.1.3.5. Strategy Overview

                16.1.3.5.1. Marketing Strategy

                16.1.3.5.2. Product Strategy

                16.1.3.5.3. Channel Strategy

        16.1.4. Deere & Company

            16.1.4.1. Overview

            16.1.4.2. Product Portfolio

            16.1.4.3. Profitability by Market Segments

            16.1.4.4. Sales Footprint

            16.1.4.5. Strategy Overview

                16.1.4.5.1. Marketing Strategy

                16.1.4.5.2. Product Strategy

                16.1.4.5.3. Channel Strategy

        16.1.5. Sandvik AB

            16.1.5.1. Overview

            16.1.5.2. Product Portfolio

            16.1.5.3. Profitability by Market Segments

            16.1.5.4. Sales Footprint

            16.1.5.5. Strategy Overview

                16.1.5.5.1. Marketing Strategy

                16.1.5.5.2. Product Strategy

                16.1.5.5.3. Channel Strategy

        16.1.6. Hitachi Construction Machinery Co., Ltd.

            16.1.6.1. Overview

            16.1.6.2. Product Portfolio

            16.1.6.3. Profitability by Market Segments

            16.1.6.4. Sales Footprint

            16.1.6.5. Strategy Overview

                16.1.6.5.1. Marketing Strategy

                16.1.6.5.2. Product Strategy

                16.1.6.5.3. Channel Strategy

        16.1.7. Epiroc AB

            16.1.7.1. Overview

            16.1.7.2. Product Portfolio

            16.1.7.3. Profitability by Market Segments

            16.1.7.4. Sales Footprint

            16.1.7.5. Strategy Overview

                16.1.7.5.1. Marketing Strategy

                16.1.7.5.2. Product Strategy

                16.1.7.5.3. Channel Strategy

        16.1.8. Doosan Corporation

            16.1.8.1. Overview

            16.1.8.2. Product Portfolio

            16.1.8.3. Profitability by Market Segments

            16.1.8.4. Sales Footprint

            16.1.8.5. Strategy Overview

                16.1.8.5.1. Marketing Strategy

                16.1.8.5.2. Product Strategy

                16.1.8.5.3. Channel Strategy

        16.1.9. J C Bamford Excavators Ltd.

            16.1.9.1. Overview

            16.1.9.2. Product Portfolio

            16.1.9.3. Profitability by Market Segments

            16.1.9.4. Sales Footprint

            16.1.9.5. Strategy Overview

                16.1.9.5.1. Marketing Strategy

                16.1.9.5.2. Product Strategy

                16.1.9.5.3. Channel Strategy

        16.1.10. CNH Industrial N.V.

            16.1.10.1. Overview

            16.1.10.2. Product Portfolio

            16.1.10.3. Profitability by Market Segments

            16.1.10.4. Sales Footprint

            16.1.10.5. Strategy Overview

                16.1.10.5.1. Marketing Strategy

                16.1.10.5.2. Product Strategy

                16.1.10.5.3. Channel Strategy

17. Assumptions & Acronyms Used

18. Research Methodology

List of Tables

Table 1: Global Market Value (US$ Million) Forecast by Region, 2018 to 2033

Table 2: Global Market Volume (Units) Forecast by Region, 2018 to 2033

Table 3: Global Market Value (US$ Million) Forecast by Application, 2018 to 2033

Table 4: Global Market Volume (Units) Forecast by Application, 2018 to 2033

Table 5: Global Market Value (US$ Million) Forecast by Propulsion, 2018 to 2033

Table 6: Global Market Volume (Units) Forecast by Propulsion, 2018 to 2033

Table 7: Global Market Value (US$ Million) Forecast by Storage Type, 2018 to 2033

Table 8: Global Market Volume (Units) Forecast by Storage Type, 2018 to 2033

Table 9: North America Market Value (US$ Million) Forecast by Country, 2018 to 2033

Table 10: North America Market Volume (Units) Forecast by Country, 2018 to 2033

Table 11: North America Market Value (US$ Million) Forecast by Application, 2018 to 2033

Table 12: North America Market Volume (Units) Forecast by Application, 2018 to 2033

Table 13: North America Market Value (US$ Million) Forecast by Propulsion, 2018 to 2033

Table 14: North America Market Volume (Units) Forecast by Propulsion, 2018 to 2033

Table 15: North America Market Value (US$ Million) Forecast by Storage Type, 2018 to 2033

Table 16: North America Market Volume (Units) Forecast by Storage Type, 2018 to 2033

Table 17: Latin America Market Value (US$ Million) Forecast by Country, 2018 to 2033

Table 18: Latin America Market Volume (Units) Forecast by Country, 2018 to 2033

Table 19: Latin America Market Value (US$ Million) Forecast by Application, 2018 to 2033

Table 20: Latin America Market Volume (Units) Forecast by Application, 2018 to 2033

Table 21: Latin America Market Value (US$ Million) Forecast by Propulsion, 2018 to 2033

Table 22: Latin America Market Volume (Units) Forecast by Propulsion, 2018 to 2033

Table 23: Latin America Market Value (US$ Million) Forecast by Storage Type, 2018 to 2033

Table 24: Latin America Market Volume (Units) Forecast by Storage Type, 2018 to 2033

Table 25: Europe Market Value (US$ Million) Forecast by Country, 2018 to 2033

Table 26: Europe Market Volume (Units) Forecast by Country, 2018 to 2033

Table 27: Europe Market Value (US$ Million) Forecast by Application, 2018 to 2033

Table 28: Europe Market Volume (Units) Forecast by Application, 2018 to 2033

Table 29: Europe Market Value (US$ Million) Forecast by Propulsion, 2018 to 2033

Table 30: Europe Market Volume (Units) Forecast by Propulsion, 2018 to 2033

Table 31: Europe Market Value (US$ Million) Forecast by Storage Type, 2018 to 2033

Table 32: Europe Market Volume (Units) Forecast by Storage Type, 2018 to 2033

Table 33: Asia Pacific Market Value (US$ Million) Forecast by Country, 2018 to 2033

Table 34: Asia Pacific Market Volume (Units) Forecast by Country, 2018 to 2033

Table 35: Asia Pacific Market Value (US$ Million) Forecast by Application, 2018 to 2033

Table 36: Asia Pacific Market Volume (Units) Forecast by Application, 2018 to 2033

Table 37: Asia Pacific Market Value (US$ Million) Forecast by Propulsion, 2018 to 2033

Table 38: Asia Pacific Market Volume (Units) Forecast by Propulsion, 2018 to 2033

Table 39: Asia Pacific Market Value (US$ Million) Forecast by Storage Type, 2018 to 2033

Table 40: Asia Pacific Market Volume (Units) Forecast by Storage Type, 2018 to 2033

Table 41: MEA Market Value (US$ Million) Forecast by Country, 2018 to 2033

Table 42: MEA Market Volume (Units) Forecast by Country, 2018 to 2033

Table 43: MEA Market Value (US$ Million) Forecast by Application, 2018 to 2033

Table 44: MEA Market Volume (Units) Forecast by Application, 2018 to 2033

Table 45: MEA Market Value (US$ Million) Forecast by Propulsion, 2018 to 2033

Table 46: MEA Market Volume (Units) Forecast by Propulsion, 2018 to 2033

Table 47: MEA Market Value (US$ Million) Forecast by Storage Type, 2018 to 2033

Table 48: MEA Market Volume (Units) Forecast by Storage Type, 2018 to 2033

List of Charts

Figure 1: Global Market Value (US$ Million) by Application, 2023 to 2033

Figure 2: Global Market Value (US$ Million) by Propulsion, 2023 to 2033

Figure 3: Global Market Value (US$ Million) by Storage Type, 2023 to 2033

Figure 4: Global Market Value (US$ Million) by Region, 2023 to 2033

Figure 5: Global Market Value (US$ Million) Analysis by Region, 2018 to 2033

Figure 6: Global Market Volume (Units) Analysis by Region, 2018 to 2033

Figure 7: Global Market Value Share (%) and BPS Analysis by Region, 2023 to 2033

Figure 8: Global Market Y-o-Y Growth (%) Projections by Region, 2023 to 2033

Figure 9: Global Market Value (US$ Million) Analysis by Application, 2018 to 2033

Figure 10: Global Market Volume (Units) Analysis by Application, 2018 to 2033

Figure 11: Global Market Value Share (%) and BPS Analysis by Application, 2023 to 2033

Figure 12: Global Market Y-o-Y Growth (%) Projections by Application, 2023 to 2033

Figure 13: Global Market Value (US$ Million) Analysis by Propulsion, 2018 to 2033

Figure 14: Global Market Volume (Units) Analysis by Propulsion, 2018 to 2033

Figure 15: Global Market Value Share (%) and BPS Analysis by Propulsion, 2023 to 2033

Figure 16: Global Market Y-o-Y Growth (%) Projections by Propulsion, 2023 to 2033

Figure 17: Global Market Value (US$ Million) Analysis by Storage Type, 2018 to 2033

Figure 18: Global Market Volume (Units) Analysis by Storage Type, 2018 to 2033

Figure 19: Global Market Value Share (%) and BPS Analysis by Storage Type, 2023 to 2033

Figure 20: Global Market Y-o-Y Growth (%) Projections by Storage Type, 2023 to 2033

Figure 21: Global Market Attractiveness by Application, 2023 to 2033

Figure 22: Global Market Attractiveness by Propulsion, 2023 to 2033

Figure 23: Global Market Attractiveness by Storage Type, 2023 to 2033

Figure 24: Global Market Attractiveness by Region, 2023 to 2033

Figure 25: North America Market Value (US$ Million) by Application, 2023 to 2033

Figure 26: North America Market Value (US$ Million) by Propulsion, 2023 to 2033

Figure 27: North America Market Value (US$ Million) by Storage Type, 2023 to 2033

Figure 28: North America Market Value (US$ Million) by Country, 2023 to 2033

Figure 29: North America Market Value (US$ Million) Analysis by Country, 2018 to 2033

Figure 30: North America Market Volume (Units) Analysis by Country, 2018 to 2033

Figure 31: North America Market Value Share (%) and BPS Analysis by Country, 2023 to 2033

Figure 32: North America Market Y-o-Y Growth (%) Projections by Country, 2023 to 2033

Figure 33: North America Market Value (US$ Million) Analysis by Application, 2018 to 2033

Figure 34: North America Market Volume (Units) Analysis by Application, 2018 to 2033

Figure 35: North America Market Value Share (%) and BPS Analysis by Application, 2023 to 2033

Figure 36: North America Market Y-o-Y Growth (%) Projections by Application, 2023 to 2033

Figure 37: North America Market Value (US$ Million) Analysis by Propulsion, 2018 to 2033

Figure 38: North America Market Volume (Units) Analysis by Propulsion, 2018 to 2033

Figure 39: North America Market Value Share (%) and BPS Analysis by Propulsion, 2023 to 2033

Figure 40: North America Market Y-o-Y Growth (%) Projections by Propulsion, 2023 to 2033

Figure 41: North America Market Value (US$ Million) Analysis by Storage Type, 2018 to 2033

Figure 42: North America Market Volume (Units) Analysis by Storage Type, 2018 to 2033

Figure 43: North America Market Value Share (%) and BPS Analysis by Storage Type, 2023 to 2033

Figure 44: North America Market Y-o-Y Growth (%) Projections by Storage Type, 2023 to 2033

Figure 45: North America Market Attractiveness by Application, 2023 to 2033

Figure 46: North America Market Attractiveness by Propulsion, 2023 to 2033

Figure 47: North America Market Attractiveness by Storage Type, 2023 to 2033

Figure 48: North America Market Attractiveness by Country, 2023 to 2033

Figure 49: Latin America Market Value (US$ Million) by Application, 2023 to 2033

Figure 50: Latin America Market Value (US$ Million) by Propulsion, 2023 to 2033

Figure 51: Latin America Market Value (US$ Million) by Storage Type, 2023 to 2033

Figure 52: Latin America Market Value (US$ Million) by Country, 2023 to 2033

Figure 53: Latin America Market Value (US$ Million) Analysis by Country, 2018 to 2033

Figure 54: Latin America Market Volume (Units) Analysis by Country, 2018 to 2033

Figure 55: Latin America Market Value Share (%) and BPS Analysis by Country, 2023 to 2033

Figure 56: Latin America Market Y-o-Y Growth (%) Projections by Country, 2023 to 2033

Figure 57: Latin America Market Value (US$ Million) Analysis by Application, 2018 to 2033

Figure 58: Latin America Market Volume (Units) Analysis by Application, 2018 to 2033

Figure 59: Latin America Market Value Share (%) and BPS Analysis by Application, 2023 to 2033

Figure 60: Latin America Market Y-o-Y Growth (%) Projections by Application, 2023 to 2033

Figure 61: Latin America Market Value (US$ Million) Analysis by Propulsion, 2018 to 2033

Figure 62: Latin America Market Volume (Units) Analysis by Propulsion, 2018 to 2033

Figure 63: Latin America Market Value Share (%) and BPS Analysis by Propulsion, 2023 to 2033

Figure 64: Latin America Market Y-o-Y Growth (%) Projections by Propulsion, 2023 to 2033

Figure 65: Latin America Market Value (US$ Million) Analysis by Storage Type, 2018 to 2033

Figure 66: Latin America Market Volume (Units) Analysis by Storage Type, 2018 to 2033

Figure 67: Latin America Market Value Share (%) and BPS Analysis by Storage Type, 2023 to 2033

Figure 68: Latin America Market Y-o-Y Growth (%) Projections by Storage Type, 2023 to 2033

Figure 69: Latin America Market Attractiveness by Application, 2023 to 2033

Figure 70: Latin America Market Attractiveness by Propulsion, 2023 to 2033

Figure 71: Latin America Market Attractiveness by Storage Type, 2023 to 2033

Figure 72: Latin America Market Attractiveness by Country, 2023 to 2033

Figure 73: Europe Market Value (US$ Million) by Application, 2023 to 2033

Figure 74: Europe Market Value (US$ Million) by Propulsion, 2023 to 2033

Figure 75: Europe Market Value (US$ Million) by Storage Type, 2023 to 2033

Figure 76: Europe Market Value (US$ Million) by Country, 2023 to 2033

Figure 77: Europe Market Value (US$ Million) Analysis by Country, 2018 to 2033

Figure 78: Europe Market Volume (Units) Analysis by Country, 2018 to 2033

Figure 79: Europe Market Value Share (%) and BPS Analysis by Country, 2023 to 2033

Figure 80: Europe Market Y-o-Y Growth (%) Projections by Country, 2023 to 2033

Figure 81: Europe Market Value (US$ Million) Analysis by Application, 2018 to 2033

Figure 82: Europe Market Volume (Units) Analysis by Application, 2018 to 2033

Figure 83: Europe Market Value Share (%) and BPS Analysis by Application, 2023 to 2033

Figure 84: Europe Market Y-o-Y Growth (%) Projections by Application, 2023 to 2033

Figure 85: Europe Market Value (US$ Million) Analysis by Propulsion, 2018 to 2033

Figure 86: Europe Market Volume (Units) Analysis by Propulsion, 2018 to 2033

Figure 87: Europe Market Value Share (%) and BPS Analysis by Propulsion, 2023 to 2033

Figure 88: Europe Market Y-o-Y Growth (%) Projections by Propulsion, 2023 to 2033

Figure 89: Europe Market Value (US$ Million) Analysis by Storage Type, 2018 to 2033

Figure 90: Europe Market Volume (Units) Analysis by Storage Type, 2018 to 2033

Figure 91: Europe Market Value Share (%) and BPS Analysis by Storage Type, 2023 to 2033

Figure 92: Europe Market Y-o-Y Growth (%) Projections by Storage Type, 2023 to 2033

Figure 93: Europe Market Attractiveness by Application, 2023 to 2033

Figure 94: Europe Market Attractiveness by Propulsion, 2023 to 2033

Figure 95: Europe Market Attractiveness by Storage Type, 2023 to 2033

Figure 96: Europe Market Attractiveness by Country, 2023 to 2033

Figure 97: Asia Pacific Market Value (US$ Million) by Application, 2023 to 2033

Figure 98: Asia Pacific Market Value (US$ Million) by Propulsion, 2023 to 2033

Figure 99: Asia Pacific Market Value (US$ Million) by Storage Type, 2023 to 2033

Figure 100: Asia Pacific Market Value (US$ Million) by Country, 2023 to 2033

Figure 101: Asia Pacific Market Value (US$ Million) Analysis by Country, 2018 to 2033

Figure 102: Asia Pacific Market Volume (Units) Analysis by Country, 2018 to 2033

Figure 103: Asia Pacific Market Value Share (%) and BPS Analysis by Country, 2023 to 2033

Figure 104: Asia Pacific Market Y-o-Y Growth (%) Projections by Country, 2023 to 2033

Figure 105: Asia Pacific Market Value (US$ Million) Analysis by Application, 2018 to 2033

Figure 106: Asia Pacific Market Volume (Units) Analysis by Application, 2018 to 2033

Figure 107: Asia Pacific Market Value Share (%) and BPS Analysis by Application, 2023 to 2033

Figure 108: Asia Pacific Market Y-o-Y Growth (%) Projections by Application, 2023 to 2033

Figure 109: Asia Pacific Market Value (US$ Million) Analysis by Propulsion, 2018 to 2033

Figure 110: Asia Pacific Market Volume (Units) Analysis by Propulsion, 2018 to 2033

Figure 111: Asia Pacific Market Value Share (%) and BPS Analysis by Propulsion, 2023 to 2033

Figure 112: Asia Pacific Market Y-o-Y Growth (%) Projections by Propulsion, 2023 to 2033

Figure 113: Asia Pacific Market Value (US$ Million) Analysis by Storage Type, 2018 to 2033

Figure 114: Asia Pacific Market Volume (Units) Analysis by Storage Type, 2018 to 2033

Figure 115: Asia Pacific Market Value Share (%) and BPS Analysis by Storage Type, 2023 to 2033

Figure 116: Asia Pacific Market Y-o-Y Growth (%) Projections by Storage Type, 2023 to 2033

Figure 117: Asia Pacific Market Attractiveness by Application, 2023 to 2033

Figure 118: Asia Pacific Market Attractiveness by Propulsion, 2023 to 2033

Figure 119: Asia Pacific Market Attractiveness by Storage Type, 2023 to 2033

Figure 120: Asia Pacific Market Attractiveness by Country, 2023 to 2033

Figure 121: MEA Market Value (US$ Million) by Application, 2023 to 2033

Figure 122: MEA Market Value (US$ Million) by Propulsion, 2023 to 2033

Figure 123: MEA Market Value (US$ Million) by Storage Type, 2023 to 2033

Figure 124: MEA Market Value (US$ Million) by Country, 2023 to 2033

Figure 125: MEA Market Value (US$ Million) Analysis by Country, 2018 to 2033

Figure 126: MEA Market Volume (Units) Analysis by Country, 2018 to 2033

Figure 127: MEA Market Value Share (%) and BPS Analysis by Country, 2023 to 2033

Figure 128: MEA Market Y-o-Y Growth (%) Projections by Country, 2023 to 2033

Figure 129: MEA Market Value (US$ Million) Analysis by Application, 2018 to 2033

Figure 130: MEA Market Volume (Units) Analysis by Application, 2018 to 2033

Figure 131: MEA Market Value Share (%) and BPS Analysis by Application, 2023 to 2033

Figure 132: MEA Market Y-o-Y Growth (%) Projections by Application, 2023 to 2033

Figure 133: MEA Market Value (US$ Million) Analysis by Propulsion, 2018 to 2033

Figure 134: MEA Market Volume (Units) Analysis by Propulsion, 2018 to 2033

Figure 135: MEA Market Value Share (%) and BPS Analysis by Propulsion, 2023 to 2033

Figure 136: MEA Market Y-o-Y Growth (%) Projections by Propulsion, 2023 to 2033

Figure 137: MEA Market Value (US$ Million) Analysis by Storage Type, 2018 to 2033

Figure 138: MEA Market Volume (Units) Analysis by Storage Type, 2018 to 2033

Figure 139: MEA Market Value Share (%) and BPS Analysis by Storage Type, 2023 to 2033

Figure 140: MEA Market Y-o-Y Growth (%) Projections by Storage Type, 2023 to 2033

Figure 141: MEA Market Attractiveness by Application, 2023 to 2033

Figure 142: MEA Market Attractiveness by Propulsion, 2023 to 2033

Figure 143: MEA Market Attractiveness by Storage Type, 2023 to 2033

Figure 144: MEA Market Attractiveness by Country, 2023 to 2033

Recommendations

Automotive

Off-Highway Vehicle (OHV) Telematics Market

Published : June 2023

Automotive

Electric Garbage Van Market

Published : January 2023

Explore Automotive Insights

View Reports

Off-highway Electric Vehicle Market