

- Market Size (2026)
- USD 1.5 Bn
- Forecast (2036)
- USD 4.2 Bn
- CAGR (2026 to 2036)
- 10.7%
How big is Oncology Clinical Development Market in 2026?
USD 1.5 billion in 2026 and USD 4.2 billion by 2036 at a 10.7% CAGR.
Oncology clinical development services are projected to expand at 10.7% CAGR from 2026 to 2036. The forecast raises industry value from USD 1.5 billion to USD 4.2 billion during the period. In September 2025 the World Health Organization reported 112,899 cancer clinical trials from 1999 through 2023 with breast cancer representing 12%. Related clinical trials market analysis shows why oncology programs require deeper therapeutic oversight than general study operations. The healthcare CRO market reflects demand for external teams that combine scientific expertise with execution capacity.
Commercial demand depends on development programs converting scientific promise into recruitable protocols and submission-ready evidence across several countries. The FDA reported in October 2025 that its Oncology Center of Excellence facilitated 89 oncology drug and biologic approvals during 2024. The regulatory throughput expands demand for personalized medicine market expertise across biomarker-defined populations and complex treatment pathways. The cancer diagnostics market provides a useful comparison for eligibility testing and endpoint confirmation across treatment studies. Service providers gain commercial advantage through predictable activation and transparent data control with timely issue resolution.
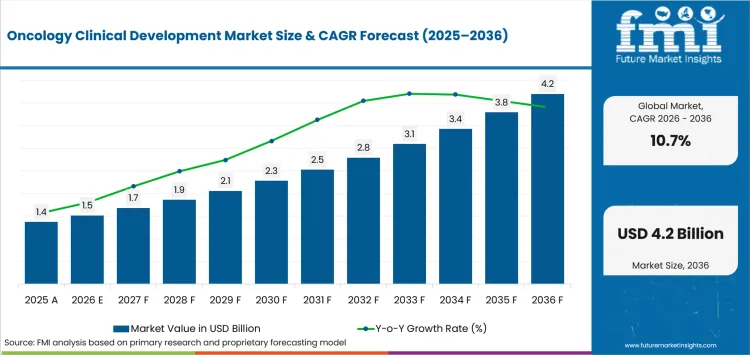
Key Takeaways of Oncology Clinical Development Market
- Demand for oncology clinical development services is driven by pipeline complexity and the operational burden of biomarker-defined studies, with sponsors rewarding providers that maintain enrollment progress without weakening protocol discipline or data traceability.
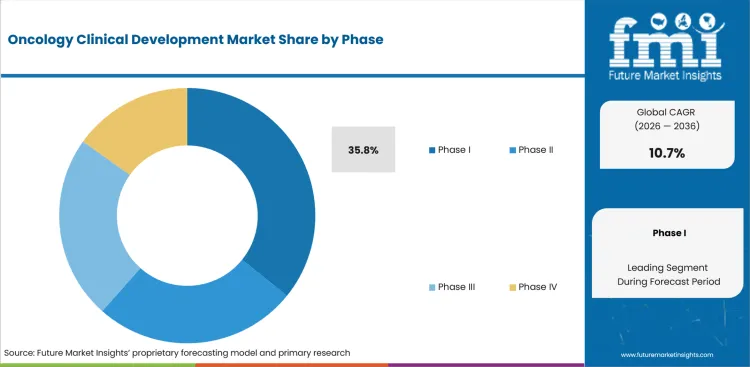
- Phase I holds the leading share at 35.8% in 2026, attributable to concentrated demand for dose optimization and early biological evidence where specialized providers coordinate medical monitoring with safety review and formal escalation committees.
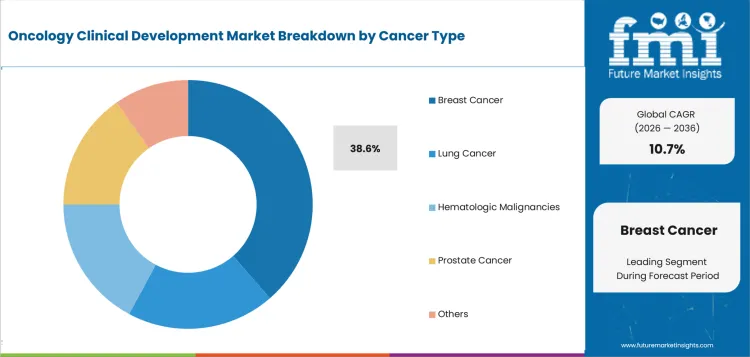
- Breast cancer leads the cancer type category at 38.6% share in 2026, supported by large eligible populations and diverse therapeutic pipelines requiring molecular stratification across several disease subtypes and treatment lines.
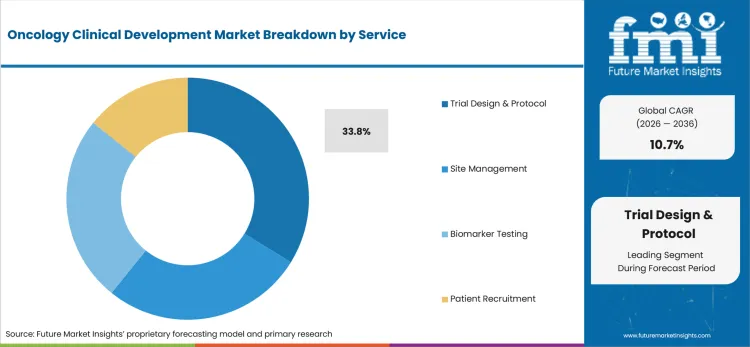
- Trial design and protocol services account for 33.8% service share in 2026, driven by downstream operational influence on site activation, biomarker testing, and enrollment planning across complex multicenter programs.
- Big Pharma holds 50.6% sponsor type share in 2026, reflecting extensive pipelines and multinational submission plans requiring broad clinical delivery with dedicated oncology expertise.
- Germany, Japan, and South Korea record CAGRs of 13.2%, 11.9%, and 10.4% respectively through 2036, with IQVIA and Syneos Health providing broad clinical delivery, and Medpace and Thermo Fisher Scientific adding medical oversight and laboratory depth across biomarker-driven programs.
Analyst Perspective
"Commercial adoption will depend on converting promising biomarkers into clinically validated tests that influence oncology treatment decisions. Developers are prioritizing robust clinical evidence, standardized laboratory practices, and regulatory alignment to support broader clinical use. Companies that strengthen assay validation, multicenter consistency, and long-term technical support will be better positioned to expand precision oncology applications."
- Anurag Sharma, Principal Analyst at Future Market Insights
Source: FMI's proprietary forecasting model and primary research
How is the Oncology Clinical Development Market segmented?
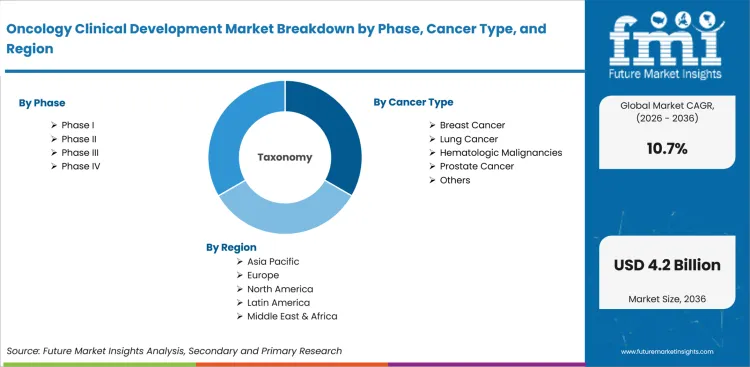
The oncology clinical development industry is segmented by phase, cancer type, service, sponsor type, and region.
The segmentation framework separates trial maturity from disease focus and the outsourced activities required across development programs. Phase analysis follows dose finding through post-approval studies without mixing their different operational evidence requirements. Cancer type analysis distinguishes breast and lung tumors from hematologic malignancies with prostate cancer and other indications. Service analysis separates protocol design from site management and biomarker testing with patient recruitment across operational budgets. Sponsor type analysis compares large pharmaceutical companies with biotechnology developers and academic institutions using different outsourcing structures. Regional analysis reflects regulatory pathways and site capacity with laboratory access and patient availability across national development systems.
What supports demand for Phase I within the Phase category?
Phase I oncology programs combine dose escalation with intensive safety review and frequent cohort decisions across specialist sites. The FDA issued accelerated-approval draft guidance in January 2025 that emphasized confirmatory trial timing during development planning. Sponsors therefore need flexible protocols that preserve early adaptability without weakening later evidence requirements or confirmatory planning. The eClinical solutions market provides a broader comparison for synchronized cohort data and rapid governance across dispersed teams.
- Phase I is projected to hold 35.8% share in 2026, attributable to concentrated demand for dose optimization and early biological evidence. Specialized providers coordinate medical monitoring and pharmacokinetics with safety review functions and formal escalation committees.
- Biotechnology companies use Phase I specialists to secure experienced investigators and manage complex eligibility criteria across small patient populations. Adoption improves through predictable site activation and integrated laboratory logistics that support rapid cohort decisions. Programs face delays through biomarker turnaround or dose decisions that fail to match protocol schedules.
How does Breast Cancer shape demand within the Cancer Type category?
Breast cancer studies require broad site access while preserving molecular stratification across several disease subtypes and treatment lines. The National Cancer Institute estimated in April 2025 that 316,950 women would receive breast cancer diagnoses during 2025 and 42,170 would die. The documented disease burden sustains intense trial competition across adjuvant and metastatic treatment settings worldwide. The molecular biomarkers market clarifies why assay consistency and specimen logistics directly shape enrollment performance across research sites.
- Breast cancer is forecast to represent 38.6% share of the cancer type category in 2026, supported by large eligible populations and diverse therapeutic pipelines. Study teams must manage receptor status and genomic markers with prior therapies and stage-specific endpoints. The combined requirements create recurring demand for specialized operational planning across diverse breast cancer programs.
- Community oncology networks can expand breast cancer recruitment beyond major academic centers through standardized screening and specimen pathways. Adoption depends on rapid biomarker confirmation and practical visit schedules for participants receiving routine care. Sponsors lose valuable enrollment time through duplicate testing or delayed pathology transfer between participating research sites.
How is trial design & protocol positioned within the service category?
Protocol design converts an oncology hypothesis into eligibility rules and endpoints with assessment schedules that sites can execute consistently. FDA draft guidance published in August 2025 addressed overall-survival assessment within randomized oncology clinical trials supporting approval. The guidance reinforces early planning for extended follow-up and treatment crossover across randomized development programs. The trial support software market shows why design assumptions must remain visible throughout study execution.
- Trial Design & Protocol is estimated to account for 33.8% share in 2026, owing to its influence over downstream recruitment and data quality. Strong protocols align statistical objectives with site capabilities and laboratory timelines across complex multinational studies. Design errors multiply operating costs through amendments and repeated training across every participating research center.
- Large sponsors invest in specialist design teams for adaptive cohorts and biomarker-defined populations requiring coordinated medical and statistical decisions. Biotechnology developers often select external design partners to supplement limited internal clinical and statistical infrastructure. Adoption strengthens through feasibility work that challenges unrealistic eligibility criteria and demanding participant visit schedules.
What makes big pharma central to the sponsor type category?
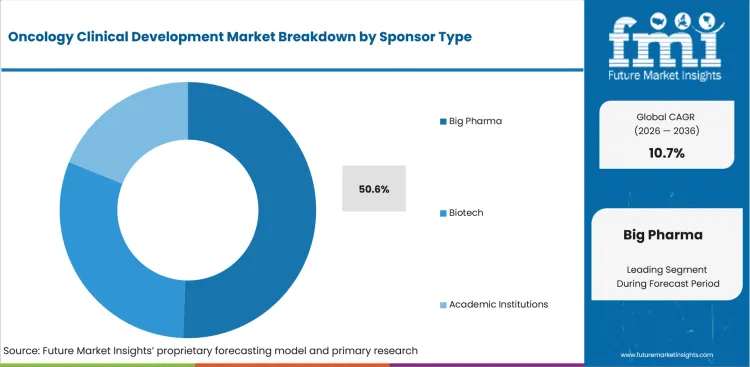
Large pharmaceutical sponsors manage several oncology programs across regions and require consistent governance across internal teams plus external research partners. The FDA finalized E6(R3) Good Clinical Practice guidance in September 2025 with flexible risk-based approaches and quality-by-design principles. The updated framework increases demand for traceable delegation and proportionate oversight across multinational sponsor programs. The companion diagnostics market illustrates added coordination across drug development and assay validation programs worldwide.
- Big Pharma is anticipated to hold 50.6% share of the sponsor type category in 2026, influenced by extensive pipelines and global submission plans. Large pharmaceutical organizations purchase full-service delivery and functional outsourcing across several parallel oncology development studies. Their operating scale supports multi-year provider relationships with common systems and consistent governance across portfolios.
- Global pharmaceutical companies adopt consolidated development models to standardize site oversight and data handling across therapeutic portfolios. Service providers must support regional regulations without fragmenting reporting structures or operational accountability across countries. Commercial retention depends on consistent delivery across early and late development programs within several therapeutic portfolios.
What are the drivers, restraints, and opportunities in the Oncology Clinical Development Market?
Expanding oncology pipelines support specialized development services, but recruitment pressure and fragmented evidence pathways can delay operational progress.
- Driver: Scientific advances create more biomarker-defined oncology programs that require specialized design and integrated laboratory support.
- Restraint: Narrow eligibility criteria and competing studies limit recruitment speed across specialist centers serving overlapping patient populations.
- Opportunity: Integrated protocol and biomarker services can reduce handoff delays while strengthening evidence continuity across complex programs.
Growing protocol complexity supports demand for oncology development partners that combine therapeutic expertise with modern statistical methods. In January 2026 the FDA issued draft guidance encouraging Bayesian methodologies for drug and biologic clinical trials. The guidance creates practical demand for biostatistical planning and transparent prior-data governance across adaptive oncology studies. CRO selection increasingly depends on teams that can explain complex designs to investigators and regulators.
Recruitment remains a material constraint across biomarker-defined populations distributed among many centers with competing studies. FDA final guidance from December 2025 recommended broader eligibility and enrollment practices for representative trial populations. Sponsors must balance population generalizability with participant safety and mechanistic precision across complex oncology protocols. Site contracts and laboratory turnaround create further enrollment delays even after eligible patients are identified by investigators.
Integrated evidence pathways create an opening for providers that connect biomarker results with eligibility decisions and longitudinal endpoints. The FDA issued tissue-biopsy guidance in January 2025 to address participant safety and scientific justification within clinical trials. The liquid biopsy market supports less invasive monitoring strategies across selected oncology protocols and treatment settings. The cancer biopsy market also frames the operational burden created by tissue collection and pathology review.
Which country CAGRs are profiled in the Oncology Clinical Development Market?
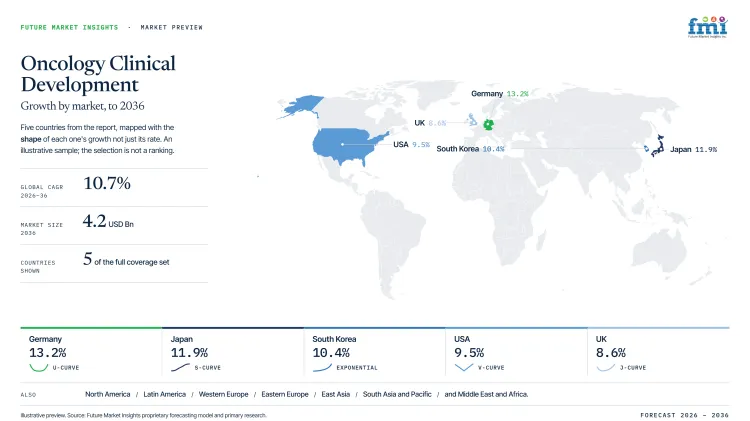
| Country | CAGR |
|---|---|
| USA | 9.5% |
| UK | 8.6% |
| Germany | 13.2% |
| Japan | 11.9% |
| South Korea | 10.4% |
How do country-level CAGRs compare in the Oncology Clinical Development Market?
The country comparison shows a 4.6 percentage point spread between the countries profiled in the oncology clinical development market. Germany and Japan form a closely aligned upper group with only a modest gap between their forecasts. South Korea follows as a nearby middle market and remains relatively close to Japan. The USA and UK create a lower cluster with a limited difference separating their projected growth rates. These variations reflect differences in clinical trial activity, oncology research investment and the adoption of advanced study designs rather than differences in healthcare system maturity alone.
- Germany holds a notable position within the comparison as strong pharmaceutical research capabilities and extensive clinical trial networks support oncology development programs.
- Japan remains close to Germany in CAGR terms but follows a different development path through a combination of domestic innovation and increasing participation in global oncology studies.
- South Korea occupies a middle position as investments in precision medicine and expanding clinical research infrastructure support oncology pipeline development.
- The USA remains relatively close to the UK yet benefits from a broad ecosystem of biotechnology companies, academic research centers and oncology-focused clinical trials.
- The UK shows a measured position within the comparison as oncology development activity is supported by established research institutions and collaborative clinical trial frameworks.
Comparable CAGRs do not create identical market conditions across countries. Differences in patient recruitment timelines, regulatory review processes, trial site availability and biomarker testing capabilities can influence how oncology development programs progress. As a result, companies may face different operational and commercialization requirements even when forecast growth rates appear relatively close. The full report provides country-level CAGR analysis across North America, Latin America, Europe, East Asia, South Asia, Oceania and the Middle East and Africa.
Country-wise Analysis
- United States oncology development benefits from dense academic networks and community research sites across major treatment regions. The USA is projected to record 9.5% CAGR from 2026 to 2036, supported by broad sponsor activity and specialist infrastructure. The National Cancer Institute reported in February 2026 that its National Clinical Trials Network coordinates cancer studies at more than 2,200 sites. Large CROs and central laboratories provide nationwide coverage with established maintenance and investigator training routes. Fragmented contracting and competition for biomarker-defined patients remain material frictions across major oncology research centers. Sponsors should separate national feasibility estimates from site-level enrollment evidence during provider selection and contracting.
- United Kingdom sponsors operate through a centralized regulatory system and a mature network of NHS plus academic research sites. The UK is forecast to expand at 8.6% CAGR through 2036, influenced by streamlined submissions and specialist oncology capacity. The MHRA announced in April 2026 that amended clinical trial regulations introduced faster routes for lower-risk studies and earlier-stage research. Public research infrastructure supports investigator access and coordinated training across established academic and community research networks. NHS capacity pressure and site contracting timelines can delay activation across several competing oncology studies. Sponsors should confirm local pharmacy and diagnostic support during feasibility reviews for biomarker-defined oncology protocols.
- German oncology trials combine university hospitals with specialist cancer centers and strong laboratory infrastructure across several federal states. Germany is anticipated to advance at 13.2% CAGR during the forecast period, underpinned by regulated adoption and multinational sponsor demand. BfArM stated in June 2025 that radiation-protection notifications for applicable trials should enter CTIS with clinical trial submissions from July 2025. The single-gate route can reduce procedural duplication for radiopharmaceutical programs requiring radiation-protection review within German sites. Federal site contracts and regional ethics coordination remain practical frictions across complex multicenter oncology research programs. Sponsors should verify local radiation expertise and document ownership prior to activating specialized oncology research sites.
- Japanese oncology development relies on major cancer centers and disciplined site operations across a concentrated specialist network. Japan is estimated to record 11.9% CAGR from 2026 to 2036, supported by advanced diagnostics and experienced investigators. PMDA issued June 2026 considerations for explaining driver mutations during anti-cancer drug development and regulatory review. The guidance supports biomarker-led planning and early regulatory dialogue for targeted oncology therapies entering development. Limited eligible populations and translated document requirements can extend startup timelines across rare molecular oncology cohorts. Sponsors should select partners with local regulatory teams and dependable central laboratory routes across Japan.
- South Korean oncology research benefits from large tertiary hospitals and connected digital systems across dense urban treatment networks. The country is predicted to post 10.4% CAGR through 2036, aided by rapid evaluation and active clinical research infrastructure. The Ministry of Food and Drug Safety reported in March 2026 that 783 clinical trials received approval during 2025 with the total rising 4.8% year over year. Concentration within major hospitals supports specialist training but intensifies competition for eligible oncology trial participants. Sponsors should test enrollment assumptions against current site workloads and local diagnostic capacity across tertiary hospitals.
Who are the notable companies in the Oncology Clinical Development Market?
IQVIA, Syneos Health, Parexel, ICON plc, Medpace, Fortrea, Thermo Fisher Scientific (PPD), and Precision for Medicine are notable oncology clinical development companies.
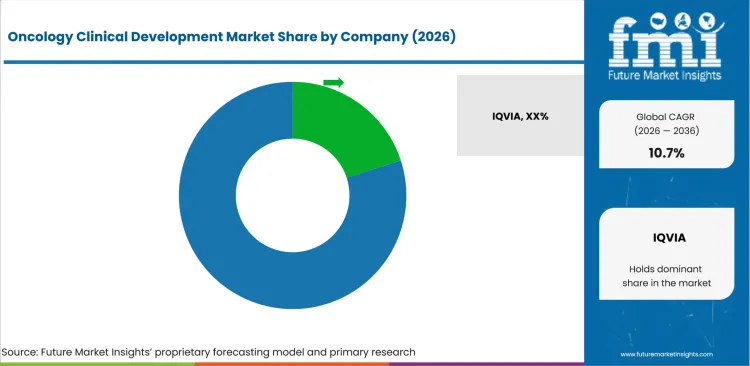
The competitive field includes global CROs and oncology specialists with different combinations of early-phase expertise and laboratory integration with site access. IQVIA and Syneos Health emphasize broad therapeutic delivery with dedicated early oncology networks across major regions. Parexel and ICON plc combine global operations with regulatory strategy and patient recruitment capabilities worldwide. Medpace and Fortrea integrate medical oversight with operational delivery across complex oncology studies in several regions. Thermo Fisher Scientific adds PPD clinical services plus an international laboratory network supporting complex oncology studies. Precision for Medicine differentiates through biomarker-led development and specialty laboratories supporting complex oncology trial protocols. Competitive selection should match the protocol phase and diagnostic burden rather than corporate scale alone.
- IQVIA along with Syneos Health and Parexel provides global clinical development through dedicated oncology teams and broad investigator networks across major regions.
- ICON plc, Medpace and Fortrea focus in combining therapeutic oversight with operational delivery across early and late oncology programs.
- Thermo Fisher Scientific and Precision for Medicine integrate clinical execution with laboratory and biomarker services for precision oncology studies.
Competitive Benchmarking: Oncology Clinical Development Market
| Company | Early Phase Oncology | Biomarker and Laboratory Integration | Global Trial Delivery | Geographic Reach |
|---|---|---|---|---|
| IQVIA | High | High | High | Global |
| Syneos Health | High | Medium | High | Global |
| Parexel | High | Medium | High | Global |
| ICON plc | High | High | High | Global |
| Medpace | High | High | High | Global |
| Fortrea | High | High | High | Global |
| Thermo Fisher Scientific (PPD) | High | High | High | Global |
| Precision for Medicine | High | High | Medium | North America and Europe |
Key Developments in the Oncology Clinical Development Market
- In May 2025, IQVIA announced a strategic collaboration with SCRI Development Innovations to accelerate global oncology trial delivery. The model combines IQVIA trial operations with SCRI community oncology access and electronic health record integration. Sponsors can use the combined structure to reduce activation handoffs and improve recruitment coordination across United States sites.
- In January 2026, ICON plc: Accellacare expanded its oncology research capabilities through the Brian Moran Cancer Institute partnership in Illinois. The institute adds medical and surgical oncology specialists to a network designed for community-based trial access. The expansion gives sponsors another route for recruiting oncology participants outside major academic research centers.
- In May 2026, Parexel launched ParexelAI as a human-led suite supporting clinical development from early phase through post-market surveillance. The platform combines internal tools with strategic collaborations and transparent human oversight across clinical development stages. Oncology sponsors can apply the capabilities across protocol planning and operational execution without separating technology from clinical governance.
- In May 2026, Thermo Fisher Scientific: The PPD clinical research business opened a bioanalytical and biomarker laboratory in Gothenburg. The GLP facility supports molecular genomics and flow cytometry with proteomics across several drug development stages. The expansion strengthens European specimen processing routes for complex oncology modalities that require integrated biomarker evidence.
Key Players in the Oncology Clinical Development Market
Global Clinical Development Providers
- IQVIA
- Syneos Health
- Parexel
Integrated Oncology Delivery Providers
- ICON plc
- Medpace
- Fortrea
Laboratory and Biomarker-Integrated Providers
- Thermo Fisher Scientific (PPD)
- Precision for Medicine
Oncology Clinical Development Market - Report Scope
| Coverage field | Report scope |
|---|---|
| Market breakdown | By Phase, Cancer Type, Service, Sponsor Type, and region. |
| Quantitative Units | Revenue in USD Billion, CAGR in %. |
| Market Definition | The oncology clinical development market covers contracted scientific and operational services used to design and execute oncology trials. |
| Regions Covered | North America, Latin America, Western Europe, Eastern Europe, East Asia, South Asia and Pacific, and Middle East and Africa. |
| Countries Covered | USA, UK, Germany, Japan, South Korea, and additional countries included in the full report. |
| Key Companies Profiled | IQVIA, Syneos Health, Parexel, ICON plc, Medpace, Fortrea, Thermo Fisher Scientific (PPD), and Precision for Medicine. |
| Forecast Period | 2026 to 2036. |
| Approach | Data triangulation combining baseline market validation, segment reconciliation, country-specific conditions, company participation analysis, and adoption trend assessment. |
Oncology Clinical Development Market - Research Methodology
| Method | Approach |
|---|---|
| Primary Research | FMI analysts gathered input from manufacturers, service providers, technology developers, distributors, end users, procurement teams, and subject-matter experts. Interviews examined purchasing decisions, product or service evaluation, adoption barriers, approval requirements, pricing considerations, and expectations for technical or commercial support. Respondents were also asked what evidence is required before a trial, pilot, or initial order develops into regular purchasing. |
| Desk Research | Desk research covered government statistics, regulatory publications, trade data, industry associations, technical literature, standards, company filings, product information, and official corporate announcements. Sources were reviewed for relevance, publication date, geographic coverage, and consistency with the defined market scope. Claims relating to performance, applications, approvals, capacity, investment, and commercial activity were retained only when supported by credible public evidence. |
| Market Sizing and Forecasting | The market model combined the baseline value with historical performance, segment structure, pricing and volume indicators, adoption levels, company participation, and country-level demand conditions. Forecast assumptions considered economic activity, investment trends, regulatory developments, technology adoption, purchasing cycles, supply availability, and barriers to wider market use. Segment and regional estimates were reconciled before the final market total was calculated. |
| Data Validation | Estimates were checked against multiple independent indicators, including public data, company activity, trade patterns, industry developments, and findings from primary interviews. Validation also tested whether products, services, applications, and company revenues fell within the defined market boundaries. Adjacent categories, unsupported claims, overlapping revenues, and activities without direct market relevance were excluded to reduce double counting and maintain consistency across segments and countries. |
Oncology Clinical Development Market by Segments
Oncology Clinical Development Market segmented by Phase:
- Phase I (35.8% share in 2026)
- Phase II
- Phase III
- Phase IV
Oncology Clinical Development Market segmented by Cancer Type:
- Breast Cancer
- Lung Cancer
- Hematologic Malignancies
- Prostate Cancer
- Others
Oncology Clinical Development Market segmented by Service:
- Trial Design & Protocol
- Site Management
- Biomarker Testing
- Patient Recruitment
Oncology Clinical Development Market segmented by Sponsor Type:
- Big Pharma
- Biotech
- Academic Institutions
Oncology Clinical Development Market by Region:
- North America
- United States
- Canada
- Latin America
- Brazil
- Mexico
- Argentina
- Chile
- Western Europe
- Germany
- France
- United Kingdom
- Italy
- Spain
- Benelux
- Nordics
- Eastern Europe
- Poland
- Czech Republic
- Romania
- Hungary
- East Asia
- China
- Japan
- South Korea
- South Asia and Pacific
- India
- ASEAN
- Australia and New Zealand
- Middle East and Africa
- GCC Countries
- South Africa
- Türkiye
- Israel
Research Sources and Bibliography
- World Health Organization. (2025, September). WHO landscape of clinical trials on cancer.
- USA Food and Drug Administration. (2025, October 17). 2024 OCE annual report.
- USA Food and Drug Administration. (2025, January). Accelerated approval and considerations for determining whether a confirmatory trial is underway.
- PDQ Adult Treatment Editorial Board. (2025, April 25). Breast cancer treatment (PDQ): Health professional version. National Cancer Institute.
- USA Food and Drug Administration. (2025, August). Approaches to assessment of overall survival in oncology clinical trials.
- USA Food and Drug Administration. (2025, September). E6(R3) good clinical practice (GCP).
- USA Food and Drug Administration. (2026, January 12). FDA issues guidance on modernizing statistical methods for clinical trials.
- USA Food and Drug Administration. (2025, December). Enhancing participation in clinical trials: Eligibility criteria, enrollment practices, and trial designs.
- USA Food and Drug Administration. (2025, January). Considerations for including tissue biopsies in clinical trials.
- National Cancer Institute. (2026, February 27). NCTN: NCI’s National Clinical Trials Network.
- Medicines and Healthcare products Regulatory Agency, Health Research Authority, & Ahmed, Z. (2026, April 27). Launch of clinical trial reforms.
- Federal Institute for Drugs and Medical Devices. (2025, June). Notification procedure pursuant to Section 32 of the German Radiation Protection Act of 1 July 2025.
- Pharmaceuticals and Medical Devices Agency. (2026, June 17). Information regarding explanations to driver mutations in the development of anti-cancer drugs.
- Ministry of Food and Drug Safety. (2026, March 6). 783 clinical trial approvals in 2025, up 4.8% year over year [Press release].
- IQVIA. (n.d.). Oncology and hematology.
- Syneos Health. (n.d.). Oncology and hematology clinical research partners.
- Parexel. (n.d.). Oncology CRO services.
- ICON plc. (n.d.). Oncology clinical trials.
- Medpace. (n.d.). Navigating regulatory and operational challenges in Asia Pacific.
- Fortrea. (n.d.). Oncology CRO services.
- Thermo Fisher Scientific. (n.d.). Oncology and hematology clinical expertise.
- Precision for Medicine. (n.d.). Oncology CRO services.
- IQVIA. (2025, May 16). IQVIA and SCRI collaborate to accelerate global oncology trials.
- ICON plc. (2026, January 27). ICON’s Accellacare Site Network expands oncology research capabilities with new cancer institute partnership.
- Parexel. (2026, May 18). Parexel launches ParexelAI, delivering AI innovation to accelerate clinical development.
- Thermo Fisher Scientific. (2026, May 18). PPD clinical research business expands bioanalytical capabilities with new laboratory in Gothenburg, Sweden.
The bibliography contains official sources supporting retained statistics; regulatory conditions; company capabilities; and dated developments throughout the article.
This Report Answers
- How large is the oncology clinical development market in 2026 and 2036?
- What factor supports the 10.7% CAGR in the oncology clinical development market?
- Which phase holds the significant share in 2026?
- Which cancer type holds the dominant share in 2026?
- Which service holds the leading share in 2026?
- Which sponsor type holds the prominent share in 2026?
- How do country CAGRs compare through 2036?
- Which companies provide oncology clinical development capabilities?
- Which recent company developments affect oncology clinical development delivery?
Frequently Asked Questions
How big is the Oncology Clinical Development Market in 2026?
The oncology clinical development market is valued at USD 1.5 billion in 2026 and is forecast to reach USD 4.2 billion by 2036.
What is the CAGR of the Oncology Clinical Development Market from 2026 to 2036?
The oncology clinical development market is projected to grow at a CAGR of 10.7% between 2026 and 2036, supported by scientific advances creating more biomarker-defined oncology programs that require specialized design and integrated laboratory support.
Which sponsor type leads the Oncology Clinical Development Market?
Big Pharma accounts for 50.6% of the oncology clinical development market by sponsor type in 2026, driven by extensive pipelines and global submission plans requiring full-service delivery and functional outsourcing across several parallel oncology development studies.
Which segment is growing fastest in the Oncology Clinical Development Market?
Germany is the fastest-growing segment in the oncology clinical development market, expanding at a 13.2% CAGR through 2036, ahead of the market average of 10.7%, underpinned by strong pharmaceutical research capabilities, university hospital networks, and regulated adoption supporting multinational sponsor demand.
Who are the leading companies in the Oncology Clinical Development Market?
Leading companies in the oncology clinical development market include IQVIA, Syneos Health, Parexel, ICON plc, Medpace, Fortrea, Thermo Fisher Scientific (PPD), and Precision for Medicine, competing across global clinical development, integrated oncology delivery, and laboratory and biomarker-integrated service platforms.
Preview the report firsthand - request a free sample
Get SampleGet the brochure for pricing and purchase details.
Get PDFTable of Content
- Key Takeaways
- Market Size and CAGR
- Top Growth Driver
- Fastest Growing Segment
- Leading Region
- Key Companies
- Emerging Opportunities
- Executive Summary
- Global Market Outlook
- Demand-side Trends
- Supply-side Trends
- Technology Roadmap Analysis
- Analysis and Recommendations
- Analyst Perspective (What is happening? Why now? What should investors know?)
- Key Questions Answered
- How large is the market?
- What is the CAGR?
- What are key trends?
- Which region dominates?
- Who are the leaders?
- Market Overview
- Market Coverage / Taxonomy
- Market Definition / Scope / Limitations
- Research Methodology
- Chapter Orientation
- Analytical Lens and Working Hypotheses
- Market Structure, Signals, and Trend Drivers
- Benchmarking and Cross-market Comparability
- Market Sizing, Forecasting, and Opportunity Mapping
- Research Design and Evidence Framework
- Desk Research Programme (Secondary Evidence)
- Expert Input and Fieldwork (Primary Evidence)
- Tooling, Models, and Reference Databases
- Data Engineering and Model Build
- Quality Assurance and Audit Trail
- Market Background
- Market Dynamics (Drivers, Restraints, Opportunity, Trends)
- Scenario Forecast (Optimistic, Likely, Conservative)
- Impact Analysis
- AI Impact
- Sustainability Impact
- Regulatory Impact
- Technology Impact
- Consumer / Buyer Analysis
- Purchase Drivers
- Adoption Barriers
- Buyer Journey
- Opportunity Map Analysis
- Product Life Cycle Analysis
- Supply Chain Analysis
- Investment Feasibility Matrix
- Value Chain Analysis
- PESTLE and Porter's Analysis
- Regulatory Landscape
- Regional Parent Market Outlook
- Production and Consumption Statistics
- Import and Export Statistics
- Global Market Analysis and Forecast, 2021 to 2036
- Historical Market Size Value (USD Billion) Analysis, 2021 to 2025
- Current and Future Market Size Value (USD Billion) Projections, 2026 to 2036
- Y-o-Y Growth Trend Analysis
- Absolute $ Opportunity Analysis
- Global Market Pricing Analysis, 2021 to 2036
- Global Market Analysis and Forecast, By Phase, 2021 to 2036
- Introduction / Key Findings
- Historical Market Size Value (USD Billion) Analysis By Phase, 2021 to 2025
- Current and Future Market Size Value (USD Billion) Analysis and Forecast By Phase, 2026 to 2036
- Phase I
- Phase II
- Phase III
- Phase IV
- Phase I
- Y-o-Y Growth Trend Analysis By Phase, 2021 to 2025
- Absolute $ Opportunity Analysis By Phase, 2026 to 2036
- Global Market Analysis and Forecast, By Cancer Type, 2021 to 2036
- Introduction / Key Findings
- Historical Market Size Value (USD Billion) Analysis By Cancer Type, 2021 to 2025
- Current and Future Market Size Value (USD Billion) Analysis and Forecast By Cancer Type, 2026 to 2036
- Breast Cancer
- Lung Cancer
- Hematologic Malignancies
- Prostate Cancer
- Others
- Breast Cancer
- Y-o-Y Growth Trend Analysis By Cancer Type, 2021 to 2025
- Absolute $ Opportunity Analysis By Cancer Type, 2026 to 2036
- Global Market Analysis and Forecast, By Service, 2021 to 2036
- Introduction / Key Findings
- Historical Market Size Value (USD Billion) Analysis By Service, 2021 to 2025
- Current and Future Market Size Value (USD Billion) Analysis and Forecast By Service, 2026 to 2036
- Trial Design & Protocol
- Site Management
- Biomarker Testing
- Patient Recruitment
- Trial Design & Protocol
- Y-o-Y Growth Trend Analysis By Service, 2021 to 2025
- Absolute $ Opportunity Analysis By Service, 2026 to 2036
- Global Market Analysis and Forecast, By Sponsor Type, 2021 to 2036
- Introduction / Key Findings
- Historical Market Size Value (USD Billion) Analysis By Sponsor Type, 2021 to 2025
- Current and Future Market Size Value (USD Billion) Analysis and Forecast By Sponsor Type, 2026 to 2036
- Big Pharma
- Biotech
- Academic Institutions
- Big Pharma
- Y-o-Y Growth Trend Analysis By Sponsor Type, 2021 to 2025
- Absolute $ Opportunity Analysis By Sponsor Type, 2026 to 2036
- Global Market Analysis and Forecast, By Region, 2021 to 2036
- Introduction
- Historical Market Size Value (USD Billion) Analysis By Region, 2021 to 2025
- Current Market Size Value (USD Billion) Analysis and Forecast By Region, 2026 to 2036
- North America
- Latin America
- Western Europe
- Eastern Europe
- East Asia
- South Asia and Pacific
- Middle East & Africa
- Market Attractiveness Analysis By Region
- North America Market Analysis and Forecast, By Country, 2021 to 2036
- Historical Market Size Value (USD Billion) Trend Analysis By Market Taxonomy, 2021 to 2025
- Market Size Value (USD Billion) Forecast By Market Taxonomy, 2026 to 2036
- By Country
- USA
- Canada
- By Phase
- By Cancer Type
- By Service
- By Sponsor Type
- By Country
- Market Attractiveness Analysis
- By Country
- By Phase
- By Cancer Type
- By Service
- By Sponsor Type
- Key Takeaways
- Latin America Market Analysis and Forecast, By Country
- Historical Market Size Value (USD Billion) Trend Analysis By Market Taxonomy, 2021 to 2025
- Market Size Value (USD Billion) Forecast By Market Taxonomy, 2026 to 2036
- By Country
- Brazil
- Mexico
- Chile
- Rest of Latin America
- By Phase
- By Cancer Type
- By Service
- By Sponsor Type
- By Country
- Market Attractiveness Analysis
- By Country
- By Phase
- By Cancer Type
- By Service
- By Sponsor Type
- Key Takeaways
- Western Europe Market Analysis and Forecast, By Country
- Historical Market Size Value (USD Billion) Trend Analysis By Market Taxonomy, 2021 to 2025
- Market Size Value (USD Billion) Forecast By Market Taxonomy, 2026 to 2036
- By Country
- Germany
- UK
- Italy
- Spain
- France
- Nordic
- BENELUX
- Rest of Western Europe
- By Phase
- By Cancer Type
- By Service
- By Sponsor Type
- By Country
- Market Attractiveness Analysis
- By Country
- By Phase
- By Cancer Type
- By Service
- By Sponsor Type
- Key Takeaways
- Eastern Europe Market Analysis and Forecast, By Country
- Historical Market Size Value (USD Billion) Trend Analysis By Market Taxonomy, 2021 to 2025
- Market Size Value (USD Billion) Forecast By Market Taxonomy, 2026 to 2036
- By Country
- Russia
- Poland
- Hungary
- Balkan & Baltic
- Rest of Eastern Europe
- By Phase
- By Cancer Type
- By Service
- By Sponsor Type
- By Country
- Market Attractiveness Analysis
- By Country
- By Phase
- By Cancer Type
- By Service
- By Sponsor Type
- Key Takeaways
- East Asia Market Analysis and Forecast, By Country
- Historical Market Size Value (USD Billion) Trend Analysis By Market Taxonomy, 2021 to 2025
- Market Size Value (USD Billion) Forecast By Market Taxonomy, 2026 to 2036
- By Country
- China
- Japan
- South Korea
- By Phase
- By Cancer Type
- By Service
- By Sponsor Type
- By Country
- Market Attractiveness Analysis
- By Country
- By Phase
- By Cancer Type
- By Service
- By Sponsor Type
- Key Takeaways
- South Asia and Pacific Market Analysis and Forecast, By Country
- Historical Market Size Value (USD Billion) Trend Analysis By Market Taxonomy, 2021 to 2025
- Market Size Value (USD Billion) Forecast By Market Taxonomy, 2026 to 2036
- By Country
- India
- ASEAN
- Australia & New Zealand
- Rest of South Asia and Pacific
- By Phase
- By Cancer Type
- By Service
- By Sponsor Type
- By Country
- Market Attractiveness Analysis
- By Country
- By Phase
- By Cancer Type
- By Service
- By Sponsor Type
- Key Takeaways
- Middle East & Africa Market Analysis and Forecast, By Country
- Historical Market Size Value (USD Billion) Trend Analysis By Market Taxonomy, 2021 to 2025
- Market Size Value (USD Billion) Forecast By Market Taxonomy, 2026 to 2036
- By Country
- Kingdom of Saudi Arabia
- Other GCC Countries
- Türkiye
- South Africa
- Other African Union
- Rest of Middle East & Africa
- By Phase
- By Cancer Type
- By Service
- By Sponsor Type
- By Country
- Market Attractiveness Analysis
- By Country
- By Phase
- By Cancer Type
- By Service
- By Sponsor Type
- Key Takeaways
- Key Countries Market Analysis
- USA
- Pricing Analysis
- Market Share Analysis, 2025
- By Phase
- By Cancer Type
- By Service
- By Sponsor Type
- Canada
- Pricing Analysis
- Market Share Analysis, 2025
- By Phase
- By Cancer Type
- By Service
- By Sponsor Type
- Mexico
- Pricing Analysis
- Market Share Analysis, 2025
- By Phase
- By Cancer Type
- By Service
- By Sponsor Type
- Brazil
- Pricing Analysis
- Market Share Analysis, 2025
- By Phase
- By Cancer Type
- By Service
- By Sponsor Type
- Chile
- Pricing Analysis
- Market Share Analysis, 2025
- By Phase
- By Cancer Type
- By Service
- By Sponsor Type
- Germany
- Pricing Analysis
- Market Share Analysis, 2025
- By Phase
- By Cancer Type
- By Service
- By Sponsor Type
- UK
- Pricing Analysis
- Market Share Analysis, 2025
- By Phase
- By Cancer Type
- By Service
- By Sponsor Type
- Italy
- Pricing Analysis
- Market Share Analysis, 2025
- By Phase
- By Cancer Type
- By Service
- By Sponsor Type
- Spain
- Pricing Analysis
- Market Share Analysis, 2025
- By Phase
- By Cancer Type
- By Service
- By Sponsor Type
- France
- Pricing Analysis
- Market Share Analysis, 2025
- By Phase
- By Cancer Type
- By Service
- By Sponsor Type
- India
- Pricing Analysis
- Market Share Analysis, 2025
- By Phase
- By Cancer Type
- By Service
- By Sponsor Type
- ASEAN
- Pricing Analysis
- Market Share Analysis, 2025
- By Phase
- By Cancer Type
- By Service
- By Sponsor Type
- Australia & New Zealand
- Pricing Analysis
- Market Share Analysis, 2025
- By Phase
- By Cancer Type
- By Service
- By Sponsor Type
- China
- Pricing Analysis
- Market Share Analysis, 2025
- By Phase
- By Cancer Type
- By Service
- By Sponsor Type
- Japan
- Pricing Analysis
- Market Share Analysis, 2025
- By Phase
- By Cancer Type
- By Service
- By Sponsor Type
- South Korea
- Pricing Analysis
- Market Share Analysis, 2025
- By Phase
- By Cancer Type
- By Service
- By Sponsor Type
- Russia
- Pricing Analysis
- Market Share Analysis, 2025
- By Phase
- By Cancer Type
- By Service
- By Sponsor Type
- Poland
- Pricing Analysis
- Market Share Analysis, 2025
- By Phase
- By Cancer Type
- By Service
- By Sponsor Type
- Hungary
- Pricing Analysis
- Market Share Analysis, 2025
- By Phase
- By Cancer Type
- By Service
- By Sponsor Type
- Kingdom of Saudi Arabia
- Pricing Analysis
- Market Share Analysis, 2025
- By Phase
- By Cancer Type
- By Service
- By Sponsor Type
- Türkiye
- Pricing Analysis
- Market Share Analysis, 2025
- By Phase
- By Cancer Type
- By Service
- By Sponsor Type
- South Africa
- Pricing Analysis
- Market Share Analysis, 2025
- By Phase
- By Cancer Type
- By Service
- By Sponsor Type
- USA
- Market Structure Analysis
- Competition Dashboard
- Competition Benchmarking
- Market Share Analysis of Top Players
- By Regional
- By Phase
- By Cancer Type
- By Service
- By Sponsor Type
- Emerging Startups
- Innovation Benchmarking
- Competition Analysis
- Competition Deep Dive
- IQVIA
- Overview
- Product Portfolio
- Profitability by Market Segments
- Sales Footprint
- Strategy Overview
- Marketing Strategy
- Product Strategy
- Channel Strategy
- Syneos Health
- Parexel
- ICON
- Medpace
- Covance
- Novartis
- Pfizer
- Merck
- AstraZeneca
- IQVIA
- Case Studies
- Success Stories
- Recent Developments
- Competition Deep Dive
- Assumptions & Acronyms Used


