
- Market Size (2026)
- USD 116.6 Bn
- Forecast (2036)
- USD 316.4 Bn
- CAGR (2026 to 2036)
- 10.5%
How big is Online Gambling Market in 2026?
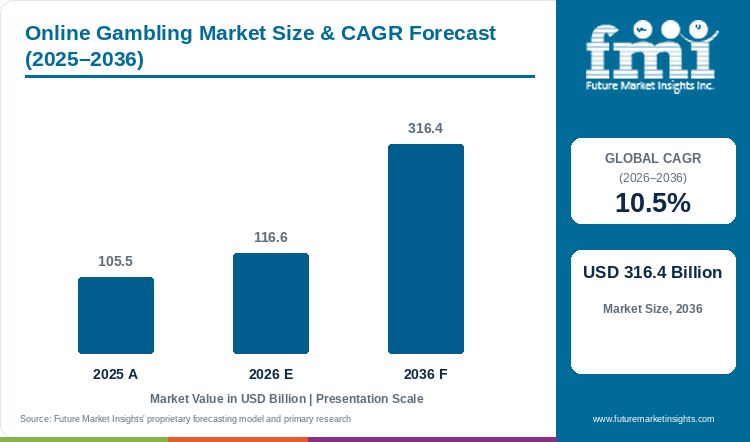
Demand for online gambling is projected to expand at 10.5% CAGR between 2026 and 2036. Industry value grows from USD 105.5 billion in 2025 to USD 116.6 billion in 2026 and is projected to reach USD 316.4 billion by 2036.
According to FMI, sports betting held the leading 48% share of game type demand in 2026, with the sports betting product still serving as the first licence in most newly regulated markets. Global online gambling sales totalled USD 105.5 billion in 2025, moving to USD 116.6 billion in 2026 and a projected USD 316.4 billion by 2036, a compound rate of 10.5% a year. Regulator and trade body figures show licensed online sales still rising in the US, Great Britain and France. US commercial iGaming sales reached a record USD 10.7 billion across seven states in 2025, up 27.6%, and sports betting sales climbed 22.6% to USD 16.9 billion out of total commercial gaming sales of USD 78.6 billion [1].
Operator results for 2026 show sales still rising but margins absorbing tax resets. Flutter's second-quarter 2026 sales reached USD 4,326 million, up 3%, as international sales grew 10% and US sales fell 6% on a 15% sportsbook decline that outweighed 14% iGaming growth, taking the full-year sales guidance midpoint down to USD 17.91 billion. Entain's underlying EBITDA fell 2% to GBP 479.3 million in the first half of 2026 on higher UK and international duties, even as group net gaming sales grew 7% to GBP 2.55 billion (5% at constant currency). At evoke, a GBP 46 million rise in UK gaming duties cut first-half adjusted EBITDA by 10%, and shareholders approved the GBP 243.1 million all-share offer from Bally’s Intralot in August 2026, with court sanction pending. FDJ United's online betting and gaming sales declined 7.4% to EUR 431 million in the first half of 2026, led by the Netherlands and the UK. FMI expects licence breadth, iGaming depth in regulated US states and the capacity to absorb duty increases to separate the leading operators from mid-sized groups over the forecast period.
Key Market Trends & Insights
- Sports betting held 48% of game type demand in 2026 on the strength of new sportsbook launches, though US results now swing with hold. FanDuel's US sportsbook gross gaming share eased to 39% in the second quarter of 2026 from 41% in the fourth quarter of 2025.
- Mobile and tablets accounted for 57% of device type demand in 2026. DraftKings had mobile sports betting live in 27 states, Washington, D.C. and Puerto Rico during the second quarter of 2026, covering about 53% of the US population, and DraftKings' monthly unique payers rose about 9% to 3.6 million.
Regional Highlights
- The United States posts the fastest profiled growth in the country set, an 11.4% CAGR through the forecast decade, powered by iGaming expansion in newly legal states.
- India's Promotion and Regulation of Online Gaming Act, 2025, along with the 2026 Rules, took effect on 1 May 2026, prohibiting online money games of skill or chance across the country.
Market Size & Forecast
Table 1: Market Size and Forecast for the Online Gambling Market (USD billion and percentage), 2025 to 2036
| Metric | Value |
|---|---|
| 2025 Market Size | USD 105.5 billion |
| Estimated Market Size in 2026 | USD 116.6 billion |
| Projected Market Size by 2036 | USD 316.4 billion |
| CAGR, 2026 to 2036 | 10.5% |
| Added Revenue, 2026 to 2036 | USD 199.8 billion |
| Market Expansion Multiple | 2.7x |
Licensing in Latin America and the US continues to move wagering into taxed channels. Brazil counted 87 fully licensed operators by February 2026 against 49 in early 2025, and betting tax receipts for January and February 2026 reached R$2.5 billion, more than three times the R$756 million collected a year earlier. Missouri opened online sports betting on 1 December 2025, taking BetMGM's footprint to 30 states. Prediction markets have opened a further channel, and DraftKings reported in August 2026 that the Predictions product, launched in December 2025, was growing faster than anticipated. In-play wagering is likely to stay closely linked to the sports streaming platform ecosystem. However, Great Britain doubled Remote Gaming Duty from 21% to 40% in April 2026 and will apply a 25% remote betting rate from April 2027, cutting operator margins on online casino play. FMI expects licensed volumes to keep rising across the forecast period, with operator earnings tracking tax rates more closely than wagering growth.
Regulatory and Revenue Evidence
The six indicators below combine regulator yield data, tax changes and licensing status for the profiled countries, covering 2025 and 2026 reporting periods.
Table 2: Regulatory and Revenue Indicators for the Online Gambling Market (mixed units), mixed reporting years from 2025 to 2026
| Indicator | Data Point | Market Significance | Source |
|---|---|---|---|
| US commercial iGaming revenue, 2025 | USD 10.7 billion, up 27.6%, in seven states | Online casino growth remains concentrated in a small group of legal states | [1] |
| UK Remote Gaming Duty | 21% to 40% from April 2026; remote betting 25% from April 2027 | Resets operator margins and bonus budgets in Great Britain | See Country-wise Analysis |
| India online money games | Nationwide prohibition in force from 1 May 2026 | Leaves no licensed real-money channel as the Supreme Court challenge is pending | See Country-wise Analysis |
| Brazil licensed operators | 87 by February 2026; GGR tax 12% in 2025 rising to 13% in 2026, 15% targeted by 2028 | Licensed channel widens as the tax load steps up | See Country-wise Analysis |
| Germany regulated online GGR, 2025 | EUR 3.5 billion, up 2%; channelisation about 77% per GGL | Licensed growth lags offshore competition in online slots | See Country-wise Analysis |
| France online GGR, 2025 | EUR 2.617 billion, up 8.5%; 18.5% of total gambling GGR | Growth comes without online casino, which remains unlicensed | See Country-wise Analysis |
Analyst Perspective
“The 40% remote duty in Britain and India's money-gaming ban have shifted the contest from marketing spend to the economics of each licence. Groups with online casino scale in legal US states and local payment rails in Latin America hold the firmer earnings base through 2036.”
- Rahul Pandita, Principal Consultant, Future Market Insights.
How is the Online Gambling Market segmented?
Online gambling market is segmented by two primary commercial axes and region: game type, device type, and region. In 2026, sports betting is projected at 48% and mobile and tablets at 57%.
By game type: sports betting, casino, and lottery.
By device type: mobile and tablets, and desktop.
By region: North America, Latin America, Western Europe, Eastern Europe, East Asia, South Asia and Pacific, and Middle East and Africa.
Why does sports betting retain a notable game type share?
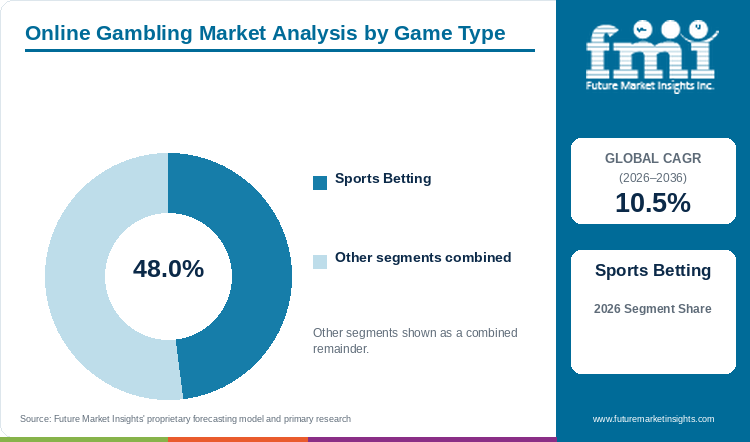
Sports betting holds 48% of game type demand in 2026, as sportsbook licences open most new jurisdictions and major tournaments raise handle.
Table 3: Game Type Share for the Online Gambling Market (percentage share), 2026
| Game Type | Share (2026) |
|---|---|
| Sports Betting | 48% |
| Other Segments Combined | 52%* |
| Total | 100% |
Table 4: Game Type Leadership and Market Growth for the Online Gambling Market (segment and CAGR percentage), 2026 to 2036
| Metric | Value |
|---|---|
| Global CAGR (2026 to 2036) | 10.5% |
| Leading Segment | Sports Betting |
In the FMI report, sports betting accounts for 48% of game type demand in 2026. Handle keeps rising even when results go against operators, as US sports betting handle grew 7.8% to USD 38.84 billion in the second quarter of 2026 as revenue was flat [2]. Flutter's US sportsbook revenue fell 15% in the same quarter, and DraftKings attributed a 5% revenue decline to customer-friendly sport outcomes and higher promotional spending. Pricing tools built on live data and sports analytics are likely to shape how much of that handle converts into yield.
- Sports betting accounts for 48% share in 2026, carried by Missouri, Brazil and other recent sportsbook-first launches.
- Quarterly hold swings of close to one percentage point move US sportsbook revenue more than handle growth does.[2]
Why do mobile and tablets lead device type demand?
Mobile and tablets hold 57% of device type demand in 2026, with app onboarding, wallets and in-play markets built for the phone.
As per FMI, mobile and tablets take 57% of device type demand in 2026, and desktop keeps the balance among longer casino and poker sessions. British operators have applied online slots stake caps of GBP 5 per spin for players aged 25 and over since 9 April 2025 and GBP 2 for those aged 18 to 24 since 21 May 2025. Average slots session length fell by two minutes to 15 minutes in January to March 2026, and sessions longer than an hour dropped to 4.4% from 5.9% [3]. Shorter sessions are likely to favour app-based play over the forecast period.
- App-led sign-up and deposit flows keep phones and tablets at 57% of 2026 demand.
- Desktop keeps a role in poker and live dealer casino, which keeps cross-device account access in demand.
What are the drivers, restraints, and opportunities in the Online Gambling Market?
In the online gambling market, state and national licensing widens legal access, remote duty increases and outright bans compress margins and addressable demand, and Latin American regulated markets offer the principal commercial opportunity.
- Driver: New US state and national licences bring wagering into taxed online channels.
- Restraint: Duty resets in Great Britain and the money-gaming ban in India.
- Opportunity: Regulated Latin American markets, with licensed operators posting record revenue..
Licensing expansion widens legal access
Missouri's launch on 1 December 2025 was the 26th US sports betting state for DraftKings and raised BetMGM to 30 legal states. Brazil's licensed roster nearly doubled from 49 operators in early 2025 to 87 by February 2026. Licensed operators are expected to extend these launches toward esports audiences as markets mature.
Gaming duties and prohibitions constrain margins
Flutter put the 2026 adjusted EBITDA cost of the UK iGaming tax change at USD 320 million, with USD 85 million of first-order mitigation, and the exit from Indian real-money gaming removes about USD 250 million of 2026 revenue. Entain plans to offset about 25% of the higher UK online duty during 2026. Bally's Intralot reported a gross effect of about USD 39 million on second-quarter 2026 B2C EBITDAR from the same duty rise. The Indian ban remains in force as the Supreme Court prepares a final hearing on the challenges, with no stay reported in August 2026.
Latin American regulated markets open growth
Betsson's Latin American revenue rose 32.3% to a record EUR 112.1 million in the second quarter of 2026, 36% of group revenue, with Argentina, Peru and Colombia each posting record quarterly revenue. Results are uneven across the region, as Entain's Brazil net gaming revenue fell 25% at constant currency in the first half of 2026. Local payment methods, licence-by-licence compliance and Spanish and Portuguese product depth are likely to shape which operators lead the region.
Which country CAGRs are profiled in the Online Gambling Market?
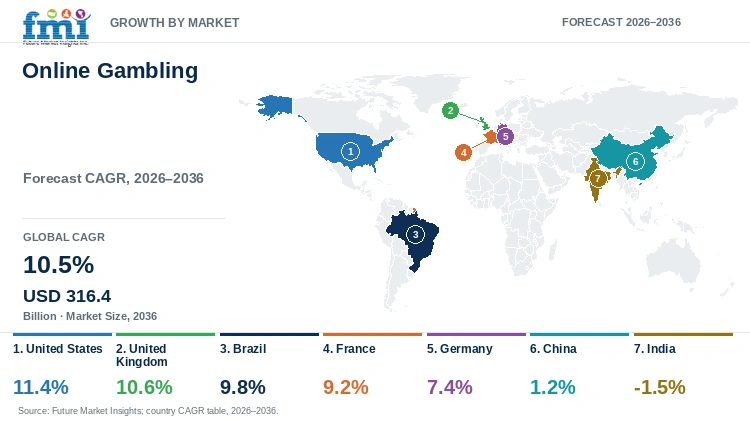
Table 5: Country CAGR Comparison for the Online Gambling Market (CAGR percentage), 2026 to 2036
| Country | CAGR |
|---|---|
| United States | 11.4% |
| United Kingdom | 10.6% |
| Brazil | 9.8% |
| France | 9.2% |
| Germany | 7.4% |
| China | 1.2% |
How do country-level CAGRs compare in the Online Gambling market?
Legal status, tax burden and the range of licensed products separate the profiled countries. The United States (11.4%) and the United Kingdom (10.6%) post the highest rates among the profiled set, with new state-by-state iGaming legalisation and rising regulated yield driving the gains despite higher duty. Brazil (9.8%) and France (9.2%) follow on licensed sports betting bases, while Germany (7.4%) trails the regulated group as 2025 online GGR grew only 2%. China (1.2%) and India (-1.5%) rank lowest: neither offers a licensed online real-money channel, so both depend heavily on enforcement and court outcomes.
- China has no legal domestic online channel, which leaves enforcement as the main variable.
- Germany adds yield through licensed virtual slots as sportsbook margins tighten.
- France grows on sports betting and poker, with online casino still barred.
- The United Kingdom carries the heaviest new remote duty in the group.
- The United States adds volume through state-by-state legalisation.
- Brazil builds on the licensed regime as the GGR tax rate climbs.
Full report country CAGRs cover: North America; Latin America; Western Europe; Eastern Europe; East Asia; South Asia and Pacific; Middle East and Africa.
Country-wise Analysis
- China is estimated to expand at just 1.2% CAGR through 2036, the slowest rate in the profiled group, reflecting that online gambling remains illegal on the mainland. The Ministry of Public Security reported destroying more than 4,500 online gambling platforms and probing 73,000 cross-border gambling cases in 2024. With no licensed domestic online channel, the FMI estimate reflects enforcement activity rather than market expansion.
- German online gambling revenue is estimated to compound at 7.4% a year to 2036, the slowest rate among the regulated European markets profiled. Regulated online revenue reached EUR 3.5 billion in 2025, up just 2%, with virtual slots up 11% to EUR 543 million offset by sports betting GGR down 4% to EUR 1.89 billion on higher payouts. The GGL puts channelisation near 77%, a figure industry groups dispute for online slots.
- France is projected to record 9.2% CAGR through 2036 from a market capped at three online products. Online sports betting generated EUR 1.766 billion in 2025, about 68% of online revenue, and poker rose 6.5% to EUR 525 million. Online casino remained illegal as of August 2026, with legalisation not expected during the year.
- The United Kingdom is predicted to rise at 10.6% CAGR through 2036, the second-fastest rate in the profiled group. Remote casino, betting and bingo produced GBP 5.55 billion of gross gambling yield in 2025, and remote casino made up 70% of fourth-quarter remote yield. With Remote Gaming Duty at 40% since April 2026, FMI expects British growth to keep tracking player volume even as margins reset lower.
- US online gambling is projected to post the fastest profiled CAGR, 11.4%, to 2036. iGaming revenue rose 27.6% in 2025 to USD 10.7 billion across seven legal states, and DraftKings' online casino reached about 11% of the population in the second quarter of 2026 [1]. Each further state that legalises online casino would widen the base faster than additional sportsbook launches.
- Brazil is projected to grow at 9.8% CAGR through 2036, among the faster profiled rates as licensing widens the taxed channel. The GGR tax rate moved from 12% in 2025 to 13% in 2026 and is set to reach 15% by 2028, and 2025 betting tax receipts totalled R$9.95 billion. The rising tax path is expected to slow the gain from channelisation later in the forecast period.
Who are the notable companies in the Online Gambling Market?
The FMI company set covers Flutter Entertainment, bet365, Entain, DraftKings, MGM Resorts International, evoke plc, FDJ United, Betsson AB, Super Group (SGHC) Limited, Penn Entertainment, Caesars Digital, and Fanatics Betting & Gaming.
Ten operators span three business models. Global groups hold licences across dozens of markets, US operators compete state by state on sportsbook and iGaming apps, and regional specialists focus on lottery, Latin America or Africa. Ownership is consolidating, with Kindred now inside FDJ United and evoke awaiting court sanction for the sale to Bally's Intralot.
- Global multi-market operators: Flutter Entertainment, bet365, Entain.
- US-focused operators: DraftKings, MGM Resorts International (BetMGM), Penn Entertainment, Caesars Digital, and Fanatics Betting & Gaming.
- European and emerging-market specialists: evoke plc, FDJ United, Betsson AB, Super Group (SGHC) Limited.
Competitive Benchmarking: Online Gambling Market
Table 6: Competitive Benchmarking for the Online Gambling Market (qualitative capability ratings), 2026
| Company | Sports Betting | Online Casino | Lottery | Reach |
|---|---|---|---|---|
| Flutter Entertainment | High | High | Low | High |
| bet365 | High | Medium | Low | High |
| Entain | High | Medium | Low | High |
| DraftKings | High | Medium | Low | Medium |
| MGM Resorts International | Medium | High | Low | Medium |
| evoke plc | Medium | Medium | Low | Medium |
| FDJ United | Medium | Medium | High | Medium |
| Betsson AB | Medium | High | Low | Medium |
| Super Group (SGHC) Limited | Medium | Medium | Low | Medium |
| Penn Entertainment | Medium | Low | Low | Low |
| Caesars Digital | High | Medium | Low | Medium |
| Fanatics Betting & Gaming | High | Low | Low | Low |
High indicates broad disclosure of product-level data, Medium indicates partial disclosure, and Low indicates limited disclosure. The ratings reflect disclosure depth only, not product quality, market share or company rank.
Key Developments in the Online Gambling Market
- In August 2026, evoke shareholders approved the GBP 243.1 million all-share acquisition by Bally's Intralot, with court sanction expected in the fourth quarter of 2026 or the first quarter of 2027.
- In August 2026, Flutter Entertainment reported second-quarter revenue of USD 4,326 million and cut the 2026 group revenue guidance midpoint by USD 395 million.
- In July 2026, Betsson reported Latin America as the largest region for the first time, with quarterly regional revenue of EUR 112.1 million.
- In July 2026, FDJ United reported first-half revenue of EUR 1,782 million, down 4.5%, attributed to higher gaming taxes and lower lottery revenue.
Key Players in the Online Gambling Market
Global Multi-market Operators
- Flutter Entertainment
- bet365
- Entain
US-focused Operators
- DraftKings
- MGM Resorts International
- Penn Entertainment
- Caesars Digital
- Fanatics Betting & Gaming
European and Emerging-market Specialists
- evoke plc
- FDJ United
- Betsson AB
- Super Group (SGHC) Limited
Online Gambling Market - Report Scope
Table 7: Report Scope for the Online Gambling Market (coverage fields and definitions), 2026 to 2036
| Coverage field | Report scope |
|---|---|
| Market breakdown | Game type; device type; region |
| Quantitative units | USD billion |
| Market definition | Gross gaming revenue from real-money wagering placed by consumers over the internet on sports betting, casino games (including poker and live dealer) and lottery products (including bingo); excludes land-based wagering, social and free-to-play games without cash prizes, and B2B platform and supplier revenue |
| Regions covered | North America; Latin America; Western Europe; Eastern Europe; East Asia; South Asia and Pacific; Middle East and Africa |
| Countries covered | China; India; Germany; France; United Kingdom; United States; Brazil |
| Key companies profiled | Flutter Entertainment; bet365; Entain; DraftKings; MGM Resorts International; evoke plc; FDJ United; Betsson AB; Super Group (SGHC) Limited; Penn Entertainment; Caesars Digital; Fanatics Betting & Gaming |
| Forecast period | 2026 to 2036 |
| Approach | The model ties bottom-up volumes to top-down estimates, reconciling operator-reported online revenue, regulator gross gaming revenue data and device-level usage across the covered markets. |
Online Gambling Market - Research Methodology
Table 8: Research Methodology for the Online Gambling Market (research methods and approach), 2026 edition
| Method | Approach |
|---|---|
| Primary Research | Interviews with operator, platform supplier, payments and compliance professionals across licensed markets. |
| Desk Research | Review of regulator statistics, tax legislation, operator results releases and trade association reports. |
| Market Sizing and Forecasting | Country-level gross gaming revenue modelling by game type and device, adjusted for licensing status and tax changes. |
| Data Validation | Triangulation of model outputs against regulator data and listed operator disclosures, with analyst review of outliers. |
Online Gambling Market by Segments
Online Gambling Market segmented by Game Type:
- Sports Betting
- Casino
- Lottery
Online Gambling Market segmented by Device Type:
- Mobile and Tablets
- Desktop
Online Gambling Market by Region
- North America
- United States
- Canada
- Latin America
- Brazil
- Mexico
- Argentina
- Chile
- Western Europe
- Germany
- France
- United Kingdom
- Italy
- Spain
- Benelux
- Nordics
- Eastern Europe
- Poland
- Czech Republic
- Romania
- Hungary
- East Asia
- China
- Japan
- South Korea
- South Asia and Pacific
- India
- ASEAN
- Australia and New Zealand
- Middle East and Africa
- GCC Countries
- South Africa
- Türkiye
- Israel
Research Sources and Bibliography
- [1] American Gaming Association. (2026, May). Commercial Gaming Revenue Tracker, Full Year 2025.
- [2] American Gaming Association. (2026, August). Commercial Gaming Revenue Tracker, Q2 2026
- [3] Gambling Commission. (2026, May 21). Market overview: operator data to March 2026. https://www.gamblingcommission.gov.uk/statistics-and-research/publication/market-overview-operator-data-to-march-2026-published-may-2026
This Report Answers
- How big is the online gambling market during 2026?
- What value is projected by 2036?
- Which game type leads by share?
- Which device type leads by share?
- Which countries show the fastest growth?
- Which companies lead the market?
Table of Content
- Key Takeaways
- Market Size and CAGR
- Top Growth Driver
- Fastest Growing Segment
- Leading Region
- Key Companies
- Emerging Opportunities
- Executive Summary
- Global Market Outlook
- Demand-side Trends
- Supply-side Trends
- Technology Roadmap Analysis
- Analysis and Recommendations
- Analyst Perspective (What is happening? Why now? What should investors know?)
- Key Questions Answered
- How large is the market?
- What is the CAGR?
- What are key trends?
- Which region dominates?
- Who are the leaders?
Read More...
- Market Overview
- Market Coverage / Taxonomy
- Market Definition / Scope / Limitations
- Research Methodology
- Chapter Orientation
- Analytical Lens and Working Hypotheses
- Market Structure, Signals, and Trend Drivers
- Benchmarking and Cross-market Comparability
- Market Sizing, Forecasting, and Opportunity Mapping
- Research Design and Evidence Framework
- Desk Research Programme (Secondary Evidence)
- Expert Input and Fieldwork (Primary Evidence)
- Tooling, Models, and Reference Databases
- Data Engineering and Model Build
- Quality Assurance and Audit Trail
- Market Background
- Market Dynamics (Drivers, Restraints, Opportunity, Trends)
- Scenario Forecast (Optimistic, Likely, Conservative)
- Impact Analysis
- AI Impact
- Sustainability Impact
- Regulatory Impact
- Technology Impact
- Consumer / Buyer Analysis
- Purchase Drivers
- Adoption Barriers
- Buyer Journey
- Opportunity Map Analysis
- Product Life Cycle Analysis
- Supply Chain Analysis
- Investment Feasibility Matrix
- Value Chain Analysis
- PESTLE and Porter's Analysis
- Regulatory Landscape
- Regional Parent Market Outlook
- Production and Consumption Statistics
- Import and Export Statistics
- Global Market Analysis and Forecast, 2021 to 2036
- Historical Market Size Value (USD Billion) Analysis, 2021 to 2025
- Current and Future Market Size Value (USD Billion) Projections, 2026 to 2036
- Y-o-Y Growth Trend Analysis
- Absolute $ Opportunity Analysis
- Global Market Pricing Analysis, 2021 to 2036
- Global Market Analysis and Forecast, By Game Type, 2021 to 2036
- Introduction / Key Findings
- Historical Market Size Value (USD Billion) Analysis By Game Type, 2021 to 2025
- Current and Future Market Size Value (USD Billion) Analysis and Forecast By Game Type, 2026 to 2036
- Sports Betting
- Casino
- Lottery
- Y-o-Y Growth Trend Analysis By Game Type, 2021 to 2025
- Absolute $ Opportunity Analysis By Game Type, 2026 to 2036
- Global Market Analysis and Forecast, By Device Type, 2021 to 2036
- Introduction / Key Findings
- Historical Market Size Value (USD Billion) Analysis By Device Type, 2021 to 2025
- Current and Future Market Size Value (USD Billion) Analysis and Forecast By Device Type, 2026 to 2036
- Mobile and Tablets
- Desktop
- Y-o-Y Growth Trend Analysis By Device Type, 2021 to 2025
- Absolute $ Opportunity Analysis By Device Type, 2026 to 2036
- Global Market Analysis and Forecast, By Region, 2021 to 2036
- Introduction
- Historical Market Size Value (USD Billion) Analysis By Region, 2021 to 2025
- Current Market Size Value (USD Billion) Analysis and Forecast By Region, 2026 to 2036
- North America
- Latin America
- Western Europe
- Eastern Europe
- East Asia
- South Asia and Pacific
- Middle East and Africa
- Market Attractiveness Analysis By Region
- North America Market Analysis and Forecast, By Country, 2021 to 2036
- Historical Market Size Value (USD Billion) Trend Analysis By Market Taxonomy, 2021 to 2025
- Market Size Value (USD Billion) Forecast By Market Taxonomy, 2026 to 2036
- By Country
- United States
- Canada
- By Game Type
- By Device Type
- By Country
- Market Attractiveness Analysis
- By Country
- By Game Type
- By Device Type
- Key Takeaways
- Latin America Market Analysis and Forecast, By Country
- Historical Market Size Value (USD Billion) Trend Analysis By Market Taxonomy, 2021 to 2025
- Market Size Value (USD Billion) Forecast By Market Taxonomy, 2026 to 2036
- By Country
- Brazil
- Mexico
- Argentina
- Chile
- By Game Type
- By Device Type
- By Country
- Market Attractiveness Analysis
- By Country
- By Game Type
- By Device Type
- Key Takeaways
- Western Europe Market Analysis and Forecast, By Country
- Historical Market Size Value (USD Billion) Trend Analysis By Market Taxonomy, 2021 to 2025
- Market Size Value (USD Billion) Forecast By Market Taxonomy, 2026 to 2036
- By Country
- Germany
- France
- United Kingdom
- Italy
- Spain
- Benelux
- Nordics
- By Game Type
- By Device Type
- By Country
- Market Attractiveness Analysis
- By Country
- By Game Type
- By Device Type
- Key Takeaways
- Eastern Europe Market Analysis and Forecast, By Country
- Historical Market Size Value (USD Billion) Trend Analysis By Market Taxonomy, 2021 to 2025
- Market Size Value (USD Billion) Forecast By Market Taxonomy, 2026 to 2036
- By Country
- Poland
- Czech Republic
- Romania
- Hungary
- By Game Type
- By Device Type
- By Country
- Market Attractiveness Analysis
- By Country
- By Game Type
- By Device Type
- Key Takeaways
- East Asia Market Analysis and Forecast, By Country
- Historical Market Size Value (USD Billion) Trend Analysis By Market Taxonomy, 2021 to 2025
- Market Size Value (USD Billion) Forecast By Market Taxonomy, 2026 to 2036
- By Country
- China
- Japan
- South Korea
- By Game Type
- By Device Type
- By Country
- Market Attractiveness Analysis
- By Country
- By Game Type
- By Device Type
- Key Takeaways
- South Asia and Pacific Market Analysis and Forecast, By Country
- Historical Market Size Value (USD Billion) Trend Analysis By Market Taxonomy, 2021 to 2025
- Market Size Value (USD Billion) Forecast By Market Taxonomy, 2026 to 2036
- By Country
- India
- ASEAN
- Australia and New Zealand
- By Game Type
- By Device Type
- By Country
- Market Attractiveness Analysis
- By Country
- By Game Type
- By Device Type
- Key Takeaways
- Middle East and Africa Market Analysis and Forecast, By Country
- Historical Market Size Value (USD Billion) Trend Analysis By Market Taxonomy, 2021 to 2025
- Market Size Value (USD Billion) Forecast By Market Taxonomy, 2026 to 2036
- By Country
- GCC Countries
- South Africa
- Türkiye
- Israel
- By Game Type
- By Device Type
- By Country
- Market Attractiveness Analysis
- By Country
- By Game Type
- By Device Type
- Key Takeaways
- Key Countries Market Analysis
- United States
- Pricing Analysis
- Market Share Analysis, 2025
- By Game Type
- By Device Type
- Canada
- Pricing Analysis
- Market Share Analysis, 2025
- By Game Type
- By Device Type
- Mexico
- Pricing Analysis
- Market Share Analysis, 2025
- By Game Type
- By Device Type
- Brazil
- Pricing Analysis
- Market Share Analysis, 2025
- By Game Type
- By Device Type
- Chile
- Pricing Analysis
- Market Share Analysis, 2025
- By Game Type
- By Device Type
- Germany
- Pricing Analysis
- Market Share Analysis, 2025
- By Game Type
- By Device Type
- United Kingdom
- Pricing Analysis
- Market Share Analysis, 2025
- By Game Type
- By Device Type
- Italy
- Pricing Analysis
- Market Share Analysis, 2025
- By Game Type
- By Device Type
- Spain
- Pricing Analysis
- Market Share Analysis, 2025
- By Game Type
- By Device Type
- France
- Pricing Analysis
- Market Share Analysis, 2025
- By Game Type
- By Device Type
- India
- Pricing Analysis
- Market Share Analysis, 2025
- By Game Type
- By Device Type
- ASEAN
- Pricing Analysis
- Market Share Analysis, 2025
- By Game Type
- By Device Type
- Australia and New Zealand
- Pricing Analysis
- Market Share Analysis, 2025
- By Game Type
- By Device Type
- China
- Pricing Analysis
- Market Share Analysis, 2025
- By Game Type
- By Device Type
- Japan
- Pricing Analysis
- Market Share Analysis, 2025
- By Game Type
- By Device Type
- South Korea
- Pricing Analysis
- Market Share Analysis, 2025
- By Game Type
- By Device Type
- Poland
- Pricing Analysis
- Market Share Analysis, 2025
- By Game Type
- By Device Type
- Hungary
- Pricing Analysis
- Market Share Analysis, 2025
- By Game Type
- By Device Type
- Türkiye
- Pricing Analysis
- Market Share Analysis, 2025
- By Game Type
- By Device Type
- South Africa
- Pricing Analysis
- Market Share Analysis, 2025
- By Game Type
- By Device Type
- United States
- Market Structure Analysis
- Competition Dashboard
- Competition Benchmarking
- Market Share Analysis of Top Players
- By Regional
- By Game Type
- By Device Type
- Emerging Startups
- Innovation Benchmarking
- Competition Analysis
- Competition Deep Dive
- Flutter Entertainment
- Overview
- Product Portfolio
- Profitability by Market Segments
- Sales Footprint
- Strategy Overview
- Marketing Strategy
- Product Strategy
- Channel Strategy
- bet365
- Entain
- DraftKings
- MGM Resorts International
- evoke plc
- FDJ United
- Betsson AB
- Super Group (SGHC) Limited
- Penn Entertainment
- Caesars Digital
- Fanatics Betting & Gaming
- Flutter Entertainment
- Case Studies
- Success Stories
- Recent Developments
- Competition Deep Dive
- Assumptions & Acronyms Used
List of Tables
- Table 1: Global Market Value (USD Billion) Forecast by Region, 2021 to 2036
- Table 2: Global Market Value (USD Billion) Forecast by Game Type, 2021 to 2036
- Table 3: Global Market Value (USD Billion) Forecast by Device Type, 2021 to 2036
- Table 4: North America Market Value (USD Billion) Forecast by Country, 2021 to 2036
- Table 5: North America Market Value (USD Billion) Forecast by Game Type, 2021 to 2036
- Table 6: North America Market Value (USD Billion) Forecast by Device Type, 2021 to 2036
- Table 7: Latin America Market Value (USD Billion) Forecast by Country, 2021 to 2036
- Table 8: Latin America Market Value (USD Billion) Forecast by Game Type, 2021 to 2036
- Table 9: Latin America Market Value (USD Billion) Forecast by Device Type, 2021 to 2036
- Table 10: Western Europe Market Value (USD Billion) Forecast by Country, 2021 to 2036
- Table 11: Western Europe Market Value (USD Billion) Forecast by Game Type, 2021 to 2036
- Table 12: Western Europe Market Value (USD Billion) Forecast by Device Type, 2021 to 2036
- Table 13: Eastern Europe Market Value (USD Billion) Forecast by Country, 2021 to 2036
- Table 14: Eastern Europe Market Value (USD Billion) Forecast by Game Type, 2021 to 2036
- Table 15: Eastern Europe Market Value (USD Billion) Forecast by Device Type, 2021 to 2036
- Table 16: East Asia Market Value (USD Billion) Forecast by Country, 2021 to 2036
- Table 17: East Asia Market Value (USD Billion) Forecast by Game Type, 2021 to 2036
- Table 18: East Asia Market Value (USD Billion) Forecast by Device Type, 2021 to 2036
- Table 19: South Asia and Pacific Market Value (USD Billion) Forecast by Country, 2021 to 2036
- Table 20: South Asia and Pacific Market Value (USD Billion) Forecast by Game Type, 2021 to 2036
- Table 21: South Asia and Pacific Market Value (USD Billion) Forecast by Device Type, 2021 to 2036
- Table 22: Middle East and Africa Market Value (USD Billion) Forecast by Country, 2021 to 2036
- Table 23: Middle East and Africa Market Value (USD Billion) Forecast by Game Type, 2021 to 2036
- Table 24: Middle East and Africa Market Value (USD Billion) Forecast by Device Type, 2021 to 2036
List of Figures
- Figure 1: Global Market Pricing Analysis
- Figure 2: Global Market Value (USD Billion) Forecast 2021-2036
- Figure 3: Global Market Value Share and BPS Analysis by Game Type, 2026 and 2036
- Figure 4: Global Market Y-o-Y Growth Comparison by Game Type, 2026-2036
- Figure 5: Global Market Attractiveness Analysis by Game Type
- Figure 6: Global Market Value Share and BPS Analysis by Device Type, 2026 and 2036
- Figure 7: Global Market Y-o-Y Growth Comparison by Device Type, 2026-2036
- Figure 8: Global Market Attractiveness Analysis by Device Type
- Figure 9: Global Market Value (USD Billion) Share and BPS Analysis by Region, 2026 and 2036
- Figure 10: Global Market Y-o-Y Growth Comparison by Region, 2026-2036
- Figure 11: Global Market Attractiveness Analysis by Region
- Figure 12: North America Market Incremental Dollar Opportunity, 2026-2036
- Figure 13: Latin America Market Incremental Dollar Opportunity, 2026-2036
- Figure 14: Western Europe Market Incremental Dollar Opportunity, 2026-2036
- Figure 15: Eastern Europe Market Incremental Dollar Opportunity, 2026-2036
- Figure 16: East Asia Market Incremental Dollar Opportunity, 2026-2036
- Figure 17: South Asia and Pacific Market Incremental Dollar Opportunity, 2026-2036
- Figure 18: Middle East and Africa Market Incremental Dollar Opportunity, 2026-2036
- Figure 19: North America Market Value Share and BPS Analysis by Country, 2026 and 2036
- Figure 20: North America Market Value Share and BPS Analysis by Game Type, 2026 and 2036
- Figure 21: North America Market Y-o-Y Growth Comparison by Game Type, 2026-2036
- Figure 22: North America Market Attractiveness Analysis by Game Type
- Figure 23: North America Market Value Share and BPS Analysis by Device Type, 2026 and 2036
- Figure 24: North America Market Y-o-Y Growth Comparison by Device Type, 2026-2036
- Figure 25: North America Market Attractiveness Analysis by Device Type
- Figure 26: Latin America Market Value Share and BPS Analysis by Country, 2026 and 2036
- Figure 27: Latin America Market Value Share and BPS Analysis by Game Type, 2026 and 2036
- Figure 28: Latin America Market Y-o-Y Growth Comparison by Game Type, 2026-2036
- Figure 29: Latin America Market Attractiveness Analysis by Game Type
- Figure 30: Latin America Market Value Share and BPS Analysis by Device Type, 2026 and 2036
- Figure 31: Latin America Market Y-o-Y Growth Comparison by Device Type, 2026-2036
- Figure 32: Latin America Market Attractiveness Analysis by Device Type
- Figure 33: Western Europe Market Value Share and BPS Analysis by Country, 2026 and 2036
- Figure 34: Western Europe Market Value Share and BPS Analysis by Game Type, 2026 and 2036
- Figure 35: Western Europe Market Y-o-Y Growth Comparison by Game Type, 2026-2036
- Figure 36: Western Europe Market Attractiveness Analysis by Game Type
- Figure 37: Western Europe Market Value Share and BPS Analysis by Device Type, 2026 and 2036
- Figure 38: Western Europe Market Y-o-Y Growth Comparison by Device Type, 2026-2036
- Figure 39: Western Europe Market Attractiveness Analysis by Device Type
- Figure 40: Eastern Europe Market Value Share and BPS Analysis by Country, 2026 and 2036
- Figure 41: Eastern Europe Market Value Share and BPS Analysis by Game Type, 2026 and 2036
- Figure 42: Eastern Europe Market Y-o-Y Growth Comparison by Game Type, 2026-2036
- Figure 43: Eastern Europe Market Attractiveness Analysis by Game Type
- Figure 44: Eastern Europe Market Value Share and BPS Analysis by Device Type, 2026 and 2036
- Figure 45: Eastern Europe Market Y-o-Y Growth Comparison by Device Type, 2026-2036
- Figure 46: Eastern Europe Market Attractiveness Analysis by Device Type
- Figure 47: East Asia Market Value Share and BPS Analysis by Country, 2026 and 2036
- Figure 48: East Asia Market Value Share and BPS Analysis by Game Type, 2026 and 2036
- Figure 49: East Asia Market Y-o-Y Growth Comparison by Game Type, 2026-2036
- Figure 50: East Asia Market Attractiveness Analysis by Game Type
- Figure 51: East Asia Market Value Share and BPS Analysis by Device Type, 2026 and 2036
- Figure 52: East Asia Market Y-o-Y Growth Comparison by Device Type, 2026-2036
- Figure 53: East Asia Market Attractiveness Analysis by Device Type
- Figure 54: South Asia and Pacific Market Value Share and BPS Analysis by Country, 2026 and 2036
- Figure 55: South Asia and Pacific Market Value Share and BPS Analysis by Game Type, 2026 and 2036
- Figure 56: South Asia and Pacific Market Y-o-Y Growth Comparison by Game Type, 2026-2036
- Figure 57: South Asia and Pacific Market Attractiveness Analysis by Game Type
- Figure 58: South Asia and Pacific Market Value Share and BPS Analysis by Device Type, 2026 and 2036
- Figure 59: South Asia and Pacific Market Y-o-Y Growth Comparison by Device Type, 2026-2036
- Figure 60: South Asia and Pacific Market Attractiveness Analysis by Device Type
- Figure 61: Middle East and Africa Market Value Share and BPS Analysis by Country, 2026 and 2036
- Figure 62: Middle East and Africa Market Value Share and BPS Analysis by Game Type, 2026 and 2036
- Figure 63: Middle East and Africa Market Y-o-Y Growth Comparison by Game Type, 2026-2036
- Figure 64: Middle East and Africa Market Attractiveness Analysis by Game Type
- Figure 65: Middle East and Africa Market Value Share and BPS Analysis by Device Type, 2026 and 2036
- Figure 66: Middle East and Africa Market Y-o-Y Growth Comparison by Device Type, 2026-2036
- Figure 67: Middle East and Africa Market Attractiveness Analysis by Device Type
- Figure 68: Global Market - Tier Structure Analysis
- Figure 69: Global Market - Company Share Analysis
Frequently Asked Questions
How large is the online gambling market expected in 2026?
USD 116.6 billion in 2026, according to FMI, on the way to USD 316.4 billion in 2036, close to a 2.7x step-up across ten years.
What CAGR is projected for the online gambling market through 2036?
FMI puts annual growth at 10.5% over 2026 to 2036. New US state and Latin American licences add volume each year, as remote duty increases in Britain and other European markets hold back operator earnings.
Which game type holds the leading market share in 2026?
Sports betting, at 48% of game type demand in 2026. Casino and lottery together make up the remaining 52%, with online casino growing faster in the US and Britain.
Which device type holds the leading share in 2026?
Mobile and tablets, at 57% of device type demand in 2026, with desktop retaining poker and longer live casino sessions.
Which country has the fastest expansion outlook through 2036?
The United States tops the profiled list at 11.4%, with the United Kingdom at 10.6% behind on rising regulated yield despite higher duty. China (1.2%) and India (-1.5%) rank lowest, as neither offers a licensed online real-money channel.
Who are the key companies in the online gambling market?
Key companies include Flutter Entertainment, bet365, Entain, DraftKings, MGM Resorts International, evoke plc, FDJ United, Betsson AB, Super Group (SGHC) Limited, Penn Entertainment, Caesars Digital, and Fanatics Betting & Gaming.
Preview the report firsthand - request a free sample
Get SampleGet the brochure for pricing and purchase details.
Get PDF
