


Optical Coherence Tomography Market : Global Industry Analysis and Opportunity Assessment, 2036
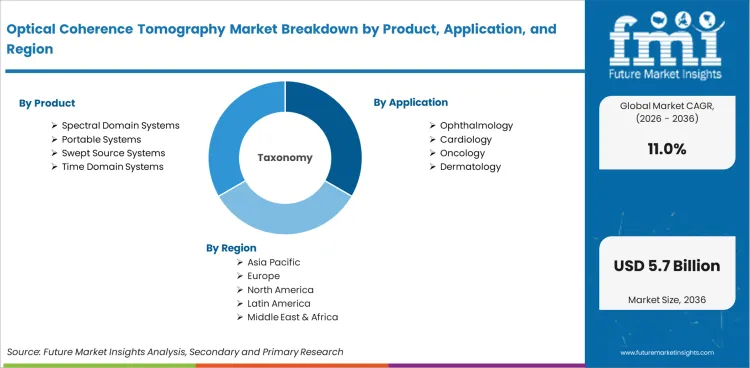
The Optical Coherence Tomography Market is segmented by Product (Spectral Domain Systems, Portable Systems, Swept Source Systems, Time Domain Systems), Application (Ophthalmology, Cardiology, Oncology, Dermatology), End Use (Hospitals, Diagnostic Centers, Research Institutes), Technology, Modality, and Region. Forecast for 2026 to 2036.
- Market Size (2026): USD 2.0 Bn
- Forecast (2036): USD 5.7 Bn
- CAGR (2026 to 2036): 11.0%
Optical Coherence Tomography Market Size, Market Forecast and Outlook By FMI
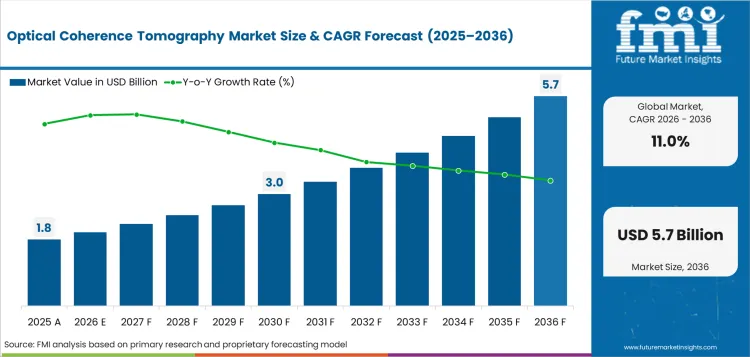
The optical coherence tomography market was valued at USD 1.8 billion in 2025. The market is expected to reach USD 2.0 billion by 2026-end and expand at a CAGR of 11.0% between 2026 and 2036 to reach USD 5.7 billion by 2036. Tabletop systems are expected to dominate with a 65.0% modality share, and spectral domain technology is poised to lead the technology segment with a 62.0% share.
Summary of the Optical Coherence Tomography Market
- Demand and Growth Drivers
- Retina care volume reinforces OCT demand as clinicians need repeat imaging for macula and optic nerve review.
- Diabetes related eye screening increases scan workload across hospitals and diagnostic centers.
- Coronary imaging adds a specialized demand base as interventional cardiology uses OCT for vessel assessment.
- Product and Segment View
- Tabletop systems are expected to lead the modality segment with 65.0% share in 2026, reflecting stable imaging-room use.
- Spectral domain technology is projected to dominate technology demand with 62.0% share in 2026, reflecting speed and image depth.
- Ophthalmology is poised to hold high-value application demand with 60.0% share in 2026.
- Geography and Competitive Outlook
- China is expected to record a CAGR of 15.0% through 2036 as hospital imaging capacity expands.
- India is projected to expand at 13.9% CAGR by 2036 as diabetes screening needs widen.
- Companies combining retinal workflow depth with software integration are strengthening their position during the forecast period.
- Analyst Opinion
- Sabyasachi Ghosh, Principal Consultant for Healthcare at FMI, says, “OCT is becoming routine evidence for retina care and coronary imaging. Clinics need fast scans with reliable image comparison. Small eye centers face ownership costs from service contracts. Robotic capture and disease review tools reduce scan rework across care networks.”
- Optical Coherence Tomography Market Value Analysis
- The optical coherence tomography market is moving from specialist retina equipment into a broader clinical imaging base.
- Repeat retinal monitoring for diabetic retinopathy and macular degeneration care is strengthening adoption.
- The market is benefiting from deeper use of optical imaging across clinical and research settings.
- Scan records strengthen demand by supporting follow-up care and treatment planning.
Eye clinics are handling more OCT scans, so they need systems which are easy to use and give consistent results. ZEISS strengthened CIRRUS 6000 with a reference database of 870 healthy eyes and added cybersecurity features, which helps clinics compare patient scans more confidently and protect imaging data. Topcon added OCT angiography to the robotic Maestro2 system to enhance imaging capability.The system includes 3×3 and 4.5×4.5 mm scan options to support detailed diagnostics. It offers a 6×6 mm scan option, helping clinics capture images faster with less operator effort. Coronary OCT is also creating a separate demand area. FDA’s 2026 clearance document for Abbott’s Ultreon 3.0 states that the software uses machine learning for automated morphology assessment and works with Dragonfly catheters in vessels from 2.0 to 3.5 mm. This makes OCT more useful in cath labs as well as eye clinics.
Optical Coherence Tomography Market Definition
The optical coherence tomography market includes imaging systems used to create cross-sectional tissue images using light. These systems assess retinal layers, optic nerve structures, coronary vessels and selected tissue sites. Scope includes spectral domain systems, swept source systems, time domain systems, tabletop systems and portable systems. Standalone fundus cameras, therapeutic lasers and non-OCT diagnostic devices are outside the scope.
Optical Coherence Tomography Market Inclusions
Market scope covers all commercially traded optical coherence tomography systems categorized by product type, including spectral domain systems, swept source systems, time domain systems, and portable systems; end users, including hospitals, diagnostic centers, eye care clinics, research institutes, and specialty care providers; applications, including ophthalmology, cardiology, oncology, and dermatology; and modality types, including tabletop systems and portable systems. Revenue scope covers 2026 to 2036. The key stakeholders include OCT system manufacturers, optical component suppliers, imaging software providers, ophthalmology clinics, hospital imaging departments, cardiology centers, diagnostic service providers, research institutes, distributors, service partners, and regulatory bodies.
Optical Coherence Tomography Market Exclusions
Scope does not include fundus cameras without OCT capability, surgical lasers, ultrasound imaging systems, general eye charts or standalone image management software.
Optical Coherence Tomography Market Research Methodology
- Primary Research: FMI analysts talked to hospitals, ophthalmology clinics, diagnostic centers, cardiology users and imaging equipment distributors in important markets.
- Desk Research: Combined data from clinical guidance, company product portfolios, regulatory clearances and imaging equipment references.
- Market sizing and forecasting: Added OCT system use across product, application and modality groups from the bottom up.
- Data validation: Cross-checked every three months against clinical imaging use, installed equipment renewal and company portfolio coverage.
Why is the Optical Coherence Tomography Market Growing?
- Retina specialists are using OCT earlier to reduce uncertainty before treatment and follow-up planning.
- Hospital imaging teams are adding systems as retinal disease work needs fast non-invasive scans.
- Cardiology users are applying OCT in coronary procedures as vessel-level images improve intervention planning.
Diabetes screening is a direct pull factor for OCT equipment as retinal damage needs early review. IDF reported 589 million adults aged 20 to 79 living with diabetes worldwide in 2024. This patient base raises pressure on eye care systems to add repeatable imaging workflows. OCT suppliers gain importance as clinics need reliable scan capture across follow-up visits.
Ophthalmology is the main use case as OCT gives doctors a cross-section view of the retina. American Academy of Ophthalmology describes OCT as a non-invasive test using light waves to take cross-section retina pictures. This makes OCT useful for macula and optic nerve assessment across routine care. Adjacent ophthalmic diagnostic equipment demand keeps oct close to broader eye care investment decisions.
Market Segmentation Analysis
- Spectral domain systems are forecast to hold 55.0% of product revenue in 2026, driven by retinal imaging workflows needing fast and repeatable scans.
- Ophthalmology is expected to represent 60.0% of application use in 2026 as eye care teams rely on OCT for diagnosis and follow-up review.
- Hospitals are projected to capture 56.0% of end use share in 2026, reflecting specialist imaging rooms and higher patient scan volumes.
- Spectral domain technology is forecast to command 62.0% of technology preference in 2026 through its balance of image detail and scan speed.
- Tabletop systems are predicted to lead modality adoption with 65.0% share in 2026 as stationary diagnostic sites prioritize stable image capture.
The market for optical coherence tomography is divided into five primary segment groups based on product, application, end use, technology and modality. Product includes spectral domain systems, portable systems, swept source systems and time domain systems. application includes ophthalmology, cardiology, oncology and dermatology. End use includes hospitals, diagnostic centers and research institutes. Technology includes spectral domain technology, swept source technology and time domain technology. Modality includes tabletop systems and portable systems.
Insights into Optical Coherence Tomography Market by Product
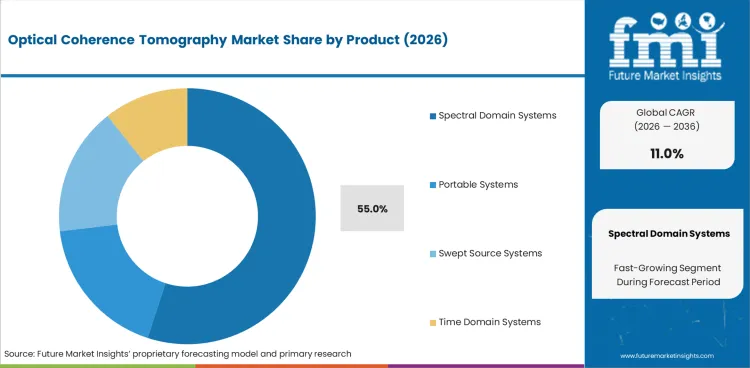
- Spectral domain systems are expected to contribute 55.0% of the product segment in 2026. Retina specialists prefer these systems for fast scan capture and consistent image comparison across repeat visits.
- Swept source systems serve deeper tissue imaging needs in selected advanced clinics. Spectral domain platforms retain broader use as hospitals balance image quality with practical operating cost.
Insights into Optical Coherence Tomography Market by Application
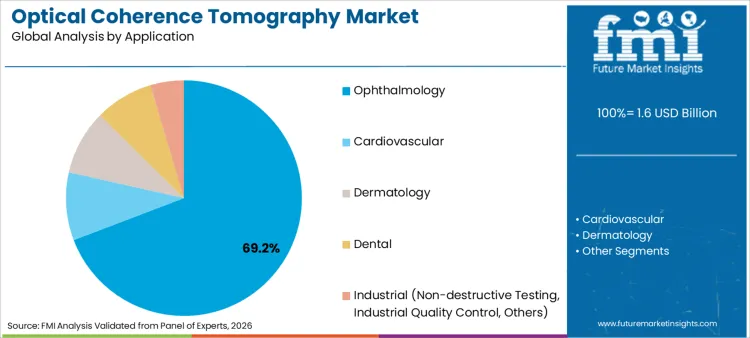
- Ophthalmology is projected to account for 21.0% of the application segment in 2026. Retina and glaucoma workflows require OCT scans to guide diagnosis and follow-up decisions.
- Cardiology use is expanding through intravascular imaging in advanced intervention settings. Ophthalmology is the main use base as eye clinics rely on routine retinal layer assessment.
Insights into Optical Coherence Tomography Market by End Use
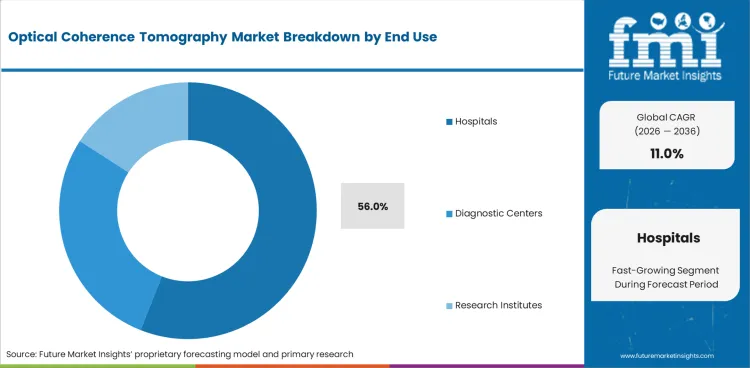
- Hospitals are forecast to hold 56.0% share of the end use segment in 2026. Specialist departments need stable OCT systems for retinal imaging and coronary assessment workflows.
- Diagnostic centers support scan access for referral-based patients and routine eye checks. Research institutes use OCT platforms for tissue imaging studies and clinical investigation work.
Insights into Optical Coherence Tomography Market by Technology
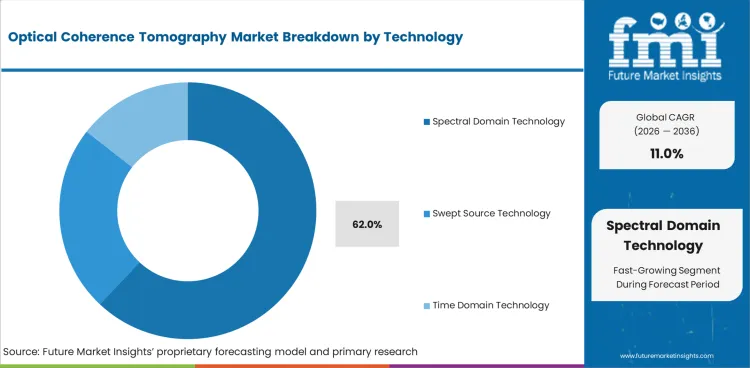
- Spectral domain technology is forecast to account for 62.0% of the technology segment in 2026. Clinics favor this technology for balanced scan speed and retinal image clarity.
- Swept source technology serves deeper imaging needs across choroidal and selected vascular applications. Time domain systems is limited as newer platforms offer faster capture and better detail.
Insights into Optical Coherence Tomography Market by Modality
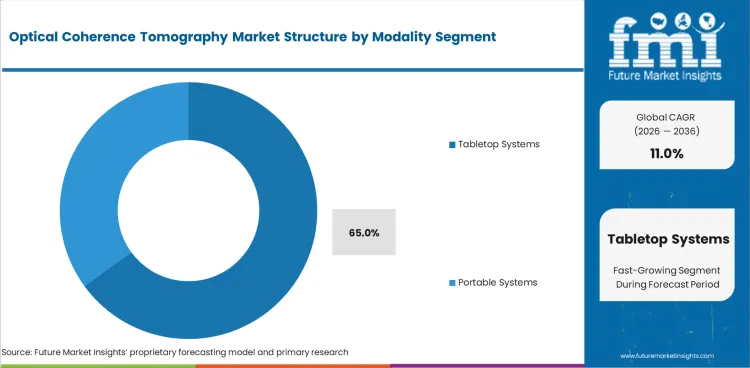
- Tabletop systems are projected to hold 65.0% share of the modality segment in 2026. Hospitals and specialty clinics prefer fixed systems for stable positioning and repeat scan accuracy.
- Portable OCT systems serve outreach programs and space-limited clinics needing easier movement. Tabletop formats continue to carry higher value through stronger workflow control and service integration.
Optical Coherence Tomography Market Drivers, Restraints, and Opportunities
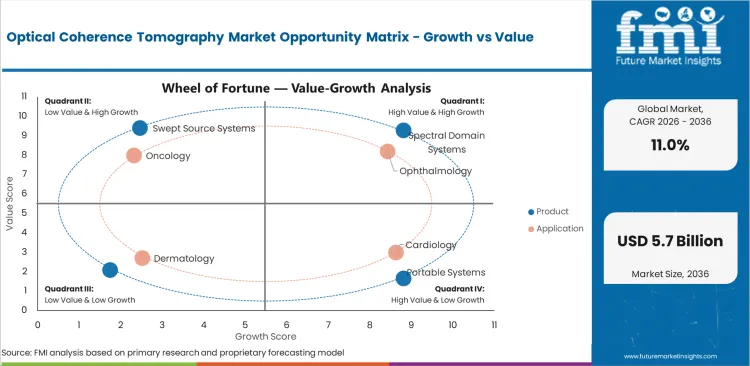
- Retinal follow-up pressure is creating demand for OCT scans across chronic eye disease care.
- The need for high-resolution hardware and trained operators increases pricing pressure for smaller clinics.
- AI-assisted image review improves service opportunity through faster reading and lower scan review burden.
Optical coherence tomography systems keep expanding as hospitals and eye clinics need clear retinal images and reliable scan records for repeat diagnosis. High equipment cost and skilled operator needs can slow wider use across smaller clinics. Demand continues through spectral domain systems and ophthalmology applications.
Reimbursement Differentials Are Repricing OCT Value
OCT pricing is becoming more tied to scan-level reimbursement rationale as compared to equipment features alone. In January 2025, the American Academy of Ophthalmology listed CPT 92134 for retinal OCT at 0.97 RVU and USD 31.38, while the newer CPT 92137 for retinal OCTA carried 1.76 RVU and USD 56.93. This spread gives vendors a stronger basis to defend premium pricing for OCTA-capable platforms, but it also pressures standard OCT systems where practices calculate payback per reimbursed scan. For buyers the commercial question is no longer only device cost. It now relies on whether higher spec imaging can convert into billable workflow and support faster utilization. It should reduce dependence on discounts over time across operating cycles for providers.
AI-Enabled Throughput Is Shifting Price Premiums
OCT price movement is also being shaped by software productivity claims, especially as vendors reposition advanced imaging around faster acquisition and clinic throughput. In December 2025, the National Eye Institute reported that NIH researchers reduced by three-fourths the data required for advanced ocular imaging, and noted that adaptive optics can be combined with OCT for cellular-level retinal assessment. Current adaptive optics with OCT can require hundreds of images and create practical limits in busy clinics. This trend supports a shift in pricing toward software enabled upgrades and service contracts. It encourages adoption of AI assisted tools that reduce scan time and technician burden.
Analysis of Optical Coherence Tomography Market By Key Countries
.webp "Top Country Growth Comparison Optical Coherence Tomography Market Cagr (2026 2036)")
| Country | CAGR |
|---|---|
| China | 15.0% |
| India | 13.9% |
| Germany | 12.8% |
| Brazil | 11.7% |
| USA | 10.6% |
| UK | 9.4% |
| Japan | 8.3% |
Source: Future Market Insights, 2026.
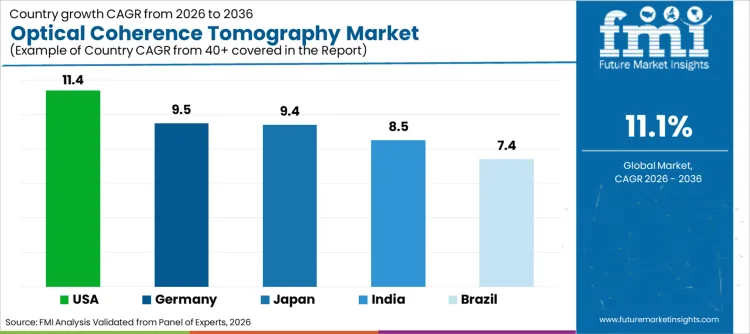
Optical Coherence Tomography Market CAGR Analysis By Country
- China is projected to advance at a 15.0% CAGR, supported by hospital imaging expansion and rising diabetes screening requirements.
- India’s OCT demand is forecast to grow at a 13.9% CAGR as eye care networks widen access to retinal imaging.
- Germany is estimated at a 12.8% CAGR, supported by specialist clinic refresh cycles and sustained use of advanced ophthalmology equipment.
- Brazil is expected to expand at an 11.7% CAGR, with urban hospital demand and private diagnostic capacity strengthening procurement.
- Mature replacement activity in the USA is shifting toward AI-ready imaging platforms, supporting a 10.6% CAGR.
- Public eye care pathways shape OCT purchasing in the UK, where a 9.4% CAGR reflects careful equipment budgeting.
- Japan is projected at an 8.3% CAGR, as mature clinic coverage slows new system placement despite steady replacement needs.
Demand for optical coherence tomography is forecast to rise at 11.0% CAGR from 2026 to 2036. Country-level analysis covers the major markets contributing to this forecast, with the key markets listed below.
Demand Outlook for Optical Coherence Tomography Market in China
China’s optical coherence tomography industry is projected to record a CAGR of 15.0% through 2036. IDF listed 147,981,200 adult diabetes cases in China in 2024. This patient base strengthens demand for China optical coherence tomography systems across retina screening and hospital eye care. Local device access and hospital expansion can improve scan availability beyond top-tier cities.
- Public hospitals need high-throughput systems for diabetic retinopathy and glaucoma review.
- Local imaging teams require service access and training across provincial hospital networks.
- Autonomous AI powered ophthalmology screening can strengthen referral pathways for OCT confirmation.
Sales Analysis of Optical Coherence Tomography Market in India
The optical coherence tomography sector in India is expected to expand at a CAGR of 13.9% during the assessment period. IDF estimated 89,826,900 adult diabetes cases in India in 2024. This clinical base drives demand for India optical coherence tomography systems in eye hospitals and diagnostic centers. Service coverage and price discipline is important as clinics expand outside major metro areas.
- Chain eye hospitals need spectral domain systems with fast scan capture and simple operator training.
- Outreach screening creates referral volume for OCT confirmation in secondary eye care centers.
- Vision screener use can increase earlier referral into retinal imaging pathways.
Opportunity Analysis of Optical Coherence Tomography Market in Germany
The optical coherence tomography segment in Germany is poised to advance at 12.8% CAGR over the forecast years. IDF Atlas estimated 6.5 million adults aged 20 to 79 with diabetes in Germany in 2024. This patient base sustains demand for Germany optical coherence tomography systems in specialist ophthalmology. Replacement demand is strongest for platforms with reliable image comparison and service continuity.
- Specialist clinics value software depth for macula and optic nerve follow-up.
- Stable reimbursement systems keep premium retinal imaging practical for established providers.
- Glaucoma treatment care reinforces optic nerve imaging across repeat patient visits.
Demand Analysis of Optical Coherence Tomography Market in Brazil
Brazil’s optical coherence tomography industry is forecast to grow at a CAGR of 11.7% through 2036. IDF listed 16,621,400 adult diabetes cases in Brazil in 2024. This burden supports demand for Brazil optical coherence tomography systems in urban hospitals and private diagnostic centers. Distribution strength is important as service distance affects system uptime across large regions.
- Urban eye care networks need OCT systems for retina and glaucoma review.
- Private hospitals compare equipment uptime and software features during system selection.
- Ophthalmic eye drops use keeps chronic eye care channels active.
Demand Outlook for Optical Coherence Tomography Market in the United States
The USA optical coherence tomography industry is forecast to grow at a CAGR of 10.6% by 2036. Mature eye care networks raise demand for replacement systems with faster scan capture and better data security. Retina groups value OCT platforms able to connect with image review workflows. AI-ready updates can improve value in high-volume practices.
- FDA-cleared robotic OCTA features can raise expectations for automated capture in premium sites.
- Retina specialists need dependable scan histories for disease and therapy review.
- Ophthalmic injectable therapy use keeps repeat retinal imaging tied to treatment pathways.
Future Outlook for Optical Coherence Tomography Market in the United Kingdom
The UK optical coherence tomography industry is expected to post 9.4% CAGR through 2036. GOV.UK reported GP-recorded type 2 diabetes prevalence at 7.0% among adults aged 17 and over in England at March 2024. This favors demand for UK optical coherence tomography systems as eye services plan imaging capacity carefully. Suppliers with lower service burden can fit public and private providers.
- Public eye care pathways need reliable scans to reduce repeat appointments.
- Private clinics use OCT for glaucoma monitoring and retinal review.
- Vision care products activity keeps consumer and clinical eye care channels connected.
In-depth Analysis of Optical Coherence Tomography Market in Japan
Japan’s optical coherence tomography industry is expected to record 8.3% CAGR through 2036. IDF listed 8,970,500 adult diabetes cases in Japan in 2024. This patient pool sustains Japan optical coherence tomography demand across established ophthalmology clinics. System replacement is driven by image quality, calibration reliability and long-term service assurance.
- Mature clinics prioritize repeatable scan output over fast switching between system brands.
- Swept source systems gain selective use in choroidal imaging and premium retina care.
- Ophthalmic tonometers use keeps glaucoma diagnostics close to OCT workflows.
Competitive Landscape and Strategic Positioning
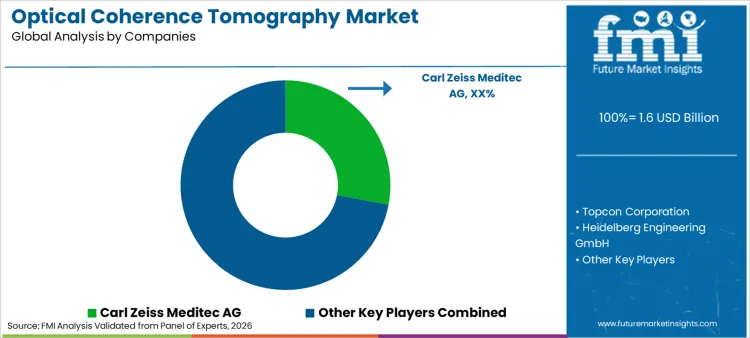
- Carl Zeiss Meditec AG holds a strong position in CIRRUS platforms and retinal workflow tools.
- Topcon Corporation and Heidelberg Engineering GmbH compete on robotic capture and specialist ophthalmology imaging systems.
- Abbott extends OCT competition beyond eye care through coronary imaging software used in interventional cardiology settings.
Competition in the optical coherence tomography market is centered on scan quality and clinical workflow value. Leading companies compete by combining reliable imaging hardware with software tools used in daily diagnostic review. Carl Zeiss Meditec benefits from CIRRUS system depth and retina care workflow strength. Topcon Corporation builds differentiation through Maestro2 robotic capture and OCTA clearance. Heidelberg Engineering focuses on specialist ophthalmology imaging for clinics needing detailed retinal assessment. Abbott adds a separate clinical path through Ultreon software for coronary vessel imaging.
High system cost and service needs create entry barriers across regulated clinical environments. Scan speed, image review tools and service access are becoming core competitive priorities. Companies with proven imaging platforms and dependable software capabilities are best placed to win hospital accounts. Firms with broad service coverage can secure stronger positions across multi-site ophthalmology networks.
Key Companies in the Optical Coherence Tomography Market
Key global companies leading the optical coherence tomography market include:
- Carl Zeiss Meditec AG, Topcon Corporation and Heidelberg Engineering GmbH have strong retinal imaging infrastructure for ophthalmology workflow depth.
- Abbott and NIDEK Co. Ltd. serve clinical users through coronary imaging software and eye care equipment coverage.
- Santec Corporation and Visionix hold specialist positions across swept source systems, compact imaging and regional distribution.
Competitive Benchmarking: Optical Coherence Tomography Market
| Company | Retinal Workflow Depth | OCT Software Strength | Service Network Reach | Geographic Footprint |
|---|---|---|---|---|
| Carl Zeiss Meditec AG | High | High | Strong | Global presence across North America, Europe, China, Japan, and India |
| Topcon Corporation | High | High | Strong | Global presence across Japan, North America, Europe, China, and South Asia |
| Heidelberg Engineering GmbH | High | High | Moderate | Strong presence in Europe and North America, with selective Asia-Pacific reach |
| Abbott | Medium | High | Strong | Global presence across North America, Europe, Asia-Pacific, and major cardiovascular care markets |
| NIDEK Co. Ltd. | High | Medium | Strong | Global presence across Japan, Asia-Pacific, North America, Europe, and Latin America |
| Santec Corporation | Medium | High | Moderate | Japan-led footprint with reach across Asia-Pacific, North America, and Europe |
| Visionix | Medium | Medium | Moderate | Stronger presence in North America and Europe, with selective Middle East and Asia-Pacific distribution |
Source: Future Market Insights, 2026.
Key Developments in Optical Coherence Tomography Market
- In April, 2026, Abbott received FDA clearance and CE Mark for Ultreon™ 3.0, its next-generation AI-powered coronary imaging platform using optical coherence tomography. The platform adds one-second OCT pullback and real-time PCI planning guidance for coronary artery procedures.
- In May, 2024, ZEISS announced OCT technology enhancements for CIRRUS® 6000, including an expanded USA OCT reference database and new cybersecurity features. The update strengthens data-driven ophthalmic workflows across diagnosis, treatment planning, and ongoing disease management.
Key Players in the Optical Coherence Tomography Market
Major Global Players:
- Carl Zeiss Meditec AG
- Topcon Corporation
- Heidelberg Engineering GmbH
- Abbott
- NIDEK Co. Ltd.
Specialist Players:
- Santec Corporation
- Visionix
Report Scope and Coverage
| Parameter | Details |
|---|---|
| Quantitative Units | USD 2.0 billion to USD 5.7 billion, at a CAGR of 11.0% |
| Market Definition | The optical coherence tomography market encompasses imaging systems used to assess tissue structures through light-based cross-sectional imaging. |
| Regions Covered | North America, Latin America, Europe, East Asia, South Asia and Pacific, Middle East and Africa |
| Countries Covered | USA, UK, Germany, China, India, Japan, Brazil, and 30 plus countries |
| Key Companies Profiled | Carl Zeiss Meditec AG, Topcon Corporation, Heidelberg Engineering GmbH, Abbott, NIDEK Co. Ltd., Santec Corporation, Visionix |
| Forecast Period | 2026 to 2036 |
| Approach | Hybrid bottom-up and top-down methodology starting with system demand and verified clinical use patterns. |
Optical Coherence Tomography Market by Segments
Optical Coherence Tomography Market Segmented by Product:
- Spectral Domain Systems
- Portable Systems
- Swept Source Systems
- Time Domain Systems
Optical Coherence Tomography Market Segmented by Application:
- Ophthalmology
- Cardiology
- Oncology
- Dermatology
Optical Coherence Tomography Market Segmented by End Use:
- Hospitals
- Diagnostic Centers
- Research Institutes
Optical Coherence Tomography Market Segmented by Technology:
- Spectral Domain Technology
- Swept Source Technology
- Time Domain Technology
Optical Coherence Tomography Market Segmented by Modality:
- Tabletop Systems
- Portable Systems
Optical Coherence Tomography Market by Region:
- North America
- USA
- Canada
- Mexico
- Latin America
- Brazil
- Chile
- Rest of Latin America
- Europe
- Germany
- UK
- Italy
- Spain
- France
- Rest of Europe
- East Asia
- China
- Japan
- South Korea
- South Asia and Pacific
- India
- ASEAN
- Australia & New Zealand
- Rest of South Asia and Pacific
- Middle East and Africa
- Saudi Arabia
- Other GCC Countries
- South Africa
- Rest of Middle East and Africa
Research Sources and Bibliography
- Abbott. (2026, April). Abbott receives FDA clearance and CE Mark for next-generation Ultreon 3.0 AI-powered coronary imaging platform.
- American Academy of Ophthalmology. (2024, September). Optical coherence tomography patient information.
- Carl Zeiss Meditec AG. (2024, May). ZEISS announces OCT technology enhancements.
- Centers for Disease Control and Prevention. (2024, May). Prevalence of diabetic retinopathy.
- GOV.UK. (2025, March). Diabetes profile statistical commentary.
- International Diabetes Federation. (2025, April). Diabetes facts and figures.
- International Diabetes Federation. (2026). Diabetes in China.
- International Diabetes Federation. (2026). Diabetes in India.
- International Diabetes Federation. (2026). Diabetes in Germany.
- International Diabetes Federation. (2026). Diabetes in Brazil.
- International Diabetes Federation. (2026). Diabetes in Japan.
- Topcon Healthcare. (2024, September). FDA 510(k) clearance for robotic OCT angiography on Maestro2.
- Carl Zeiss Meditec AG. (2024, May 30). ZEISS announces OCT technology enhancements to better support growing era of data-driven patient care.
- Abbott. (2026, April 28). Abbott receives FDA clearance and CE Mark for next-generation Ultreon™ 3.0 AI-powered coronary imaging platform.
This Report Answers
- What is the current and future size of the optical coherence tomography market?
- How fast is the optical coherence tomography market expected to expand between 2026 and 2036?
- Which product segment is expected to lead the market by 2026?
- Which application segment is expected to account for the highest demand by 2026?
- What factors are driving demand for optical coherence tomography globally?
- How are retinal monitoring needs influencing OCT system adoption?
- Why are hospitals the main demand base for OCT systems?
- How are AI and robotic capture creating demand for advanced OCT platforms?
- Which countries are projected to record faster expansion through 2036?
- What is driving market expansion in China and India?
- Who are the key companies active in the optical coherence tomography market?
- How does FMI estimate and validate the market forecast?
Frequently Asked Questions
What is the global market demand for Optical Coherence Tomography in 2026?
In 2026, the global market for optical coherence tomography is expected to be worth USD 2.0 billion.
How big will the market for Optical Coherence Tomography be in 2036?
By 2036, the market for optical coherence tomography is expected to be worth USD 5.7 billion.
How much is demand for Optical Coherence Tomography expected to expand between 2026 and 2036?
Between 2026 and 2036, demand for optical coherence tomography is expected to expand at a CAGR of 11.0%.
Which modality segment is likely to be the best seller globally by 2026?
Table-top Systems will contribute 65.0% of the modality segment in 2026.
What is causing demand to rise in China?
The China optical coherence tomography market is projected to record 15.0% CAGR through 2036, driven by hospital imaging capacity and diabetes screening needs.
What is causing demand to rise in India?
The India optical coherence tomography market is projected to expand at 13.9% CAGR through 2036, driven by eye care network development and retinal imaging access.
What does this report mean by Optical Coherence Tomography Market definition?
The optical coherence tomography market includes imaging systems used to assess tissue structures through light-based cross-sectional imaging.
How does FMI make the optical coherence tomography forecast and check it?
Forecasting models use a hybrid bottom-up and top-down approach, starting with system demand and checking it against clinical use patterns.
Table of Content
- Executive Summary
- Global Market Outlook
- Demand-side Trends
- Supply-side Trends
- Technology Roadmap Analysis
- Analysis and Recommendations
- Market Overview
- Market Coverage / Taxonomy
- Market Definition / Scope / Limitations
- Research Methodology
- Chapter Orientation
- Analytical Lens and Working Hypotheses
- Market Structure, Signals, and Trend Drivers
- Benchmarking and Cross-market Comparability
- Market Sizing, Forecasting, and Opportunity Mapping
- Research Design and Evidence Framework
- Desk Research Programme (Secondary Evidence)
- Company Annual and Sustainability Reports
- Peer-reviewed Journals and Academic Literature
- Corporate Websites, Product Literature, and Technical Notes
- Earnings Decks and Investor Briefings
- Statutory Filings and Regulatory Disclosures
- Technical White Papers and Standards Notes
- Trade Journals, Industry Magazines, and Analyst Briefs
- Conference Proceedings, Webinars, and Seminar Materials
- Government Statistics Portals and Public Data Releases
- Press Releases and Reputable Media Coverage
- Specialist Newsletters and Curated Briefings
- Sector Databases and Reference Repositories
- FMI Internal Proprietary Databases and Historical Market Datasets
- Subscription Datasets and Paid Sources
- Social Channels, Communities, and Digital Listening Inputs
- Additional Desk Sources
- Expert Input and Fieldwork (Primary Evidence)
- Primary Modes
- Qualitative Interviews and Expert Elicitation
- Quantitative Surveys and Structured Data Capture
- Blended Approach
- Why Primary Evidence is Used
- Field Techniques
- Interviews
- Surveys
- Focus Groups
- Observational and In-context Research
- Social and Community Interactions
- Stakeholder Universe Engaged
- C-suite Leaders
- Board Members
- Presidents and Vice Presidents
- R&D and Innovation Heads
- Technical Specialists
- Domain Subject-matter Experts
- Scientists
- Physicians and Other Healthcare Professionals
- Governance, Ethics, and Data Stewardship
- Research Ethics
- Data Integrity and Handling
- Primary Modes
- Tooling, Models, and Reference Databases
- Desk Research Programme (Secondary Evidence)
- Data Engineering and Model Build
- Data Acquisition and Ingestion
- Cleaning, Normalisation, and Verification
- Synthesis, Triangulation, and Analysis
- Quality Assurance and Audit Trail
- Market Background
- Market Dynamics
- Drivers
- Restraints
- Opportunity
- Trends
- Scenario Forecast
- Demand in Optimistic Scenario
- Demand in Likely Scenario
- Demand in Conservative Scenario
- Opportunity Map Analysis
- Product Life Cycle Analysis
- Supply Chain Analysis
- Investment Feasibility Matrix
- Value Chain Analysis
- PESTLE and Porter’s Analysis
- Regulatory Landscape
- Regional Parent Market Outlook
- Production and Consumption Statistics
- Import and Export Statistics
- Market Dynamics
- Global Market Analysis 2021 to 2025 and Forecast, 2026 to 2036
- Historical Market Size Value (USD Million) Analysis, 2021 to 2025
- Current and Future Market Size Value (USD Million) Projections, 2026 to 2036
- Y-o-Y Growth Trend Analysis
- Absolute $ Opportunity Analysis
- Global Market Pricing Analysis 2021 to 2025 and Forecast 2026 to 2036
- Global Market Analysis 2021 to 2025 and Forecast 2026 to 2036, By Product
- Introduction / Key Findings
- Historical Market Size Value (USD Million) Analysis By Product , 2021 to 2025
- Current and Future Market Size Value (USD Million) Analysis and Forecast By Product , 2026 to 2036
- Spectral Domain Systems
- Portable Systems
- Swept Source Systems
- Time Domain Systems
- Spectral Domain Systems
- Y-o-Y Growth Trend Analysis By Product , 2021 to 2025
- Absolute $ Opportunity Analysis By Product , 2026 to 2036
- Global Market Analysis 2021 to 2025 and Forecast 2026 to 2036, By Application
- Introduction / Key Findings
- Historical Market Size Value (USD Million) Analysis By Application, 2021 to 2025
- Current and Future Market Size Value (USD Million) Analysis and Forecast By Application, 2026 to 2036
- Ophthalmology
- Cardiology
- Oncology
- Dermatology
- Ophthalmology
- Y-o-Y Growth Trend Analysis By Application, 2021 to 2025
- Absolute $ Opportunity Analysis By Application, 2026 to 2036
- Global Market Analysis 2021 to 2025 and Forecast 2026 to 2036, By End Use
- Introduction / Key Findings
- Historical Market Size Value (USD Million) Analysis By End Use, 2021 to 2025
- Current and Future Market Size Value (USD Million) Analysis and Forecast By End Use, 2026 to 2036
- Hospitals
- Diagnostic Centers
- Research Institutes
- Hospitals
- Y-o-Y Growth Trend Analysis By End Use, 2021 to 2025
- Absolute $ Opportunity Analysis By End Use, 2026 to 2036
- Global Market Analysis 2021 to 2025 and Forecast 2026 to 2036, By Technology
- Introduction / Key Findings
- Historical Market Size Value (USD Million) Analysis By Technology, 2021 to 2025
- Current and Future Market Size Value (USD Million) Analysis and Forecast By Technology, 2026 to 2036
- Spectral Domain Technology
- Swept Source Technology
- Time Domain Technology
- Spectral Domain Technology
- Y-o-Y Growth Trend Analysis By Technology, 2021 to 2025
- Absolute $ Opportunity Analysis By Technology, 2026 to 2036
- Global Market Analysis 2021 to 2025 and Forecast 2026 to 2036, By Modality
- Introduction / Key Findings
- Historical Market Size Value (USD Million) Analysis By Modality, 2021 to 2025
- Current and Future Market Size Value (USD Million) Analysis and Forecast By Modality, 2026 to 2036
- Tabletop Systems
- Portable Systems
- Tabletop Systems
- Y-o-Y Growth Trend Analysis By Modality, 2021 to 2025
- Absolute $ Opportunity Analysis By Modality, 2026 to 2036
- Global Market Analysis 2021 to 2025 and Forecast 2026 to 2036, By Region
- Introduction
- Historical Market Size Value (USD Million) Analysis By Region, 2021 to 2025
- Current Market Size Value (USD Million) Analysis and Forecast By Region, 2026 to 2036
- North America
- Latin America
- Western Europe
- Eastern Europe
- East Asia
- South Asia and Pacific
- Middle East & Africa
- Market Attractiveness Analysis By Region
- North America Market Analysis 2021 to 2025 and Forecast 2026 to 2036, By Country
- Historical Market Size Value (USD Million) Trend Analysis By Market Taxonomy, 2021 to 2025
- Market Size Value (USD Million) Forecast By Market Taxonomy, 2026 to 2036
- By Country
- USA
- Canada
- Mexico
- By Product
- By Application
- By End Use
- By Technology
- By Modality
- By Country
- Market Attractiveness Analysis
- By Country
- By Product
- By Application
- By End Use
- By Technology
- By Modality
- Key Takeaways
- Latin America Market Analysis 2021 to 2025 and Forecast 2026 to 2036, By Country
- Historical Market Size Value (USD Million) Trend Analysis By Market Taxonomy, 2021 to 2025
- Market Size Value (USD Million) Forecast By Market Taxonomy, 2026 to 2036
- By Country
- Brazil
- Chile
- Rest of Latin America
- By Product
- By Application
- By End Use
- By Technology
- By Modality
- By Country
- Market Attractiveness Analysis
- By Country
- By Product
- By Application
- By End Use
- By Technology
- By Modality
- Key Takeaways
- Western Europe Market Analysis 2021 to 2025 and Forecast 2026 to 2036, By Country
- Historical Market Size Value (USD Million) Trend Analysis By Market Taxonomy, 2021 to 2025
- Market Size Value (USD Million) Forecast By Market Taxonomy, 2026 to 2036
- By Country
- Germany
- UK
- Italy
- Spain
- France
- Nordic
- BENELUX
- Rest of Western Europe
- By Product
- By Application
- By End Use
- By Technology
- By Modality
- By Country
- Market Attractiveness Analysis
- By Country
- By Product
- By Application
- By End Use
- By Technology
- By Modality
- Key Takeaways
- Eastern Europe Market Analysis 2021 to 2025 and Forecast 2026 to 2036, By Country
- Historical Market Size Value (USD Million) Trend Analysis By Market Taxonomy, 2021 to 2025
- Market Size Value (USD Million) Forecast By Market Taxonomy, 2026 to 2036
- By Country
- Russia
- Poland
- Hungary
- Balkan & Baltic
- Rest of Eastern Europe
- By Product
- By Application
- By End Use
- By Technology
- By Modality
- By Country
- Market Attractiveness Analysis
- By Country
- By Product
- By Application
- By End Use
- By Technology
- By Modality
- Key Takeaways
- East Asia Market Analysis 2021 to 2025 and Forecast 2026 to 2036, By Country
- Historical Market Size Value (USD Million) Trend Analysis By Market Taxonomy, 2021 to 2025
- Market Size Value (USD Million) Forecast By Market Taxonomy, 2026 to 2036
- By Country
- China
- Japan
- South Korea
- By Product
- By Application
- By End Use
- By Technology
- By Modality
- By Country
- Market Attractiveness Analysis
- By Country
- By Product
- By Application
- By End Use
- By Technology
- By Modality
- Key Takeaways
- South Asia and Pacific Market Analysis 2021 to 2025 and Forecast 2026 to 2036, By Country
- Historical Market Size Value (USD Million) Trend Analysis By Market Taxonomy, 2021 to 2025
- Market Size Value (USD Million) Forecast By Market Taxonomy, 2026 to 2036
- By Country
- India
- ASEAN
- Australia & New Zealand
- Rest of South Asia and Pacific
- By Product
- By Application
- By End Use
- By Technology
- By Modality
- By Country
- Market Attractiveness Analysis
- By Country
- By Product
- By Application
- By End Use
- By Technology
- By Modality
- Key Takeaways
- Middle East & Africa Market Analysis 2021 to 2025 and Forecast 2026 to 2036, By Country
- Historical Market Size Value (USD Million) Trend Analysis By Market Taxonomy, 2021 to 2025
- Market Size Value (USD Million) Forecast By Market Taxonomy, 2026 to 2036
- By Country
- Kingdom of Saudi Arabia
- Other GCC Countries
- Turkiye
- South Africa
- Other African Union
- Rest of Middle East & Africa
- By Product
- By Application
- By End Use
- By Technology
- By Modality
- By Country
- Market Attractiveness Analysis
- By Country
- By Product
- By Application
- By End Use
- By Technology
- By Modality
- Key Takeaways
- Key Countries Market Analysis
- USA
- Pricing Analysis
- Market Share Analysis, 2025
- By Product
- By Application
- By End Use
- By Technology
- By Modality
- Canada
- Pricing Analysis
- Market Share Analysis, 2025
- By Product
- By Application
- By End Use
- By Technology
- By Modality
- Mexico
- Pricing Analysis
- Market Share Analysis, 2025
- By Product
- By Application
- By End Use
- By Technology
- By Modality
- Brazil
- Pricing Analysis
- Market Share Analysis, 2025
- By Product
- By Application
- By End Use
- By Technology
- By Modality
- Chile
- Pricing Analysis
- Market Share Analysis, 2025
- By Product
- By Application
- By End Use
- By Technology
- By Modality
- Germany
- Pricing Analysis
- Market Share Analysis, 2025
- By Product
- By Application
- By End Use
- By Technology
- By Modality
- UK
- Pricing Analysis
- Market Share Analysis, 2025
- By Product
- By Application
- By End Use
- By Technology
- By Modality
- Italy
- Pricing Analysis
- Market Share Analysis, 2025
- By Product
- By Application
- By End Use
- By Technology
- By Modality
- Spain
- Pricing Analysis
- Market Share Analysis, 2025
- By Product
- By Application
- By End Use
- By Technology
- By Modality
- France
- Pricing Analysis
- Market Share Analysis, 2025
- By Product
- By Application
- By End Use
- By Technology
- By Modality
- India
- Pricing Analysis
- Market Share Analysis, 2025
- By Product
- By Application
- By End Use
- By Technology
- By Modality
- ASEAN
- Pricing Analysis
- Market Share Analysis, 2025
- By Product
- By Application
- By End Use
- By Technology
- By Modality
- Australia & New Zealand
- Pricing Analysis
- Market Share Analysis, 2025
- By Product
- By Application
- By End Use
- By Technology
- By Modality
- China
- Pricing Analysis
- Market Share Analysis, 2025
- By Product
- By Application
- By End Use
- By Technology
- By Modality
- Japan
- Pricing Analysis
- Market Share Analysis, 2025
- By Product
- By Application
- By End Use
- By Technology
- By Modality
- South Korea
- Pricing Analysis
- Market Share Analysis, 2025
- By Product
- By Application
- By End Use
- By Technology
- By Modality
- Russia
- Pricing Analysis
- Market Share Analysis, 2025
- By Product
- By Application
- By End Use
- By Technology
- By Modality
- Poland
- Pricing Analysis
- Market Share Analysis, 2025
- By Product
- By Application
- By End Use
- By Technology
- By Modality
- Hungary
- Pricing Analysis
- Market Share Analysis, 2025
- By Product
- By Application
- By End Use
- By Technology
- By Modality
- Kingdom of Saudi Arabia
- Pricing Analysis
- Market Share Analysis, 2025
- By Product
- By Application
- By End Use
- By Technology
- By Modality
- Turkiye
- Pricing Analysis
- Market Share Analysis, 2025
- By Product
- By Application
- By End Use
- By Technology
- By Modality
- South Africa
- Pricing Analysis
- Market Share Analysis, 2025
- By Product
- By Application
- By End Use
- By Technology
- By Modality
- USA
- Market Structure Analysis
- Competition Dashboard
- Competition Benchmarking
- Market Share Analysis of Top Players
- By Regional
- By Product
- By Application
- By End Use
- By Technology
- By Modality
- Competition Analysis
- Competition Deep Dive
- Carl Zeiss Meditec AG
- Overview
- Product Portfolio
- Profitability by Market Segments (Product/Age /Sales Channel/Region)
- Sales Footprint
- Strategy Overview
- Marketing Strategy
- Product Strategy
- Channel Strategy
- Topcon Corporation
- Heidelberg Engineering GmbH
- Abbott
- NIDEK Co. Ltd.
- Santec Corporation
- Visionix
- Carl Zeiss Meditec AG
- Competition Deep Dive
- Assumptions & Acronyms Used


