Methodology

Optical Fiber Cold Joint Market Forecast and Outlook 2025 to 2035

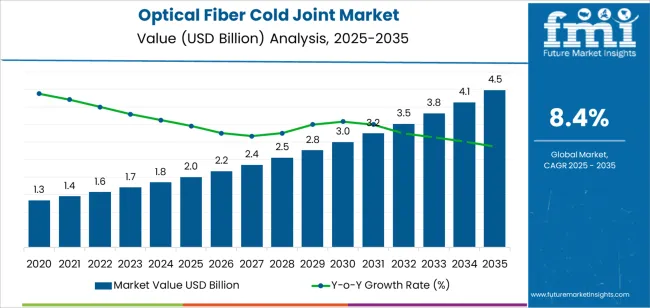
The optical fiber cold joint market expands from USD 2.0 billion in 2025 to USD 4.3 billion by 2035 at a CAGR of 8.4%, shaped primarily by segment-level demand patterns that determine installation scale, application fit, and network performance expectations. The single-core fast connector segment leads with 29.0% share, driven by its alignment with high-volume access-network requirements across FTTH, last-mile drops, and widespread maintenance activity. These units offer predictable insertion-loss performance, straightforward V-groove alignment, and rapid field assembly, making them the primary choice for telecom crews deploying subscriber lines, performing repairs, or enabling quick service activation without fusion splicing equipment. Multi-core fast connectors form the next key segment as dense fiber architectures grow in data-center interconnects, metro rings, and industrial networks requiring multi-fiber termination with reduced installation time and consistent optical behavior across cores.

Application segmentation is dominated by telecom operations at 63.0%, reflecting heavy reliance on cold joints for distribution frames, cabinets, pole-mounted terminals, and drop-fiber routing. Telecom workflows demand connectors that minimize installation time, withstand outdoor environmental stressors, and maintain consistent insertion loss during widespread network buildout and restoration. Data centers are a fast-growing segment as operators adopt cold joints for modular cabinet interconnects, flexible routing, and rapid reconfiguration. Industrial automation, broadcasting, and military-grade communication applications require ruggedized joints with enhanced sealing, pull strength, and thermal stability.
Quick Stats for Optical Fiber Cold Joint Market

  • Optical Fiber Cold Joint Market Value (2025): USD 2.0 billion
  • Optical Fiber Cold Joint Market Forecast Value (2035): USD 4.3 billion
  • Optical Fiber Cold Joint Market Forecast CAGR: 8.4%
  • Leading Type in Optical Fiber Cold Joint Market: Single-Core Fast Connector (29.0%)
  • Key Growth Regions in Optical Fiber Cold Joint Market: China, India, Germany
  • Top Players in Optical Fiber Cold Joint Market: 3M, Corning, Fujikura, Sumitomo, Combo, Jiangsu UNIKIT, Dongguan Qinying, Shenzhen JFOPT, Sopto, Shenzhen Tengtian, OUFU Optical Fiber, Ningbo Goshining Communication Technology

Optical Fiber Cold Joint Market Market Value Analysis

Optical Fiber Cold Joint Market Growth Momentum Analysis 2025 to 2035

Asia Pacific leads global deployment, supported by large-scale broadband expansion programs and extensive fiber rollout across urban and rural corridors. North America and Europe maintain stable growth driven by data-center interconnection needs, fiber upgrades in transport networks, and ongoing modernization of legacy copper infrastructure. Through 2035, improved mechanical-splice precision, enhanced environmental sealing, and wider compatibility with high-bandwidth transmission standards are expected to sustain long-term market momentum.

Between 2025 and 2030, the Optical Fiber Cold Joint Market expands from USD 2.0 billion to USD 2.9 billion, reflecting strong momentum driven by rapid fiber-to-the-home (FTTH) penetration, increased 5G backhaul construction, and higher deployment of passive optical networks. Annual demand rises from approximately 2.1 billion to 2.9 billion cold-joint units, supported by large-scale rollouts in Asia-Pacific, Europe, and North America. Growth is reinforced by the shift toward low-loss, tool-free splice connectors that reduce installation time by 25-35 % compared with thermal fusion splicing. Network operators increasingly use cold joints in aerial, underground, and micro-duct installations, especially in last-mile extensions where speed, repeatability, and field reliability are critical.

From 2030 to 2035, the market increases from USD 2.9 billion to USD 4.3 billion, with unit deployment rising toward 3.9-4.3 billion units. Momentum accelerates as large telecom carriers transition to high-density fiber architectures to support data center interconnects, IoT backbones, and 8K streaming bandwidth requirements. Demand is further driven by cold-joint designs offering insertion loss below 0.3 dB, improved thermal stability across -40 °C to 70 °C, and enhanced pull-strength thresholds above 20 N. Emerging markets in South Asia, Africa, and South America contribute 15-18 % of incremental volume as broadband penetration advances. Replacement activity also strengthens, with network operators upgrading legacy splice points to reduce maintenance overhead and support higher service reliability targets exceeding 99.99 %.

Optical Fiber Cold Joint Market Key Takeaways

Metric Value
Market Value (2025) USD 2.0 billion
Market Forecast Value (2035) USD 4.3 billion
Forecast CAGR (2025 to 2035) 8.4%

Why Is the Optical Fiber Cold Joint Market Growing Across Telecom and Industrial Network Deployments?

Demand for optical fiber cold joints is rising as network operators expand fiber-to-the-home, data center interconnects, and industrial communication systems. Cold joints allow field technicians to splice fibers without fusion splicing equipment, reducing setup time and eliminating the need for high-temperature arc welding. Their mechanical alignment sleeves and precision-cut grooves support stable optical performance with low insertion loss, making them suitable for rapid repairs and last-mile installations. Telecom contractors favor cold joints for projects involving distributed access networks, aerial fiber drops, and restoration work where portability and speed are essential. Manufacturers refine ferrule tolerances, sealing structures, and fiber-retention mechanisms to maintain consistent optical performance across varying environmental conditions. These improvements strengthen adoption in both developing and established fiber markets.

Market growth is also supported by increased deployment of 5G base stations, smart-grid communication lines, and industrial automation networks requiring reliable, low-maintenance fiber links. Cold joints provide a cost-effective alternative when fusion splicing is impractical due to space limits or low installation volumes. Producers enhance environmental resistance through moisture-blocking gels, UV-resistant housings, and impact-tolerant enclosures suited for outdoor cabinets and utility infrastructure. Training programs and standardized installation kits improve field accuracy, reducing splice variability across technician skill levels. Although cold joints generally deliver higher loss than fusion splices, ongoing material and alignment advancements narrow this gap. Their flexibility, low capital requirements, and fast deployment continue to support steady demand across global telecommunications, utility, and industrial fiber-optic installations.

How Do Connector Designs and Field Requirements Shape Segmentation in the Optical Fiber Cold Joint Market?

The optical fiber cold joint market is segmented by type, application, and region. By type, the market is divided into single-core fast connectors and multi-core fast connectors. Based on application, it is categorized into telecom operation, data centers, medical equipment, industrial automation, broadcasting and television, aerospace and military, and others. Regionally, the market is segmented into North America, Europe, East Asia, South Asia, Latin America, and the Middle East & Africa. These divisions reflect installation conditions, fiber-routing complexity, and regional investment in communication infrastructure.
What Factors Support the Leading Position of Single-Core Fast Connectors?

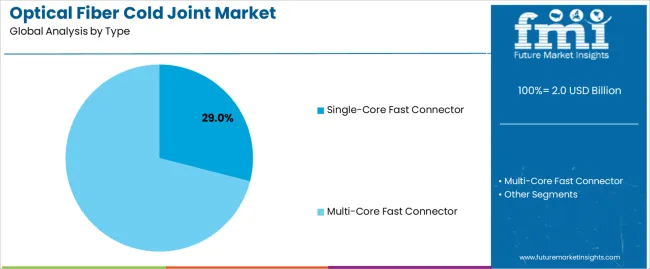
Optical Fiber Cold Joint Market Analysis By Type

The single-core fast connector segment accounts for approximately 29.0% of the global optical fiber cold joint market in 2025, making it the leading type category. This position is supported by its suitability for rapid field installation, straightforward alignment, and compatibility with common single-mode fiber used in access networks. These connectors reduce splice time and eliminate the need for fusion splicing equipment, making them practical for technicians working on distribution frames, drop cables, and short-run repair tasks. Their structure allows predictable insertion loss and stable return loss when installed with standard cleaving tools.

Manufacturers refine ferrule accuracy, V-groove alignment, and internal clamping components to maintain repeatable performance across a wide temperature range. The segment sees strong adoption in North America and East Asia, where fiber-to-the-home deployment continues at scale and where operators require swift installation cycles for both new connections and fault restoration. Single-core fast connectors also serve as temporary restoration tools during network maintenance. The segment maintains its lead because it supports routine field work, aligns with widely used fiber types in last-mile networks, and offers installation convenience for crews operating under time constraints without specialized splicing equipment.
Why Does Telecom Operation Represent the Largest Application Share in the Cold Joint Market?

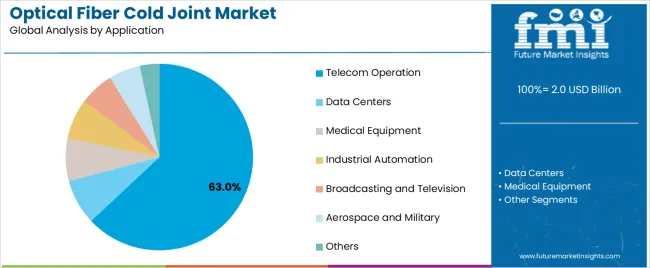
Optical Fiber Cold Joint Market Analysis By Application

The telecom operation segment represents about 63.0% of the total optical fiber cold joint market in 2025, making it the dominant application category. This reflects the heavy reliance of telecom networks on fast connector solutions for access links, distribution points, maintenance activities, and service expansion. Cold joints support routine tasks such as subscriber drop installation, splitter frame adjustments, cabinet reconfiguration, and rapid restoration after cable damage. Telecom operators prioritize connectors that deliver consistent optical performance with minimal preparation time, enabling efficient field workflows across varied outdoor and indoor environments.

Manufacturers design connectors with stable mechanical retention, improved dust protection, and tolerance to repeated handling during rework procedures. Telecom fleets deploy cold joints in large quantities, creating recurring demand as networks expand through fiber-to-the-home, fiber-to-the-building, and 5G backhaul projects. Regions such as East Asia and South Asia continue substantial fiber rollout programs, while North America and Europe maintain steady replacement and upgrade cycles. Telecom operation remains the largest application category because it requires high-volume, rapid-installation solutions that reduce downtime and support continuous expansion of optical access infrastructure across dense and dispersed service areas.

What are the Key Trends, Drivers, and Restraints in the Optical Fiber Cold Joint Market?

The optical fiber cold joint market is expanding as network operators seek faster, cleaner and more flexible connection methods for fiber deployment. Cold joints enable splicing without heat, reducing the need for fusion equipment and allowing field technicians to work efficiently in confined or sensitive environments. Growth is supported by rising FTTH rollouts, data-center connectivity needs and expanding industrial fiber installations. Adoption is moderated by concerns regarding long-term insertion loss stability and performance variability across different field conditions. Manufacturers are refining connector materials, alignment mechanisms and protective sleeves to improve durability and repeatability in diverse installation scenarios.

How is growing fiber deployment driving demand for cold joint solutions?

Demand rises as telecom operators, utility networks and enterprise campuses accelerate fiber installation. Cold joints help reduce deployment time, making them useful during rapid rollouts or small-patch connections where fusion splicing is impractical. Field engineers rely on cold joints for repairs and upgrades on active lines, where minimal disruption is essential. As FTTH penetration increases across urban and rural areas, cold joint kits support distributed teams who require portable, easy-to-use connection methods that maintain acceptable signal performance without specialized equipment.

What factors are limiting wider adoption of optical fiber cold joints?

Adoption is constrained by concerns over higher insertion loss and potential reliability issues compared with fusion splices. Performance can vary depending on technician skill, environmental conditions and fiber cleanliness. Some operators avoid cold joints in long-haul or high-bandwidth networks due to stricter signal-quality requirements. Cost considerations emerge when large volumes of connectors are required, especially in dense fiber environments. Additionally, organizations that prioritize long-term durability may prefer fusion splicing for critical backbone or data-center applications, limiting cold joint use to specific scenarios.

What trends are shaping development of next-generation cold joint technology?

Trends include improved alignment structures that reduce loss variability, more robust housing materials for outdoor and industrial use, and compact designs tailored for high-density patch environments. Tool-assisted cold-splice systems with guided alignment and contamination control are gaining traction to improve repeatability. Manufacturers are offering weather-resistant joints for aerial, underground and FTTx deployments. Growth in smart-city infrastructure and edge-network builds is increasing demand for quick-install solutions. As installation teams seek to minimize downtime, cold joints continue evolving toward simpler assembly, better sealing and more stable long-term performance.
What is the Analysis of the Optical Fiber Cold Joint Market by Key Country?

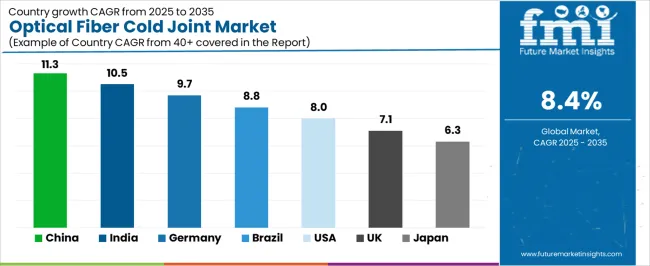
Optical Fiber Cold Joint Market Cagr Analysis By Country

Country CAGR (%)
China 11.3%
India 10.5%
Germany 9.7%
Brazil 8.8%
USA 8.0%
UK 7.1%
Japan 6.3%

The Optical Fiber Cold Joint Market is expanding rapidly across global telecommunications sectors, with China leading at an 11.3% CAGR through 2035, driven by aggressive fiber-to-the-home deployment, 5G rollout, and rising adoption of quick-install, low-loss fiber joint solutions. India follows at 10.5%, supported by nationwide broadband expansion, digital infrastructure initiatives, and growing demand for cost-effective fiber installation technologies. Germany records 9.7%, reflecting advanced network modernization, high precision standards, and strong deployment of fiber in industrial and smart city applications. Brazil grows at 8.8%, benefiting from accelerating telecom upgrades and increasing rural fiber penetration. The USA, at 8.0%, remains a mature market focused on high-performance fiber connectivity and robust network reliability, while the UK (7.1%) and Japan (6.3%) emphasize efficient installation, miniaturized joint systems, and long-term service durability.

How Is Network Deployment Acceleration Driving Market Growth in China?

China is projected to grow at a CAGR of 11.3% through 2035 in the optical fiber cold joint market. Expanding fiber-to-home connections, rapid 5G rollout, and broader backbone upgrades increase the need for cold joint units that support fast field deployment. Manufacturers introduce compact housings, improved sealing technology, and alignment structures suited for dense construction activity. Telecom contractors adopt these joints to minimize installation delays across complex environments. Regional expansion of data centers reinforces demand for reliable protection. Market movement aligns with rising installation tasks across municipal networks, industrial corridors, and remote rural communication projects.

  • Dense installation activity increases need for dependable cold joint enclosures.
  • Compact housings support rapid field deployment across varied installation sites.
  • Contractors adopt improved alignment structures for consistent connection accuracy.
  • Data center expansion strengthens demand for protective fiber components.

Why Is Telecom Infrastructure Expansion Strengthening Market Uptake in India?

India is expected to rise at a CAGR of 10.5% through 2035 in the optical fiber cold joint market. Growth in fiber-access networks, expanding metro corridors, and increasing mobile-data usage stimulate continuous installation of joint components. Manufacturers offer durable housings, simplified splice holders, and moisture-resistant sealing. Service providers integrate cold joints into large-scale rollouts to maintain predictable workflows. Rising digital connectivity across tiered cities accelerates procurement. Contractors value units requiring minimal specialized equipment for field installation. Market expansion aligns with national programs promoting fiber connectivity and increasing service coverage across underserved regions.
  • Metro expansions increase adoption of joints supporting quick telecom deployment.
  • Moisture-resistant designs improve field performance during monsoon conditions.
  • Contractors prefer joints requiring minimal tools for rapid installation.
  • Wider fiber connectivity initiatives raise long-term infrastructure demand.

How Do Technical Standards Influence Market Usage Across Germany?

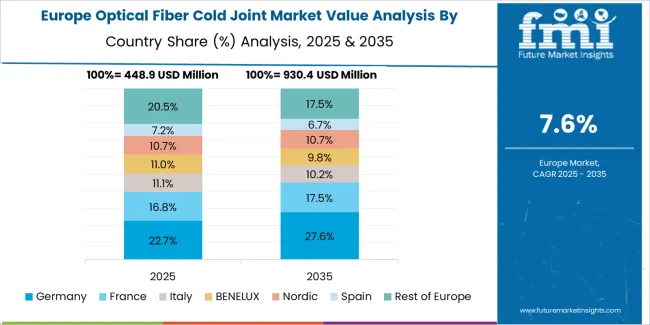
Optical Fiber Cold Joint Market Europe Country Market Share Analysis, 2025 & 2035

Germany is forecast to grow at a CAGR of 9.7% through 2035 in the optical fiber cold joint market. Demand rises from municipal fiber projects, enterprise connectivity upgrades, and modern industrial network layouts. Manufacturers emphasize precise alignment, rugged impact protection, and temperature-stable materials. Network operators adopt cold joints for predictable performance and low-maintenance installation. Compliance with regional standards drives consistent product quality across national deployments. Expansion of industrial automation increases fiber routing, raising demand for sealed joints. Market progression supports continued digital transformation across regulated communication infrastructure.

  • Industrial automation projects require durable joints supporting harsh environments.
  • Alignment precision improves connection quality for enterprise-grade networks.
  • Rugged housings reduce failure rates during long-term outdoor exposure.
  • Fiber expansion programs boost procurement across national deployment cycles.

Why Is Network Modernization Affecting Market Activity in Brazil?

Brazil is projected to increase at a CAGR of 8.8% through 2035 in the optical fiber cold joint market. Growth in fiber-based broadband, expanding communication coverage, and rising enterprise network upgrades support broader adoption. Manufacturers introduce corrosion-resistant shells, lightweight structures, and simplified installation mechanisms suitable for diverse climates. Telecom contractors integrate cold joints to speed deployment in remote and coastal regions. Regional programs promoting digital access encourage infrastructure upgrades. Market trends follow increasing adoption across long-distance routes, urban neighborhoods, and industrial sites requiring stable fiber protection solutions.
  • Corrosion-resistant units support installations across humid coastal environments.
  • Lightweight components improve efficiency during field-based telecom deployments.
  • Telecom contractors adopt joints simplifying installation in remote regions.
  • National digital programs expand broadband networks across multiple areas.

How Is Broadband Expansion Steering Market Demand in the United States?

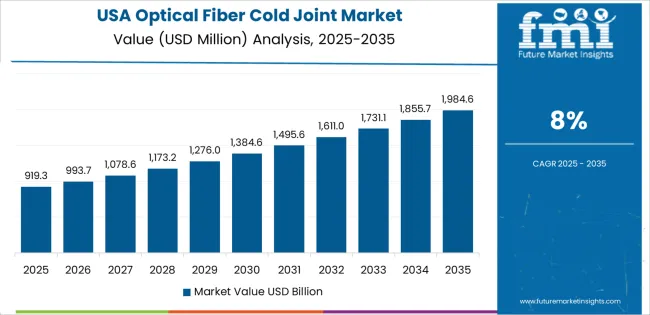
Optical Fiber Cold Joint Market Country Value Analysis

USA is projected to grow at a CAGR of 8.0% through 2035 in the optical fiber cold joint market. Broadband expansion, data-center growth, and rural fiber initiatives increase demand for durable joining solutions. Manufacturers design impact-resistant housings, secure locking mechanisms, and temperature-tolerant materials. Contractors use cold joints to reduce field labor time and maintain schedule reliability. Increasing installation density across urban corridors fuels recurring procurement. Federal infrastructure programs promote rural fiber routes requiring sealed protection. Market activity aligns with rising communication capacity needs across business districts, logistics hubs, and residential expansion zones.

  • Impact-resistant housings improve durability for outdoor fiber installations.
  • Rural networks require sealed joints supporting long-distance connectivity.
  • Contractors rely on cold joints for predictable installation timelines.
  • Broadband expansion increases recurring procurement across national networks.

Why Are Regional Deployment Needs Shaping Market Growth in the United Kingdom?

UK markets are expected to rise at a CAGR of 7.1% through 2035 in the optical fiber cold joint market. Fiber-to-premises targets, regional broadband upgrades, and commercial network expansions support increased adoption. Manufacturers supply compact closure designs, secure sealants, and alignment guides suited to constrained installation spaces. Contractors integrate cold joints into cabinet links and outdoor distribution points. Local councils expand fiber routes supporting business and residential zones. Market progress aligns with growing demands for stable communication infrastructure across diverse urban and semi-rural regions.
  • Compact designs support installations in narrow corridors and tight spaces.
  • Alignment guides improve connection reliability for dense urban networks.
  • Contractors use sealed joints to protect fiber during outdoor exposure.
  • Broadband expansion requires stable components for long-term service use.

How Is Compact Installation Demand Influencing Market Trends in Japan?

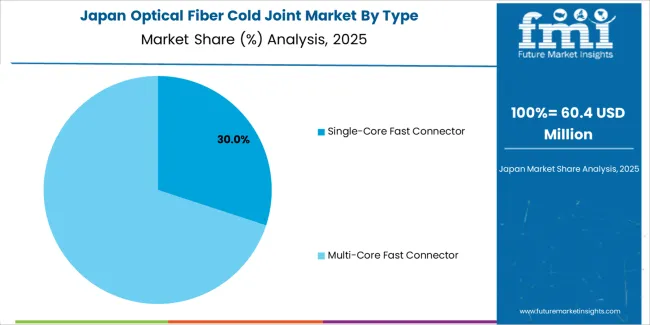
Optical Fiber Cold Joint Market Japan Market Share Analysis By Type

Japan is projected to increase at a CAGR of 6.3% through 2035 in the optical fiber cold joint market. Dense urban layouts, expanding enterprise networks, and rising device connectivity support consistent demand. Manufacturers develop slim-profile housings, precision-fit splice holders, and secure environmental seals suited for confined locations. Contractors integrate cold joints for predictable performance in high-rise buildings and metro networks. Growth in smart-city applications increases fiber routing requirements. Market expansion aligns with higher demand for compact, reliable, and low-maintenance joining solutions supporting continuous communication across national regions.
  • Slim housings suit installations in narrow ducts across crowded cities.
  • Precision splice holders improve connection stability in busy locations.
  • Metro networks require durable joints supporting heavy communication traffic.
  • Smart-city systems increase fiber deployment across varied project sites.

How Competitive Is the Global Optical Fiber Cold Joint Market and What Defines Its Strategic Landscape?

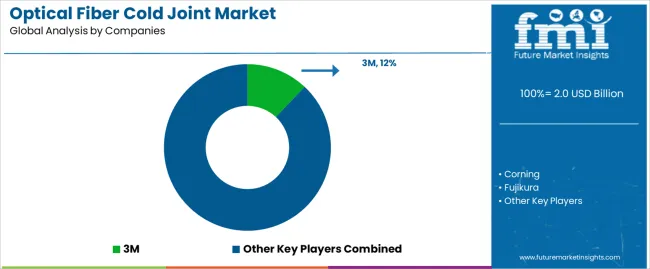
Optical Fiber Cold Joint Market Analysis By Company

The global optical fiber cold joint market shows moderate concentration, shaped by manufacturers supplying field-installable splice and connector solutions for telecom, broadband, and data-center deployments. 3M, Corning, Fujikura, and Sumitomo hold strong positions with precision-engineered cold-splice technologies designed for low insertion loss, rapid installation, and stable optical alignment. Their products support large-scale FTTx rollouts, maintenance operations, and high-reliability enterprise networks. Combo and Jiangsu UNIKIT reinforce the mid-tier segment with cost-efficient cold joints suited for regional carriers and contractors seeking consistent installation performance. These suppliers help expand network coverage through solutions designed for varied outdoor and indoor conditions, where ease of use and repeatable splicing quality are central requirements.

Dongguan Qinying, Shenzhen JFOPT, Sopto, and Shenzhen Tengtian broaden China’s manufacturing base with scalable production and compatibility across common single-mode and multi-mode fibers. OUFU Optical Fiber and Ningbo Goshining Communication Technology support market diversity through connectors aimed at last-mile delivery, rapid field repairs, and high-volume installations. Competition across the market is influenced by mechanical alignment accuracy, retention strength, and long-term environmental stability. Strategic differentiation depends on low-loss optical performance, simplified field assembly, and compliance with evolving telecom standards. As global fiber deployment accelerates, manufacturers offering reliable, tool-efficient, and climate-resilient cold-joint solutions are positioned to strengthen long-term market adoption.

Key Players in the Optical Fiber Cold Joint Market

  • 3M
  • Corning
  • Fujikura
  • Sumitomo
  • Combo
  • Jiangsu UNIKIT
  • Dongguan Qinying
  • Shenzhen JFOPT
  • Sopto
  • Shenzhen Tengtian
  • OUFU Optical Fiber
  • Ningbo Goshining Communication Technology

Report Scope for Optical Fiber Cold Joint Market

Items Values
Quantitative Units (2025) USD 2.0 billion
Type / Classification Single-core fast connectors; Multi-core fast connectors
Application Telecom operation, Data centers, Medical equipment, Industrial automation, Broadcasting & television, Aerospace & military, Others
Regions Covered East Asia, Europe, North America, South Asia, Latin America, Middle East & Africa, Eastern Europe
Countries Covered China, India, Germany, Brazil, USA, UK, Japan, and 40+ additional countries
Key Companies Profiled 3M, Corning, Fujikura, Sumitomo, Combo, Jiangsu UNIKIT, Dongguan Qinying, Shenzhen JFOPT, Sopto, Shenzhen Tengtian, OUFU Optical Fiber, Ningbo Goshining Communication Technology
Additional Attributes Dollar sales by type & application; units shipped and average selling price (ASP); insertion loss distribution (mean, P95); environmental ratings (IP, temperature range); pull strength and mechanical retention metrics; installation time per joint; tool-required vs tool-free split; single vs multi-core density; warranty & MTBF; packaging/kit contents; field training & installer competency requirements; certification & test protocols; case studies and buyer decision drivers.

Optical Fiber Cold Joint Market Segmentation

Type:

  • Single-Core Fast Connector
  • Multi-Core Fast Connector

Application:

  • Telecom Operation
  • Data Centers
  • Medical Equipment
  • Industrial Automation
  • Broadcasting and Television
  • Aerospace and Military
  • Others

Region:

  • East Asia
    • China
    • Japan
    • South Korea
    • Taiwan
    • Rest of East Asia
  • Europe
    • Germany
    • UK
    • France
    • Italy
    • Spain
    • Switzerland
    • Nordic
    • BENELUX
    • Rest of Europe
  • North America
    • USA
    • Canada
    • Mexico
  • South Asia
    • India
    • Pakistan
    • Bangladesh
    • Rest of South Asia
  • Latin America
    • Brazil
    • Argentina
    • Chile
    • Rest of Latin America
  • Middle East & Africa
    • Kingdom of Saudi Arabia
    • Other GCC Countries
    • Turkey
    • South Africa
    • Other African Union
    • Rest of Middle East & Africa
  • Eastern Europe
    • Russia
    • Poland
    • Czech Republic
    • Rest of Eastern Europe

Frequently Asked Questions

How big is the optical fiber cold joint market in 2025?

The global optical fiber cold joint market is estimated to be valued at USD 2.0 billion in 2025.

What will be the size of optical fiber cold joint market in 2035?

The market size for the optical fiber cold joint market is projected to reach USD 4.5 billion by 2035.

How much will be the optical fiber cold joint market growth between 2025 and 2035?

The optical fiber cold joint market is expected to grow at a 8.4% CAGR between 2025 and 2035.

What are the key product types in the optical fiber cold joint market?

The key product types in optical fiber cold joint market are single-core fast connector and multi-core fast connector.

Which application segment to contribute significant share in the optical fiber cold joint market in 2025?

In terms of application, telecom operation segment to command 63.0% share in the optical fiber cold joint market in 2025.

Table of Content

  1. Executive Summary
    • Global Market Outlook
    • Demand to side Trends
    • Supply to side Trends
    • Technology Roadmap Analysis
    • Analysis and Recommendations
  2. Market Overview
    • Market Coverage / Taxonomy
    • Market Definition / Scope / Limitations
  3. Market Background
    • Market Dynamics
      • Drivers
      • Restraints
      • Opportunity
      • Trends
    • Scenario Forecast
      • Demand in Optimistic Scenario
      • Demand in Likely Scenario
      • Demand in Conservative Scenario
    • Opportunity Map Analysis
    • Product Life Cycle Analysis
    • Supply Chain Analysis
    • Investment Feasibility Matrix
    • Value Chain Analysis
    • PESTLE and Porter’s Analysis
    • Regulatory Landscape
    • Regional Parent Market Outlook
    • Production and Consumption Statistics
    • Import and Export Statistics
  4. Global Market Analysis 2020 to 2024 and Forecast, 2025 to 2035
    • Historical Market Size Value (USD Million) Analysis, 2020 to 2024
    • Current and Future Market Size Value (USD Million) Projections, 2025 to 2035
      • Y to o to Y Growth Trend Analysis
      • Absolute $ Opportunity Analysis
  5. Global Market Pricing Analysis 2020 to 2024 and Forecast 2025 to 2035
  6. Global Market Analysis 2020 to 2024 and Forecast 2025 to 2035, By Type
    • Introduction / Key Findings
    • Historical Market Size Value (USD Million) Analysis By Type , 2020 to 2024
    • Current and Future Market Size Value (USD Million) Analysis and Forecast By Type , 2025 to 2035
      • Single-Core Fast Connector
      • Multi-Core Fast Connector
    • Y to o to Y Growth Trend Analysis By Type , 2020 to 2024
    • Absolute $ Opportunity Analysis By Type , 2025 to 2035
  7. Global Market Analysis 2020 to 2024 and Forecast 2025 to 2035, By Application
    • Introduction / Key Findings
    • Historical Market Size Value (USD Million) Analysis By Application, 2020 to 2024
    • Current and Future Market Size Value (USD Million) Analysis and Forecast By Application, 2025 to 2035
      • Telecom Operation
      • Data Centers
      • Medical Equipment
      • Industrial Automation
      • Broadcasting and Television
      • Aerospace and Military
      • Others
    • Y to o to Y Growth Trend Analysis By Application, 2020 to 2024
    • Absolute $ Opportunity Analysis By Application, 2025 to 2035
  8. Global Market Analysis 2020 to 2024 and Forecast 2025 to 2035, By Region
    • Introduction
    • Historical Market Size Value (USD Million) Analysis By Region, 2020 to 2024
    • Current Market Size Value (USD Million) Analysis and Forecast By Region, 2025 to 2035
      • North America
      • Latin America
      • Western Europe
      • Eastern Europe
      • East Asia
      • South Asia and Pacific
      • Middle East & Africa
    • Market Attractiveness Analysis By Region
  9. North America Market Analysis 2020 to 2024 and Forecast 2025 to 2035, By Country
    • Historical Market Size Value (USD Million) Trend Analysis By Market Taxonomy, 2020 to 2024
    • Market Size Value (USD Million) Forecast By Market Taxonomy, 2025 to 2035
      • By Country
        • USA
        • Canada
        • Mexico
      • By Type
      • By Application
    • Market Attractiveness Analysis
      • By Country
      • By Type
      • By Application
    • Key Takeaways
  10. Latin America Market Analysis 2020 to 2024 and Forecast 2025 to 2035, By Country
    • Historical Market Size Value (USD Million) Trend Analysis By Market Taxonomy, 2020 to 2024
    • Market Size Value (USD Million) Forecast By Market Taxonomy, 2025 to 2035
      • By Country
        • Brazil
        • Chile
        • Rest of Latin America
      • By Type
      • By Application
    • Market Attractiveness Analysis
      • By Country
      • By Type
      • By Application
    • Key Takeaways
  11. Western Europe Market Analysis 2020 to 2024 and Forecast 2025 to 2035, By Country
    • Historical Market Size Value (USD Million) Trend Analysis By Market Taxonomy, 2020 to 2024
    • Market Size Value (USD Million) Forecast By Market Taxonomy, 2025 to 2035
      • By Country
        • Germany
        • UK
        • Italy
        • Spain
        • France
        • Nordic
        • BENELUX
        • Rest of Western Europe
      • By Type
      • By Application
    • Market Attractiveness Analysis
      • By Country
      • By Type
      • By Application
    • Key Takeaways
  12. Eastern Europe Market Analysis 2020 to 2024 and Forecast 2025 to 2035, By Country
    • Historical Market Size Value (USD Million) Trend Analysis By Market Taxonomy, 2020 to 2024
    • Market Size Value (USD Million) Forecast By Market Taxonomy, 2025 to 2035
      • By Country
        • Russia
        • Poland
        • Hungary
        • Balkan & Baltic
        • Rest of Eastern Europe
      • By Type
      • By Application
    • Market Attractiveness Analysis
      • By Country
      • By Type
      • By Application
    • Key Takeaways
  13. East Asia Market Analysis 2020 to 2024 and Forecast 2025 to 2035, By Country
    • Historical Market Size Value (USD Million) Trend Analysis By Market Taxonomy, 2020 to 2024
    • Market Size Value (USD Million) Forecast By Market Taxonomy, 2025 to 2035
      • By Country
        • China
        • Japan
        • South Korea
      • By Type
      • By Application
    • Market Attractiveness Analysis
      • By Country
      • By Type
      • By Application
    • Key Takeaways
  14. South Asia and Pacific Market Analysis 2020 to 2024 and Forecast 2025 to 2035, By Country
    • Historical Market Size Value (USD Million) Trend Analysis By Market Taxonomy, 2020 to 2024
    • Market Size Value (USD Million) Forecast By Market Taxonomy, 2025 to 2035
      • By Country
        • India
        • ASEAN
        • Australia & New Zealand
        • Rest of South Asia and Pacific
      • By Type
      • By Application
    • Market Attractiveness Analysis
      • By Country
      • By Type
      • By Application
    • Key Takeaways
  15. Middle East & Africa Market Analysis 2020 to 2024 and Forecast 2025 to 2035, By Country
    • Historical Market Size Value (USD Million) Trend Analysis By Market Taxonomy, 2020 to 2024
    • Market Size Value (USD Million) Forecast By Market Taxonomy, 2025 to 2035
      • By Country
        • Kingdom of Saudi Arabia
        • Other GCC Countries
        • Turkiye
        • South Africa
        • Other African Union
        • Rest of Middle East & Africa
      • By Type
      • By Application
    • Market Attractiveness Analysis
      • By Country
      • By Type
      • By Application
    • Key Takeaways
  16. Key Countries Market Analysis
    • USA
      • Pricing Analysis
      • Market Share Analysis, 2024
        • By Type
        • By Application
    • Canada
      • Pricing Analysis
      • Market Share Analysis, 2024
        • By Type
        • By Application
    • Mexico
      • Pricing Analysis
      • Market Share Analysis, 2024
        • By Type
        • By Application
    • Brazil
      • Pricing Analysis
      • Market Share Analysis, 2024
        • By Type
        • By Application
    • Chile
      • Pricing Analysis
      • Market Share Analysis, 2024
        • By Type
        • By Application
    • Germany
      • Pricing Analysis
      • Market Share Analysis, 2024
        • By Type
        • By Application
    • UK
      • Pricing Analysis
      • Market Share Analysis, 2024
        • By Type
        • By Application
    • Italy
      • Pricing Analysis
      • Market Share Analysis, 2024
        • By Type
        • By Application
    • Spain
      • Pricing Analysis
      • Market Share Analysis, 2024
        • By Type
        • By Application
    • France
      • Pricing Analysis
      • Market Share Analysis, 2024
        • By Type
        • By Application
    • India
      • Pricing Analysis
      • Market Share Analysis, 2024
        • By Type
        • By Application
    • ASEAN
      • Pricing Analysis
      • Market Share Analysis, 2024
        • By Type
        • By Application
    • Australia & New Zealand
      • Pricing Analysis
      • Market Share Analysis, 2024
        • By Type
        • By Application
    • China
      • Pricing Analysis
      • Market Share Analysis, 2024
        • By Type
        • By Application
    • Japan
      • Pricing Analysis
      • Market Share Analysis, 2024
        • By Type
        • By Application
    • South Korea
      • Pricing Analysis
      • Market Share Analysis, 2024
        • By Type
        • By Application
    • Russia
      • Pricing Analysis
      • Market Share Analysis, 2024
        • By Type
        • By Application
    • Poland
      • Pricing Analysis
      • Market Share Analysis, 2024
        • By Type
        • By Application
    • Hungary
      • Pricing Analysis
      • Market Share Analysis, 2024
        • By Type
        • By Application
    • Kingdom of Saudi Arabia
      • Pricing Analysis
      • Market Share Analysis, 2024
        • By Type
        • By Application
    • Turkiye
      • Pricing Analysis
      • Market Share Analysis, 2024
        • By Type
        • By Application
    • South Africa
      • Pricing Analysis
      • Market Share Analysis, 2024
        • By Type
        • By Application
  17. Market Structure Analysis
    • Competition Dashboard
    • Competition Benchmarking
    • Market Share Analysis of Top Players
      • By Regional
      • By Type
      • By Application
  18. Competition Analysis
    • Competition Deep Dive
      • 3M
        • Overview
        • Product Portfolio
        • Profitability by Market Segments (Product/Age /Sales Channel/Region)
        • Sales Footprint
        • Strategy Overview
          • Marketing Strategy
          • Product Strategy
          • Channel Strategy
      • Corning
      • Fujikura
      • Sumitomo
      • Combo
      • Jiangsu UNIKIT
      • Dongguan Qinying
      • Shenzhen JFOPT
      • Sopto
      • Shenzhen Tengtian
      • OUFU Optical Fiber
      • Ningbo Goshining Communication Technology
  19. Assumptions & Acronyms Used
  20. Research Methodology

List of Tables

  • Table 1: Global Market Value (USD Million) Forecast by Region, 2020 to 2035
  • Table 2: Global Market Value (USD Million) Forecast by Type , 2020 to 2035
  • Table 3: Global Market Value (USD Million) Forecast by Application, 2020 to 2035
  • Table 4: North America Market Value (USD Million) Forecast by Country, 2020 to 2035
  • Table 5: North America Market Value (USD Million) Forecast by Type , 2020 to 2035
  • Table 6: North America Market Value (USD Million) Forecast by Application, 2020 to 2035
  • Table 7: Latin America Market Value (USD Million) Forecast by Country, 2020 to 2035
  • Table 8: Latin America Market Value (USD Million) Forecast by Type , 2020 to 2035
  • Table 9: Latin America Market Value (USD Million) Forecast by Application, 2020 to 2035
  • Table 10: Western Europe Market Value (USD Million) Forecast by Country, 2020 to 2035
  • Table 11: Western Europe Market Value (USD Million) Forecast by Type , 2020 to 2035
  • Table 12: Western Europe Market Value (USD Million) Forecast by Application, 2020 to 2035
  • Table 13: Eastern Europe Market Value (USD Million) Forecast by Country, 2020 to 2035
  • Table 14: Eastern Europe Market Value (USD Million) Forecast by Type , 2020 to 2035
  • Table 15: Eastern Europe Market Value (USD Million) Forecast by Application, 2020 to 2035
  • Table 16: East Asia Market Value (USD Million) Forecast by Country, 2020 to 2035
  • Table 17: East Asia Market Value (USD Million) Forecast by Type , 2020 to 2035
  • Table 18: East Asia Market Value (USD Million) Forecast by Application, 2020 to 2035
  • Table 19: South Asia and Pacific Market Value (USD Million) Forecast by Country, 2020 to 2035
  • Table 20: South Asia and Pacific Market Value (USD Million) Forecast by Type , 2020 to 2035
  • Table 21: South Asia and Pacific Market Value (USD Million) Forecast by Application, 2020 to 2035
  • Table 22: Middle East & Africa Market Value (USD Million) Forecast by Country, 2020 to 2035
  • Table 23: Middle East & Africa Market Value (USD Million) Forecast by Type , 2020 to 2035
  • Table 24: Middle East & Africa Market Value (USD Million) Forecast by Application, 2020 to 2035

List of Figures

  • Figure 1: Global Market Pricing Analysis
  • Figure 2: Global Market Value (USD Million) Forecast 2020-2035
  • Figure 3: Global Market Value Share and BPS Analysis by Type , 2025 and 2035
  • Figure 4: Global Market Y-o-Y Growth Comparison by Type , 2025-2035
  • Figure 5: Global Market Attractiveness Analysis by Type
  • Figure 6: Global Market Value Share and BPS Analysis by Application, 2025 and 2035
  • Figure 7: Global Market Y-o-Y Growth Comparison by Application, 2025-2035
  • Figure 8: Global Market Attractiveness Analysis by Application
  • Figure 9: Global Market Value (USD Million) Share and BPS Analysis by Region, 2025 and 2035
  • Figure 10: Global Market Y-o-Y Growth Comparison by Region, 2025-2035
  • Figure 11: Global Market Attractiveness Analysis by Region
  • Figure 12: North America Market Incremental Dollar Opportunity, 2025-2035
  • Figure 13: Latin America Market Incremental Dollar Opportunity, 2025-2035
  • Figure 14: Western Europe Market Incremental Dollar Opportunity, 2025-2035
  • Figure 15: Eastern Europe Market Incremental Dollar Opportunity, 2025-2035
  • Figure 16: East Asia Market Incremental Dollar Opportunity, 2025-2035
  • Figure 17: South Asia and Pacific Market Incremental Dollar Opportunity, 2025-2035
  • Figure 18: Middle East & Africa Market Incremental Dollar Opportunity, 2025-2035
  • Figure 19: North America Market Value Share and BPS Analysis by Country, 2025 and 2035
  • Figure 20: North America Market Value Share and BPS Analysis by Type , 2025 and 2035
  • Figure 21: North America Market Y-o-Y Growth Comparison by Type , 2025-2035
  • Figure 22: North America Market Attractiveness Analysis by Type
  • Figure 23: North America Market Value Share and BPS Analysis by Application, 2025 and 2035
  • Figure 24: North America Market Y-o-Y Growth Comparison by Application, 2025-2035
  • Figure 25: North America Market Attractiveness Analysis by Application
  • Figure 26: Latin America Market Value Share and BPS Analysis by Country, 2025 and 2035
  • Figure 27: Latin America Market Value Share and BPS Analysis by Type , 2025 and 2035
  • Figure 28: Latin America Market Y-o-Y Growth Comparison by Type , 2025-2035
  • Figure 29: Latin America Market Attractiveness Analysis by Type
  • Figure 30: Latin America Market Value Share and BPS Analysis by Application, 2025 and 2035
  • Figure 31: Latin America Market Y-o-Y Growth Comparison by Application, 2025-2035
  • Figure 32: Latin America Market Attractiveness Analysis by Application
  • Figure 33: Western Europe Market Value Share and BPS Analysis by Country, 2025 and 2035
  • Figure 34: Western Europe Market Value Share and BPS Analysis by Type , 2025 and 2035
  • Figure 35: Western Europe Market Y-o-Y Growth Comparison by Type , 2025-2035
  • Figure 36: Western Europe Market Attractiveness Analysis by Type
  • Figure 37: Western Europe Market Value Share and BPS Analysis by Application, 2025 and 2035
  • Figure 38: Western Europe Market Y-o-Y Growth Comparison by Application, 2025-2035
  • Figure 39: Western Europe Market Attractiveness Analysis by Application
  • Figure 40: Eastern Europe Market Value Share and BPS Analysis by Country, 2025 and 2035
  • Figure 41: Eastern Europe Market Value Share and BPS Analysis by Type , 2025 and 2035
  • Figure 42: Eastern Europe Market Y-o-Y Growth Comparison by Type , 2025-2035
  • Figure 43: Eastern Europe Market Attractiveness Analysis by Type
  • Figure 44: Eastern Europe Market Value Share and BPS Analysis by Application, 2025 and 2035
  • Figure 45: Eastern Europe Market Y-o-Y Growth Comparison by Application, 2025-2035
  • Figure 46: Eastern Europe Market Attractiveness Analysis by Application
  • Figure 47: East Asia Market Value Share and BPS Analysis by Country, 2025 and 2035
  • Figure 48: East Asia Market Value Share and BPS Analysis by Type , 2025 and 2035
  • Figure 49: East Asia Market Y-o-Y Growth Comparison by Type , 2025-2035
  • Figure 50: East Asia Market Attractiveness Analysis by Type
  • Figure 51: East Asia Market Value Share and BPS Analysis by Application, 2025 and 2035
  • Figure 52: East Asia Market Y-o-Y Growth Comparison by Application, 2025-2035
  • Figure 53: East Asia Market Attractiveness Analysis by Application
  • Figure 54: South Asia and Pacific Market Value Share and BPS Analysis by Country, 2025 and 2035
  • Figure 55: South Asia and Pacific Market Value Share and BPS Analysis by Type , 2025 and 2035
  • Figure 56: South Asia and Pacific Market Y-o-Y Growth Comparison by Type , 2025-2035
  • Figure 57: South Asia and Pacific Market Attractiveness Analysis by Type
  • Figure 58: South Asia and Pacific Market Value Share and BPS Analysis by Application, 2025 and 2035
  • Figure 59: South Asia and Pacific Market Y-o-Y Growth Comparison by Application, 2025-2035
  • Figure 60: South Asia and Pacific Market Attractiveness Analysis by Application
  • Figure 61: Middle East & Africa Market Value Share and BPS Analysis by Country, 2025 and 2035
  • Figure 62: Middle East & Africa Market Value Share and BPS Analysis by Type , 2025 and 2035
  • Figure 63: Middle East & Africa Market Y-o-Y Growth Comparison by Type , 2025-2035
  • Figure 64: Middle East & Africa Market Attractiveness Analysis by Type
  • Figure 65: Middle East & Africa Market Value Share and BPS Analysis by Application, 2025 and 2035
  • Figure 66: Middle East & Africa Market Y-o-Y Growth Comparison by Application, 2025-2035
  • Figure 67: Middle East & Africa Market Attractiveness Analysis by Application
  • Figure 68: Global Market - Tier Structure Analysis
  • Figure 69: Global Market - Company Share Analysis
Dashboard
Dashboard
Dashboard
Dashboard
Dashboard
Dashboard

Our Research Products

Full Research Suite

The "Full Research Suite" delivers actionable market intel, deep dives on markets or technologies, so clients act faster, cut risk, and unlock growth.

Competitor Leaderboard Report

The Leaderboard benchmarks and ranks top vendors, classifying them as Established Leaders, Leading Challengers, or Disruptors & Challengers.

Future Leaders Index

Locates where complements amplify value and substitutes erode it, forecasting net impact by horizon

Market Data & Forecasts

We deliver granular, decision-grade intel: market sizing, 5-year forecasts, pricing, adoption, usage, revenue, and operational KPIs—plus competitor tracking, regulation, and value chains—across 60 countries broadly.

Market Focus Report

Spot the shifts before they hit your P&L. We track inflection points, adoption curves, pricing moves, and ecosystem plays to show where demand is heading, why it is changing, and what to do next across high-growth markets and disruptive tech

Survey Report

Real-time reads of user behavior. We track shifting priorities, perceptions of today’s and next-gen services, and provider experience, then pace how fast tech moves from trial to adoption, blending buyer, consumer, and channel inputs with social signals (#WhySwitch, #UX).

Bespoke Reports

Partner with our analyst team to build a custom report designed around your business priorities. From analysing market trends to assessing competitors or crafting bespoke datasets, we tailor insights to your needs.

Supplier Intelligence

Discovery & Profiling

Capacity & Footprint

Performance & Risk

Compliance & Governance

Commercial Readiness

Who Supplies Whom

Scorecards & Shortlists

Playbooks & Docs

Category Intelligence

Definition & Scope

Demand & Use Cases

Cost Drivers

Market Structure

Supply Chain Map

Trade & Policy

Operating Norms

Deliverables

Buyer Intelligence

Account Basics

Spend & Scope

Procurement Model

Vendor Requirements

Terms & Policies

Entry Strategy

Pain Points & Triggers

Outputs

Pricing Analysis

Benchmarks

Trends

Should-Cost

Indexation

Landed Cost

Commercial Terms

Deliverables

Brand Analysis

Positioning & Value Prop

Share & Presence

Customer Evidence

Go-to-Market

Digital & Reputation

Compliance & Trust

KPIs & Gaps

Outputs

Full Research Suite comprises of:

Market outlook & trends analysis

Market outlook & trends analysis

Interviews & case studies

Interviews & case studies

Strategic recommendations

Strategic recommendations

Vendor profiles & capabilities analysis

Vendor profiles & capabilities analysis

5-year forecasts

5-year forecasts

8 regions and 60+ country-level data splits

8 regions and 60+ country-level data splits

Market segment data splits

Market segment data splits

12 months of continuous data updates

12 months of continuous data updates

DELIVERED AS:

PDF EXCEL ONLINE

Full Research Suite


$5000

$7500

$10000

Buy Report Now
Similar Industry Reports

Similar Industry Reports

Optical Spectrum Analyzer Market

Optical Spectrum Analyzer Market Size and Share Forecast Outlook 2025 to 2035

Optical Extinction Analyzer Market

Optical Extinction Analyzer Market Size and Share Forecast Outlook 2025 to 2035

Optical Character Recognition Market

Optical Character Recognition Market Forecast and Outlook 2025 to 2035

Optical Satellite Market

Optical Satellite Market Size and Share Forecast Outlook 2025 to 2035

Optical Imaging Market

Optical Imaging Market Size and Share Forecast Outlook 2025 to 2035

Optical Whitening Agents Market

Optical Whitening Agents Market Size and Share Forecast Outlook 2025 to 2035

Optical Fingerprint Collector Market

Optical Fingerprint Collector Market Size and Share Forecast Outlook 2025 to 2035

Optical Lens Materials Market

Optical Lens Materials Market Size and Share Forecast Outlook 2025 to 2035

Optical Microscope Market

Optical Microscope Market Size and Share Forecast Outlook 2025 to 2035

Optical Component Tester Market

Optical Component Tester Market Size and Share Forecast Outlook 2025 to 2035

Optical EMI Shielding Adapters Market

Optical EMI Shielding Adapters Market Size and Share Forecast Outlook 2025 to 2035

Optical Connector Polishing Films Market

Optical Connector Polishing Films Market Size and Share Forecast Outlook 2025 to 2035

Optical Transmitter Market

Optical Transmitter Market Size and Share Forecast Outlook 2025 to 2035

Optical Telephoto Lens Market

Optical Telephoto Lens Market Size and Share Forecast Outlook 2025 to 2035

Optical Lattice Clock Market

Optical Lattice Clock Market Size and Share Forecast Outlook 2025 to 2035

Optical Grade Lithium Tantalate Wafers Market

Optical Grade Lithium Tantalate Wafers Market Size and Share Forecast Outlook 2025 to 2035

Optical Grade LiTaO3 Crystal Substrate Market

Optical Grade LiTaO3 Crystal Substrate Market Size and Share Forecast Outlook 2025 to 2035

Optical Brighteners Market

Optical Brighteners Market Size and Share Forecast Outlook 2025 to 2035

Optical Liquid Level Sensor Market

Optical Liquid Level Sensor Market Size and Share Forecast Outlook 2025 to 2035

Optical Communication and Networking Market

Optical Communication and Networking Market Size and Share Forecast Outlook 2025 to 2035

Future Market Insights

Optical Fiber Cold Joint Market

Chat With MaRIA

Chat With

MaRIA

Hi There, I am MaRIA, Your Market Research Intelligence Assistant. How may I help you?