The packaging tapes market is projected to expand steadily from USD 85.1 billion in 2025 to USD 107.9 billion by 2035, registering a CAGR of 2.3%. Growth is underpinned by increasing demand for durable, lightweight, and efficient packaging solutions across key industries such as e-commerce, logistics, and FMCG.
The growing trend towards sustainable and recyclable materials is further shaping market innovation. Superior bonding properties continue to make pressure sensitive tapes a preferred choice. In 2025, this segment is projected to account for approximately 34.3% of the total market. These tapes are valued for their ability to bond non-compatible materials while maintaining uniform thickness and aesthetics. Their expanding application in industries such as aerospace manufacturing is enhancing their market penetration.
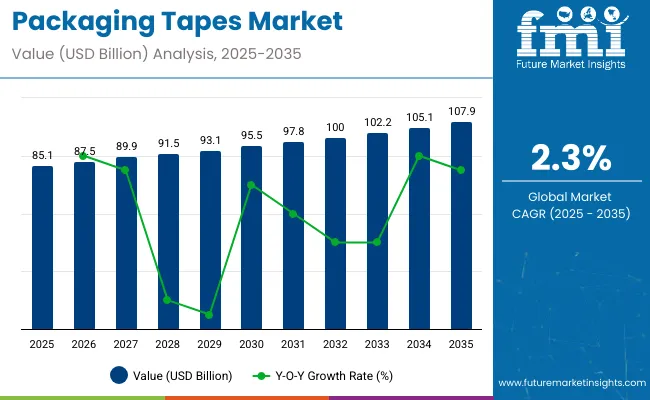
| Attributes | Description |
|---|---|
| Estimated Global Packaging Tape Market Size (2025) | USD 85.1 billion |
| Projected Global Packaging Tape Market Value (2035) | USD 107.9 billion |
| Value-based CAGR (2025 to 2035) | 2.3% |
3M has introduced sustainable packaging solutions, such as the Scotch® Bio-based Packaging Tape 3073 Series, which features a bio-based adhesive and a recycled core. This tape is designed for effective bonding with highly recycled cardboard boxes, ensuring both compatibility and performance.
Additionally, Scotch® Box Lock™ Packaging Tape is manufactured with a solvent-free adhesive in a zero-waste-to-landfill facility, making it suitable for use with all box types, including 100% recycled cardboard. These initiatives highlight 3M's commitment to sustainability, aiming to reduce environmental impact through the use of bio-based materials and eco-friendly manufacturing processes, as detailed on the official 3M website
Hot melt adhesives are also gaining ground due to affordability and versatility. Expected to account for 42.1% of the market in 2025, these adhesives offer fast cooling times and superior bonding with diverse substrates like plastic, foam, and cardboard. This versatility is vital as manufacturers adopt new materials and adapt to high-speed production lines. Regionally, Asia Pacific remains the dominant market, driven by high demand from consumer goods and industrial packaging sectors. North America and Europe follow, with strong focus on innovation and sustainability.
Major players such as 3M, Nitto Denko, Tesa SE, Intertape Polymer Group, and Avery Dennison are actively investing in R&D, sustainability initiatives, and advanced adhesive technologies to maintain competitive edge. As packaging demands evolve, the market is set to grow steadily, offering new opportunities for innovation.
Packaging tapes are regulated to ensure safety, performance, and environmental compliance. These regulations apply to materials, adhesives, labeling, and end-use suitability. Certifications support quality assurance and guide manufacturers in meeting domestic and international market expectations.
Product Safety and Labeling Regulations
Regulatory frameworks such as the Fair Packaging and Labeling Act in the United States and the Consumer Packaging and Labeling Act in Canada ensure that packaging tape products clearly disclose product identity, manufacturer details, and net content. Accurate labeling is required for both consumer safety and trade transparency.
Adhesive and Material Safety Standards
Packaging tapes used in food-related applications must comply with food safety guidelines. In the United States, the Food and Drug Administration mandates that materials and adhesives be safe for direct or indirect food contact. In the European Union, food-contact tapes must comply with the EU Regulation on food contact materials and national guidance such as BfR recommendations. These standards help ensure that chemical components do not migrate into food.
Performance and Adhesion Certifications
Performance requirements for pressure-sensitive tapes are governed by international standards such as those from ISO, ASTM, PSTC, AFERA, and JATMA. These cover peel adhesion, shear strength, and tensile durability. For example, ASTM D1974 provides guidance for tape usage in box sealing to ensure structural integrity during storage and transit.
The global trade of packaging tapes is driven by the growing demand for secure and efficient product sealing across industries such as e-commerce, logistics, food processing, and manufacturing. Exporting countries benefit from strong chemical processing capabilities, advanced adhesive technologies, and scalable manufacturing systems. Importing countries rely on these producers to meet their packaging requirements across both consumer and industrial applications.
Major Exporting Countries
Key exporters of packaging tapes include China, the United States, Germany, Japan, and South Korea. These countries have advanced adhesive production facilities, integrated supply chains, and access to high-performance raw materials such as polypropylene and acrylics. They export a wide range of products including pressure-sensitive tapes, filament tapes, double-sided tapes, and eco-friendly alternatives.
Major Importing Countries
Leading importers include India, Brazil, Mexico, the United Kingdom, and countries across the Middle East and Africa. These markets show strong demand for packaging tapes due to expanding retail sectors, rising e-commerce activity, and growth in food and pharmaceutical distribution. Imports often include specialty tapes for cold chain logistics, tamper-evident packaging, and recyclable applications.
The table below highlights the CAGRs for the packaging tape market for the periods from 2024 to 2034 and 2025 to 2035. The periods are broken down into two semi-annual periods, the first half (H1) comprising January to June, while the second half (H2) comprises July to December. This section highlights the changes that take place in the demand with the time period changing.
For the 2024 to 2034 period, the CAGR for H1 is predicted to be 2.4%. A substantial decrease is predicted for H2 however, with the CAGR coming down to 2.1%.
| Particular | Value CAGR |
|---|---|
| H1 | 2.4% (2024 to 2034) |
| H2 | 2.1% (2024 to 2034) |
| H1 | 2.5% (2025 to 2035) |
| H2 | 2% (2025 to 2035) |
The CAGR for H1 is set to be 2.5% in the 2025 to 2035 period. Just like in the 2024 to 2034 period, H2 of the 2025 to 2035 period is set to see a substantial decrease in CAGR, projected to be 2%. Thus, in both periods, it is the first half that is set to be more beneficial.
The global packaging tapes market is witnessing strong growth led by pressure sensitive tapes and hot melt adhesives. By 2025, pressure sensitive tapes are expected to hold 34.3% market share, while hot melt adhesives will account for 42.1%. Demand is driven by the need for reliable, efficient, and sustainable bonding solutions across packaging and logistics sectors.
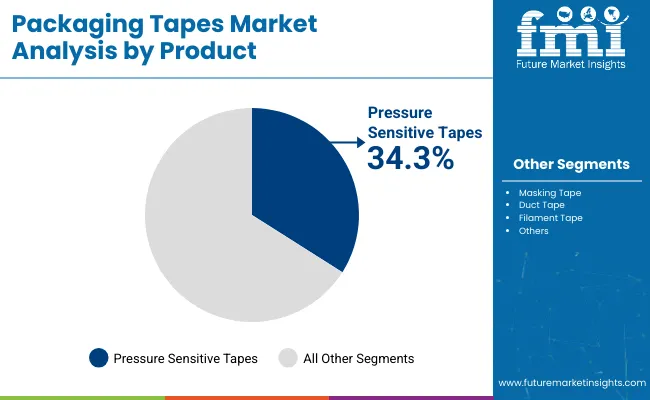
In 2025, pressure sensitive tapes are projected to capture 34.3% of the global packaging tapes market. Their superior bonding ability makes them indispensable for adhering diverse packaging materials. The lightweight profile enhances packaging efficiency, reducing overall material costs and improving transport convenience. Their uniform thickness supports aesthetic packaging and ensures structural integrity during shipment. Emerging applications are accelerating demand.
In e-commerce and food packaging, pressure sensitive tapes offer tamper-evident sealing and enhanced branding through printable surfaces. In aerospace and high-value product packaging, these tapes replace mechanical fasteners to minimize weight and simplify assembly. Continuous innovations in adhesive formulations are improving temperature resistance and bonding strength, making pressure sensitive tapes an increasingly preferred solution. Their adaptability, ease of use, and cost-efficiency will ensure continued growth across mainstream and niche packaging applications.
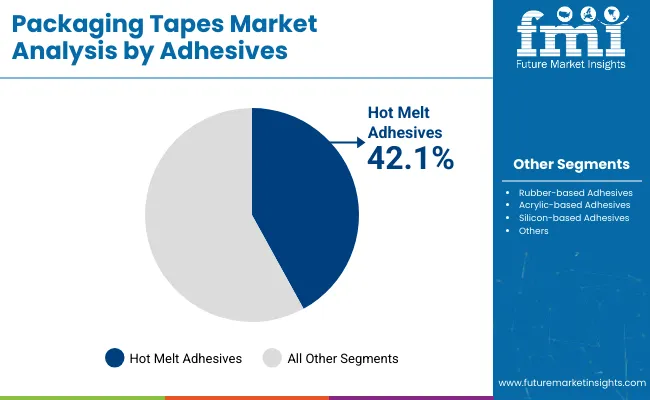
Hot melt adhesives are anticipated to command 42.1% of the global packaging tapes market in 2025. Their rapid setting times and cost-effectiveness provide significant advantages for high-speed automated packaging lines. This performance enables manufacturers to boost production efficiency while maintaining reliable sealing under varied conditions. Growing demand for sustainable and flexible packaging further supports the segment’s rise. Hot melt adhesives bond with a wide range of substrates, including recycled content materials, lightweight films, and complex laminate structures.
Their application in corrugated box sealing, flexible packaging, and specialty tapes continues to expand. Recent innovations focus on reducing environmental impact by lowering VOC emissions and supporting recycling processes. Additionally, the compatibility of hot melt adhesives with emerging bio-based tape constructions aligns with global sustainability goals. The combination of affordability, versatility, and sustainability will keep hot melt adhesives at the forefront of packaging tape innovation.
Proliferation of E-commerce Platforms: A Wrapped Opportunity for Packaging Tapes’ Manufacturers
The use of packing tapes is being bolstered by the increased packaging needs brought on by e-commerce sales. Sales of packed food & beverage items, consumer goods, and more have reached unprecedented levels due to online activities.
Moreover, the presence of e-commerce giants like Amazon, eBay, and Alibaba makes it convenient for packaging manufacturers to capitalize on the growing demand. The e-commerce packaging market is set to cross the USD 200 billion threshold by 2035. The need for packaging equipment too has subsequently increased with growing sales over the e-commerce platforms.
Building and Construction Sector Making Greater Use of Packaging Tapes
The packaging tape market is benefiting from the increasing construction activities worldwide. Growing urbanization, population numbers, and the sizes of buildings getting bigger are all contributing to the robustness of the construction sector. Countries like the United States and Japan are witnessing construction expenditures go through the roof.
Packaging tapes play a vital role in construction. From propping up walls to preventing leaks in rooks, the use of tapes in construction is varied. Builders also tend to use these tapes as they are durable, able to withstand temperature fluctuations and exposure to light, as well as being cost-effective. Prominent companies like Avery Dennison Corporation and 3M are thus manufacturing tapes specially for construction purposes.
Sustainable Packaging Tapes Making Their Mark
The sustainability wave has hit the packaging tape market and more manufacturers are opting for sustainable products. From big-scale companies to eco-focused startups, sustainability has become a prime area of focus among stakeholders.
The manufacture of plastic tapes, especially single-use plastic, is drastically reducing. Producers are instead looking at more eco-friendly materials like kraft paper and plant-based materials. The production of compostable and biodegradable tapes has also developed rapidly. Environmentally focused manufacturers like Better Packaging Co. are thus getting more of the limelight.
The need for eco-friendly packaging tapes is also being fuelled by end-users who want to make the whole of their packaging sustainable. A substantial number of customers are focused on making the whole of their packaging equipment compostable or biodegradable. Commercial end-users also require eco-friendly tapes for their environmentally conscious packaging facilities. Hence, sustainable tapes are seen as the way forward in the market.
Disdain Over Plastic Tapes Cuts Short Growth
Even though a considerable number of manufacturers are switching to sustainable alternatives, plastic packaging tapes remain the norm. However, there is a growing aversion to the use of plastic in packaging. There is thus a shift towards the use of stretch films and stapling in packaging, even though these alternatives do not provide the sturdiness of tapes.
Manufacturers are seeking alternatives to plastic but that often requires investment in research and development and increases production costs. There are also doubts about tapes made of materials like fiber and paper, providing the same durability as plastic.
Plastic use in tapes also brings with it increasing regulations. Governments are clamping down on the use of plastic, making procurement difficult as well as pricey for manufacturers. These factors combine to negatively impact the growth of the market.
Tier 1 companies have established a dominating presence in the packaging tape market. These companies control large swathes of the demand. The companies also have well-established relationships with clients and thus end-users trust their products. Some of the well-known tier 1 companies are 3M Company, Avery Dennison Corporation, and Tesa SE. These companies are characterized by their wide portfolio of products.
Tier 2 companies do not possess the financial might of tier 1 companies but have still carved out a niche for themselves. They do it by offering a variety of products and catering to regional demand. Some notable tier 2 companies are Shurtape Technologies, LLC, Advanced Tapes International Ltd., and Folsen Tapes.
Tier 3 companies are concentrated on local demand, having a small gathering of loyal clients. These companies often distinguish themselves by offering sustainable products. Some notable tier 3 companies are Tape Technologies, Kraton Corporation, and Shenzhen Kylin Adhesive Products.
The encouragement for the packaging sector shown by the governments in the Asia Pacific makes the region a lucrative one for stakeholders. The manufacturing sector thriving on the back of increasing foreign investment and expanding facilities, sees Europe offers plentiful opportunities for companies in the market.
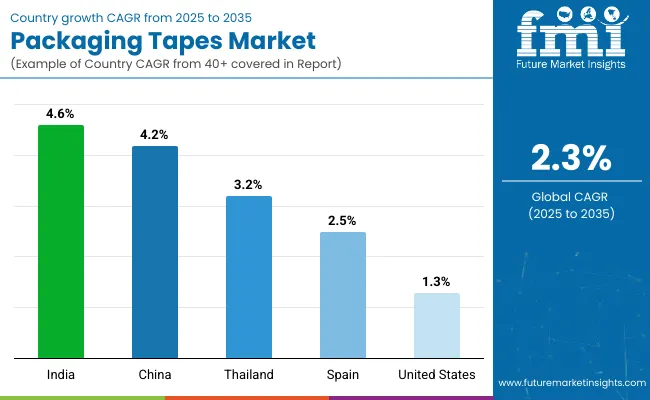
| Countries | CAGR (2025 to 2035) |
|---|---|
| India | 4.6% |
| United States | 1.3% |
| China | 4.2% |
| Spain | 2.5% |
| Thailand | 3.2% |
The packaging tapes market in India is estimated to register a CAGR of 4.6% over the forecast period. Branding has become an indispensable strategy for Indian businesses. Hence, packaging that is amenable to branding is highly sought after in India.
Packing tapes are no exception. Indian players like Sivakasi are providing branding options on packing tapes. Sivaksi, which is mostly known in India for producing firecrackers but also dabbles in packing tapes, also provides QR codes on their tapes.
Another key trend is the smart packaging. The advent of AI and advanced technology in the packaging industry is another sticky strategy key players are adopting. Technologies like NFC are integrated in the packaging tapes for real-time tracking and engagement with consumers. The tech-savvy consumers are wildly receptive to such trends, which is propelling the demand.
The China market is anticipated to advance at a CAGR of 4.2% over the projected period. The urbanization rates in China are high and coupled with government planning to modernize cities, the construction sector is thriving in the country. China is also building new cities, a case in point being Xiongan, near the capital Beijing. Thus, the scope of construction is expanding in the country. Packaging tapes are used extensively in construction projects. The growing construction sector is thus providing more incentives for the development of the market in China.
Another prominent reason for the progress of the product in China is the growing e-commerce business. Sites like Taobao and Alibaba are seeing increasing traffic, leading to more sales. According to data from the Chinese Commerce Ministry, online retail sales for 2025 rose 9.8% as compared to 2024, clocking in at nearly USD 1,000 billion. The increased e-commerce activities are necessitating more packaging equipment in the country, including tapes.
The Spain packaging tape market is set to register a CAGR of 2.5% over the period from 2025 to 2035. The environment in Spain is conducive to growth, not just for local companies but also for foreign players.
Foreign players are entering the Spanish space or expanding their presence in the country. For instance, French paper giant Antalis acquired the Spanish Cohal Group, which manufactured packaging tapes among other packaging equipment, in 2022. Antalis already had a subsidiary in Spain and through means of the acquisition further expanded its presence in the country.
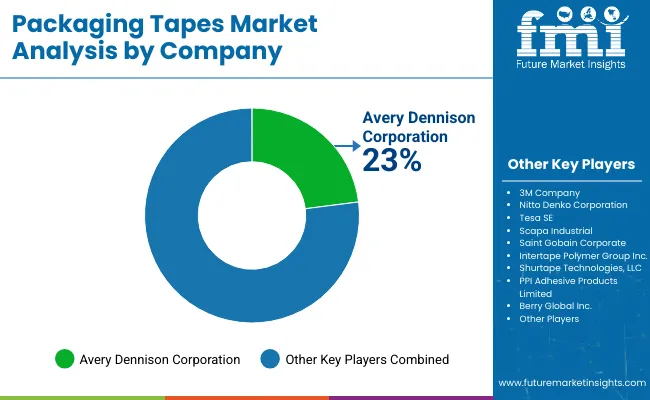
The packaging tape market is dominated by a few giants. Any new entrants have to deal with competition from well-established giants. However, even with the consolidated nature of the market, small and medium-scale operations have still managed to make a name for themselves.
One of the prime strategies being focused upon by players is launching sustainable products. Both small-scale and big-name competitors have launched sustainable products recently, often made from recycled material. Significant amounts of money are also being invested in research and development. Research and development is tasked to come up with innovative material for sustainable tapes.
Key Industrial Developments:
| Report Attributes | Details |
|---|---|
| Market Size (2025) | USD 85.1 billion |
| Projected Market Size (2035) | USD 107.9 billion |
| CAGR (2025 to 2035) | 2.3% |
| Base Year for Estimation | 2024 |
| Historical Period | 2020 to 2024 |
| Projections Period | 2025 to 2035 |
| Quantitative Units | USD billion for value and million square meters for volume |
| Product Types Analyzed (Segment 1) | Pressure sensitive tape, Masking tape, Duct tape, Filament tape, Others |
| Material Types Analyzed (Segment 2) | Plastic, Paper, Fiber, Glass fiber, Foam, Cloth |
| End Use Analyzed (Segment 3) | Logistics & shipping, Building & construction, Automotive parts packaging, Pharmaceutical & medical devices, Food & beverages, Other industrial end use |
| Adhesives Analyzed (Segment 4) | Rubber-based adhesives, Acrylic-based adhesives, Silicon-based adhesives, Hot melt adhesives |
| Regions Covered | North America; Latin America; Europe; South Asia; East Asia; Oceania; Middle East & Africa |
| Countries Covered | United States, Canada, Mexico, Germany, United Kingdom, France, Italy, Spain, China, Japan, South Korea, India, Australia, UAE, South Africa |
| Key Players influencing the Packaging Tapes Market | 3M Company, Nitto Denko Corporation, Avery Dennison Corporation, Tesa SE, Scapa Industrial, Saint Gobain Corporate, Intertape Polymer Group Inc., Shurtape Technologies, LLC, PPI Adhesive Products Limited, Berry Global Inc., Advanced Tapes International Ltd., Vibac Group S.p.a, Folsen Tapes, PPM Industries SpA, Can-Do National Tape, H.B. Fuller Company, Schweitzer-Mauduit International (SWM), Kruse Adhesive Tape, Inc., NADCO Tapes & Labels, Inc., Atlas Tapes S.A |
| Additional Attributes | Dollar sales by product category (pressure sensitive vs. masking tape), Impact of adhesives on market growth, Distribution channel trends (direct vs. retail), Regional consumption patterns, Material-specific demand, Innovations in eco-friendly packaging tape solutions |
Based on the product, the industry is divided into pressure sensitive tape, masking tape, duct tape, filament tape, and others.
Based on the material, the packaging tape market can be divided into plastic, paper, fiber, glass fiber, foam, and cloth.
Based on the end use, the packaging tape market is divided into logistics & shipping, building & construction, automotive parts packaging, pharmaceutical & medical devices, food & beverages, and other industrial end use.
Based on the adhesives, the packaging tape market can be divided into the following segments: rubber-based adhesives, acrylic-based adhesives, silicon-based adhesives, and hot melt adhesives.
The sector has been analyzed with the following regions covered: North America, Latin America, Europe, South Asia, East Asia, Oceania, and the Middle East and Africa.
The market is likely to register a CAGR of 2.3% through 2035.
The market is currently valued at USD 85.1 billion in 2025.
The market is likely to grow to a valuation of USD 107.9 billion by 2035.
Asia Pacific is likely to be a leading market during the forecast period.


Our Research Products

The "Full Research Suite" delivers actionable market intel, deep dives on markets or technologies, so clients act faster, cut risk, and unlock growth.

The Leaderboard benchmarks and ranks top vendors, classifying them as Established Leaders, Leading Challengers, or Disruptors & Challengers.

Locates where complements amplify value and substitutes erode it, forecasting net impact by horizon

We deliver granular, decision-grade intel: market sizing, 5-year forecasts, pricing, adoption, usage, revenue, and operational KPIs—plus competitor tracking, regulation, and value chains—across 60 countries broadly.

Spot the shifts before they hit your P&L. We track inflection points, adoption curves, pricing moves, and ecosystem plays to show where demand is heading, why it is changing, and what to do next across high-growth markets and disruptive tech

Real-time reads of user behavior. We track shifting priorities, perceptions of today’s and next-gen services, and provider experience, then pace how fast tech moves from trial to adoption, blending buyer, consumer, and channel inputs with social signals (#WhySwitch, #UX).

Partner with our analyst team to build a custom report designed around your business priorities. From analysing market trends to assessing competitors or crafting bespoke datasets, we tailor insights to your needs.
Supplier Intelligence
Discovery & Profiling
Capacity & Footprint
Performance & Risk
Compliance & Governance
Commercial Readiness
Who Supplies Whom
Scorecards & Shortlists
Playbooks & Docs
Category Intelligence
Definition & Scope
Demand & Use Cases
Cost Drivers
Market Structure
Supply Chain Map
Trade & Policy
Operating Norms
Deliverables
Buyer Intelligence
Account Basics
Spend & Scope
Procurement Model
Vendor Requirements
Terms & Policies
Entry Strategy
Pain Points & Triggers
Outputs
Pricing Analysis
Benchmarks
Trends
Should-Cost
Indexation
Landed Cost
Commercial Terms
Deliverables
Brand Analysis
Positioning & Value Prop
Share & Presence
Customer Evidence
Go-to-Market
Digital & Reputation
Compliance & Trust
KPIs & Gaps
Outputs
Full Research Suite comprises of:
Market outlook & trends analysis
Interviews & case studies
Strategic recommendations
Vendor profiles & capabilities analysis
5-year forecasts
8 regions and 60+ country-level data splits
Market segment data splits
12 months of continuous data updates
DELIVERED AS:
PDF EXCEL ONLINE
Global Packaging Tapes Market Share Analysis – Size, Growth & Forecast 2025–2035
BOPP Packaging Tapes Market Size and Share Forecast Outlook 2025 to 2035
Industry Share & Competitive Positioning in BOPP Packaging Tapes
Paper Packaging Tapes Market Size and Share Forecast Outlook 2025 to 2035
Sealing And Strapping Packaging Tapes Market Size and Share Forecast Outlook 2025 to 2035
Packaging Supply Market Size and Share Forecast Outlook 2025 to 2035
Packaging Testing Services Market Size and Share Forecast Outlook 2025 to 2035
Packaging Tubes Market Size and Share Forecast Outlook 2025 to 2035
Packaging Jar Market Forecast and Outlook 2025 to 2035
Packaging Barrier Film Market Size and Share Forecast Outlook 2025 to 2035
Packaging Films Market Size and Share Forecast Outlook 2025 to 2035
Packaging Laminate Market Size and Share Forecast Outlook 2025 to 2035
Packaging Burst Strength Test Market Size and Share Forecast Outlook 2025 to 2035
Packaging Materials Market Size and Share Forecast Outlook 2025 to 2035
Packaging Labels Market Size and Share Forecast Outlook 2025 to 2035
Packaging Equipment Market Size and Share Forecast Outlook 2025 to 2035
Packaging Resins Market Size and Share Forecast Outlook 2025 to 2035
Packaging Inspection Systems Market Size and Share Forecast Outlook 2025 to 2035
Packaging Design And Simulation Technology Market Size and Share Forecast Outlook 2025 to 2035
Packaging Suction Cups Market Size and Share Forecast Outlook 2025 to 2035

Thank you!
You will receive an email from our Business Development Manager. Please be sure to check your SPAM/JUNK folder too.
Chat With
MaRIA