The global pallet wraps market is valued at USD 2,946 million in 2025 and is set to reach USD 4,821 million by 2035, growing at a CAGR of 5.1%. The market stands at the forefront of a transformative decade that promises to redefine logistics packaging infrastructure and load protection excellence across warehouses, distribution centers, manufacturing facilities, and transportation sectors. The market's journey from USD 2,946 million in 2025 to USD 4,821 million by 2035 represents substantial growth, demonstrating the accelerating adoption of advanced stretch films and sophisticated cargo securing systems across freight operations, supply chain management, industrial packaging, and automated wrapping applications.
The first half of the decade (2025 to 2030) will witness the market climbing from USD 2,946 million to approximately USD 3,782 million, adding USD 836 million in value, which constitutes 45% of the total forecast growth period. This phase will be characterized by the rapid adoption of automated wrapping systems, driven by increasing demand for efficient load securing and enhanced protection requirements worldwide. Superior load containment capabilities and puncture resistance features will become standard expectations rather than premium options.
The latter half (2030 to 2035) will witness sustained growth from USD 3,782 million to USD 4,821 million, representing an addition of USD 1,039 million or 55% of the decade's expansion. This period will be defined by mass market penetration of intelligent wrapping systems, integration with comprehensive warehouse automation platforms, and seamless compatibility with existing material handling infrastructure. The market trajectory signals fundamental shifts in how logistics providers and manufacturers approach protective packaging solutions, with participants positioned to benefit from sustained demand across multiple industrial segments.
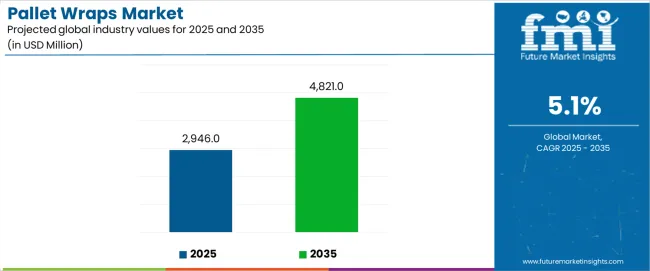
The pallet wraps market demonstrates distinct growth phases with varying market characteristics and competitive dynamics. Between 2025 and 2030, the market progresses through its automation adoption phase, expanding from USD 2,946 million to USD 3,782 million with steady annual increments averaging 5.1% growth. This period showcases the transition from manual wrapping systems to advanced automated equipment with enhanced efficiency and integrated load monitoring becoming mainstream features.
The 2025 to 2030 phase adds USD 836 million to market value, representing 45% of total decade expansion. Market maturation factors include standardization of film specifications, declining equipment costs for automated wrapping systems, and increasing warehouse awareness of pallet wrap benefits reaching 80-85% effectiveness in load protection applications. Competitive landscape evolution during this period features established manufacturers like Berry Global and Sigma Plastics expanding their product portfolios while new entrants focus on bio-based film solutions and enhanced stretch technology.
From 2030 to 2035, market dynamics shift toward intelligent packaging and multi-modal deployment, with growth accelerating from USD 3,782 million to USD 4,821 million, adding USD 1,039 million or 55% of total expansion. This phase transition logic centers on smart wrapping systems, integration with IoT monitoring equipment, and deployment across diverse logistics scenarios, becoming standard rather than specialized packaging solutions. The competitive environment matures with focus shifting from basic protection to comprehensive load security performance and compatibility with high-speed automated operations.
At-a-Glance Metrics
| Metric | Value |
|---|---|
| Market Value (2025) | USD 2,946 million |
| Market Forecast (2035) | USD 4,821 million |
| Growth Rate | 5.10% CAGR |
| Leading Material | LLDPE (Linear Low-Density Polyethylene) |
| Primary Application | Logistics & Transportation |
The market demonstrates strong fundamentals with LLDPE films capturing a dominant share through superior stretch properties and excellent puncture resistance capabilities. Logistics and transportation applications drive primary demand, supported by increasing e-commerce fulfillment requirements and efficient load securing solutions. Geographic expansion remains concentrated in manufacturing hubs with established distribution infrastructure, while emerging economies show accelerating adoption rates driven by warehouse modernization projects and rising industrial packaging activity.
The pallet wraps market represents a compelling intersection of logistics optimization, load protection, and automated packaging management. With robust growth projected from USD 2,946 million in 2025 to USD 4,821 million by 2035 at a 5.10% CAGR, this market is driven by increasing warehouse automation trends, e-commerce expansion requirements, and commercial demand for high-performance protective packaging formats.
The market's expansion reflects a fundamental shift in how logistics providers and manufacturers approach load security infrastructure. Strong growth opportunities exist across diverse applications, from distribution centers requiring efficient wrapping systems to manufacturing facilities demanding protection solutions. Geographic expansion is particularly pronounced in Asia-Pacific markets, led by India (6.8% CAGR) and China (6.4% CAGR), while established markets in North America and Europe drive innovation and specialized segment development.
The dominance of LLDPE materials and logistics applications underscores the importance of proven stretching technology and load containment in driving adoption. Film thickness and wrapping complexity remain key challenges, creating opportunities for companies that can deliver reliable performance while maintaining operational efficiency.
Market expansion rests on three fundamental shifts driving adoption across logistics and industrial packaging sectors. E-commerce growth creates compelling advantages through pallet wrapping systems that provide comprehensive load protection with enhanced efficiency, enabling distribution centers to secure diverse cargo types and maintain product integrity while justifying automation investments over manual wrapping methods. Supply chain optimization accelerates as logistics providers worldwide seek efficient load securing solutions that deliver reliable cargo protection directly to transportation environments, enabling damage reduction that aligns with cost management expectations and maximizes delivery success rates. Warehouse automation drives adoption from distribution facilities requiring integrated wrapping solutions that maximize throughput per operation while maintaining protection standards during storage and transport operations.
However, growth faces headwinds from film waste considerations that differ across facility operations regarding material consumption and disposal protocols, potentially limiting performance efficiency in environmentally-conscious packaging categories. Equipment maintenance requirements also persist regarding wrapping machine calibration and film tensioning procedures that may increase operational complexity in markets with demanding uptime standards.
Primary Classification: The market segments by material into LLDPE (Linear Low-Density Polyethylene), LDPE (Low-Density Polyethylene), PVC, and others categories, representing the evolution from basic films to advanced stretch formats for comprehensive load protection operations.
Secondary Breakdown: Application segmentation divides the market into logistics & transportation, food & beverage, pharmaceutical, automotive, building & construction, and others sectors, reflecting distinct requirements for strength, barrier properties, and regulatory performance.
Regional Classification: Geographic distribution covers Asia Pacific, North America, Europe, Latin America, and the Middle East & Africa, with manufacturing hubs leading adoption while emerging economies show accelerating growth patterns driven by industrial development programs.
The segmentation structure reveals technology progression from standard polyethylene films toward integrated protection platforms with enhanced stretch characteristics and load containment capabilities, while application diversity spans from warehouse operations to specialized industrial packaging requiring comprehensive securing solutions and automated application systems.
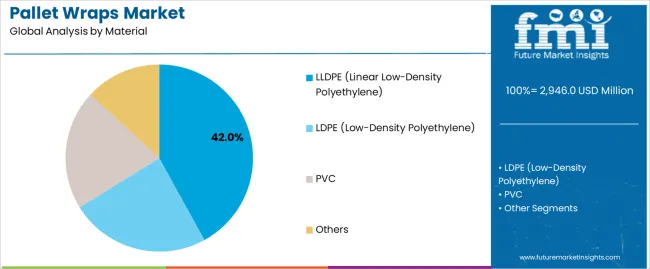
LLDPE segment is estimated to account for 42% of the pallet wraps market share in 2025. The segment's leading position stems from its fundamental role as a critical component in stretch wrapping applications and its extensive use across multiple logistics and industrial packaging sectors. LLDPE's dominance is attributed to its superior stretch properties, including excellent elongation characteristics, outstanding puncture resistance, and balanced cost-effectiveness that make it indispensable for high-volume wrapping operations.
Market Position: LLDPE systems command the leading position in the pallet wraps market through advanced polymer technologies, including comprehensive molecular structure control, uniform thickness distribution, and reliable stretch performance that enable facilities to deploy films across diverse cargo applications.
Value Drivers: The segment benefits from manufacturing scalability advantages that provide exceptional load containment without requiring specialized application equipment. Efficient processing capabilities enable deployment in warehouse operations, transportation services, and industrial applications where cost effectiveness and reliable protection represent critical selection requirements.
Competitive Advantages: LLDPE systems differentiate through excellent stretch characteristics, proven durability performance, and compatibility with standard wrapping equipment that enhance cargo security while maintaining economical film profiles suitable for diverse packaging applications.
Key market characteristics:
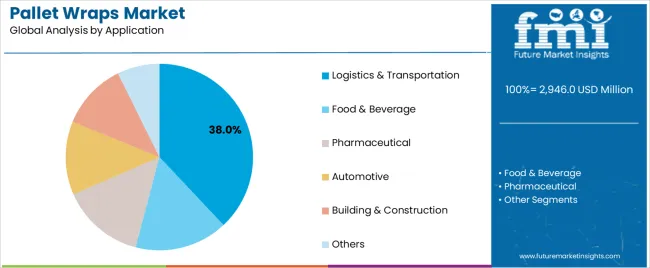
Logistics & transportation segment is projected to hold 38% of the pallet wraps market share in 2025. The segment's market leadership is driven by the extensive use of pallet wraps in distribution centers, freight operations, shipping facilities, and cargo handling, where films serve as both protection systems and load securing tools. The logistics industry's consistent investment in operational efficiency supports the segment's dominant position.
Market Context: Logistics and transportation applications dominate the market due to widespread adoption of automated wrapping systems and increasing focus on cargo security, damage prevention, and operational efficiency that extend supply chain value while maintaining load integrity.
Appeal Factors: Logistics operators prioritize load containment strength, film clarity for scanning, and integration with existing wrapping equipment that enable coordinated deployment across multiple facility points. The segment benefits from substantial e-commerce growth and operational standards that emphasize efficient cargo protection for multi-modal transportation.
Growth Drivers: Warehouse automation programs incorporate pallet wraps as standard protection tools for goods-in-transit services. At the same time, distribution center initiatives are increasing demand for high-performance films that comply with carrier requirements and enhance cargo stability programs.
Market Challenges: Equipment compatibility variations and film specification requirements may limit deployment flexibility in ultra-high-speed operations or extreme cost-sensitive scenarios.
Application dynamics include:
Growth Accelerators: E-commerce expansion drives primary adoption as pallet wrapping systems provide exceptional load securing that enables cargo protection without compromising handling efficiency, supporting distribution center productivity enhancement and customer satisfaction that require reliable packaging formats. Warehouse automation accelerates market growth as operators seek integrated wrapping solutions that maintain load stability during transport while enhancing throughput capacity through refined application systems. Supply chain optimization increases worldwide, creating sustained demand for efficient packaging systems that complement logistics efficiency and provide competitive advantages in damage reduction.
Growth Inhibitors: Film waste challenges differ across facility operations regarding material consumption and disposal efficiency, which may limit market penetration and cost effectiveness in environmentally-conscious categories with demanding waste reduction requirements. Equipment maintenance requirements persist regarding machine calibration and film tensioning procedures that may increase operational costs in high-uptime applications with strict performance specifications. Market fragmentation across multiple film grades and thickness options creates compatibility concerns between different wrapping equipment and existing facility infrastructure.
Market Evolution Patterns: Adoption accelerates in logistics and industrial packaging sectors where load protection justifies film investments, with geographic concentration in manufacturing regions transitioning toward mainstream adoption in emerging economies driven by warehouse development and industrial packaging expansion. Technology development focuses on enhanced stretch ratios, improved puncture resistance, and integration with automated wrapping systems that optimize load security and operational efficiency. The market could face disruption if alternative packaging technologies or securing innovations significantly challenge pallet wrap advantages in cargo protection applications.
The pallet wraps market demonstrates varied regional dynamics with Growth Leaders including India (6.8% CAGR) and China (6.4% CAGR) driving expansion through industrial development and logistics modernization adoption. Steady Performers encompass the USA (5.9% CAGR), Germany (4.7% CAGR), and Brazil (5.3% CAGR), benefiting from established manufacturing sectors and automated packaging adoption.
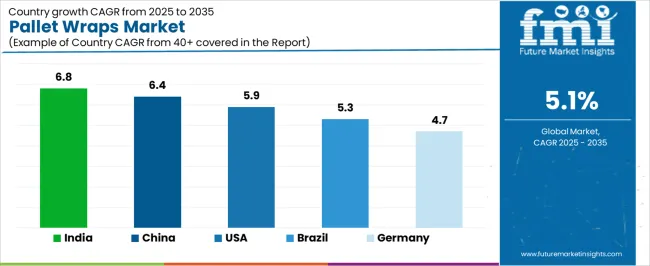
| Country | CAGR (2025 to 2035) |
|---|---|
| India | 6.8% |
| China | 6.4% |
| USA | 5.9% |
| Brazil | 5.3% |
| Germany | 4.7% |
Regional synthesis reveals Asia-Pacific markets leading growth through industrial expansion and logistics infrastructure development, while European countries maintain steady expansion supported by manufacturing heritage and automated packaging requirements. North American markets show strong growth driven by e-commerce proliferation and warehouse automation applications.
India establishes regional leadership through explosive manufacturing expansion and comprehensive logistics infrastructure modernization, integrating advanced pallet wrapping systems as standard components in warehouse operations and industrial packaging applications. The country's 6.8% CAGR through 2035 reflects industrial growth acceleration promoting efficient packaging adoption and domestic manufacturing activity that mandate the use of protective films in distribution operations. Growth concentrates in major industrial centers, including Mumbai, Chennai, and Bangalore, where manufacturing facilities showcase integrated wrapping systems that appeal to cost-conscious operators seeking reliable protection and international logistics standards.
Indian manufacturers are developing cost-effective pallet wrap solutions that combine local production advantages with international performance specifications, including enhanced stretch ratios and advanced puncture resistance capabilities.
Strategic Market Indicators:
The Chinese market emphasizes industrial applications, including comprehensive manufacturing expansion and logistics modernization that increasingly incorporates pallet wraps for cargo protection and automated packaging applications. The country is projected to show a 6.4% CAGR through 2035, driven by massive industrial activity under infrastructure development initiatives and commercial demand for efficient, high-quality protection systems. Chinese manufacturers prioritize production efficiency with pallet wraps delivering reliable load protection through economical film usage and efficient application capabilities.
Technology deployment channels include major logistics companies, manufacturing facilities, and packaging equipment suppliers that support high-volume usage for domestic and export applications.
Performance Metrics:
The USA market emphasizes advanced wrapping features, including innovative automation technologies and integration with comprehensive warehouse platforms that manage load protection, operational efficiency, and quality control applications through unified packaging systems. The country is projected to show a 5.9% CAGR through 2035, driven by e-commerce expansion under digital commerce trends and commercial demand for premium, reliable protection systems. American facilities prioritize operational efficiency with pallet wraps delivering comprehensive load security through refined application and damage prevention.
Technology deployment channels include major logistics providers, packaging equipment manufacturers, and specialty film suppliers that support custom development for automated operations.
Performance Metrics:
In São Paulo, Rio de Janeiro, and Belo Horizonte, Brazilian manufacturers and logistics providers are implementing advanced pallet wrapping systems to enhance distribution capabilities and support industrial packaging development that aligns with manufacturing protocols and export standards. The Brazilian market demonstrates strong growth with a 5.3% CAGR through 2035, driven by manufacturing expansion programs and logistics investments that emphasize efficient packaging systems for domestic and export applications. Brazilian facilities are prioritizing pallet wrapping systems that provide reliable protection quality while maintaining compliance with international shipping standards and minimizing cargo damage, particularly important in agricultural export operations and manufacturing facilities.
Market expansion benefits from industrial development programs that mandate enhanced protection in packaging specifications, creating sustained demand across Brazil's manufacturing and logistics sectors, where load integrity and system reliability represent critical requirements.
Strategic Market Indicators:
Germany's sophisticated manufacturing market demonstrates precise pallet wrap deployment, growing at 4.7% CAGR, with documented operational excellence in load protection and logistics distribution applications through integration with existing packaging systems and quality assurance infrastructure. The country leverages engineering expertise in film manufacturing and application precision to maintain market leadership. Industrial centers, including Bavaria, North Rhine-Westphalia, and Baden-Württemberg, showcase advanced installations where pallet wrapping systems integrate with comprehensive automation platforms and protection systems to optimize cargo security and operational efficiency.
German manufacturers prioritize application precision and film consistency in product development, creating demand for premium pallet wrapping systems with advanced features, including ultra-reliable stretch properties and integration with automated packaging protocols. The market benefits from established manufacturing infrastructure and willingness to invest in specialized protection technologies that provide superior load containment and regulatory compliance.
Market Intelligence Brief:
The pallet wraps market in Europe is projected to grow from USD 789 million in 2025 to USD 1,142 million by 2035, registering a CAGR of 3.8% over the forecast period. Germany is expected to maintain its leadership position with a 31.4% market share in 2025, declining slightly to 30.9% by 2035, supported by its manufacturing excellence and major industrial centers, including Bavaria and North Rhine-Westphalia.
France follows with a 19.6% share in 2025, projected to reach 20.1% by 2035, driven by comprehensive logistics infrastructure and manufacturing sector adoption. United Kingdom holds a 16.2% share in 2025, expected to maintain 16.5% by 2035 through established distribution networks and automated packaging adoption.
Italy commands a 14.1% share, while Spain accounts for 9.3% in 2025. The Rest of Europe region is anticipated to gain momentum, expanding its collective share from 9.4% to 9.8% by 2035, attributed to increasing industrial development in Eastern European countries and emerging Nordic manufacturing brands implementing advanced packaging programs.
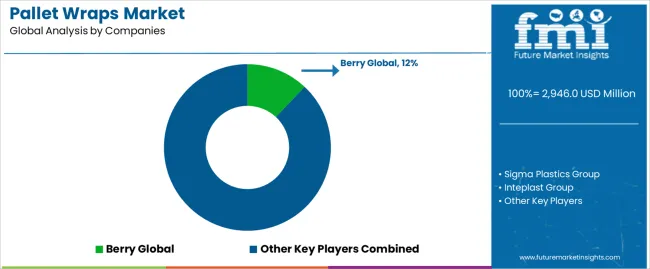
The pallet wraps market operates with moderate concentration, featuring approximately 22-28 participants, where leading companies control roughly 38-44% of the global market share through established distribution networks and comprehensive film manufacturing capabilities. Competition emphasizes protection performance, stretch characteristics, and equipment compatibility rather than price-based rivalry.
Market leaders encompass Berry Global, Sigma Plastics Group, and Inteplast Group, which maintain competitive advantages through extensive polymer processing expertise, global distribution networks, and comprehensive technical support capabilities that create customer loyalty and support packaging requirements. These companies leverage decades of film manufacturing experience and ongoing stretch technology investments to develop advanced pallet wrapping systems with exceptional load containment and puncture resistance features. Berry Global leads with 12% share.
Specialty challengers include AEP Industries, Coveris, and Paragon Films, which compete through specialized packaging innovation focus and efficient protection solutions that appeal to logistics providers seeking premium securing formats and application flexibility. These companies differentiate through material engineering emphasis and specialized industrial application focus.
Market dynamics favor participants that combine reliable protection performance with advanced application support, including stretch optimization and equipment integration. Competitive pressure intensifies as traditional plastic film manufacturers expand into pallet wrapping systems. At the same time, specialized packaging equipment suppliers challenge established players through innovative stretch technologies and cost-effective production targeting emerging logistics segments.
| Item | Value |
|---|---|
| Quantitative Units | USD 2,946 million |
| Material | LLDPE, LDPE, PVC, Others |
| Application | Logistics & Transportation, Food & Beverage, Pharmaceutical, Automotive, Building & Construction, Others |
| Regions Covered | Asia Pacific, North America, Europe, Latin America, Middle East & Africa |
| Countries Covered | U.S., Germany, Japan, China, India, Brazil, and 25+ additional countries |
| Key Companies Profiled | Berry Global, Sigma Plastics Group, Inteplast Group, AEP Industries, Coveris, Paragon Films |
| Additional Attributes | Dollar sales by material and application categories, regional adoption trends across Asia Pacific, North America, and Europe, competitive landscape with film manufacturers and packaging equipment suppliers, logistics preferences for protection quality and application compatibility, integration with wrapping equipment and automation systems, innovations in stretch technology and puncture resistance, and development of specialized protection solutions with enhanced load containment capabilities and user-friendly features |
The global pallet wraps market is estimated to be valued at USD 2,946.0 million in 2025.
The market size for the pallet wraps market is projected to reach USD 4,821.0 million by 2035.
The pallet wraps market is expected to grow at a 5.1% CAGR between 2025 and 2035.
The key product types in pallet wraps market are lldpe (linear low-density polyethylene), ldpe (low-density polyethylene), pvc and others.
In terms of application, logistics & transportation segment to command 38.0% share in the pallet wraps market in 2025.


Our Research Products

The "Full Research Suite" delivers actionable market intel, deep dives on markets or technologies, so clients act faster, cut risk, and unlock growth.

The Leaderboard benchmarks and ranks top vendors, classifying them as Established Leaders, Leading Challengers, or Disruptors & Challengers.

Locates where complements amplify value and substitutes erode it, forecasting net impact by horizon

We deliver granular, decision-grade intel: market sizing, 5-year forecasts, pricing, adoption, usage, revenue, and operational KPIs—plus competitor tracking, regulation, and value chains—across 60 countries broadly.

Spot the shifts before they hit your P&L. We track inflection points, adoption curves, pricing moves, and ecosystem plays to show where demand is heading, why it is changing, and what to do next across high-growth markets and disruptive tech

Real-time reads of user behavior. We track shifting priorities, perceptions of today’s and next-gen services, and provider experience, then pace how fast tech moves from trial to adoption, blending buyer, consumer, and channel inputs with social signals (#WhySwitch, #UX).

Partner with our analyst team to build a custom report designed around your business priorities. From analysing market trends to assessing competitors or crafting bespoke datasets, we tailor insights to your needs.
Supplier Intelligence
Discovery & Profiling
Capacity & Footprint
Performance & Risk
Compliance & Governance
Commercial Readiness
Who Supplies Whom
Scorecards & Shortlists
Playbooks & Docs
Category Intelligence
Definition & Scope
Demand & Use Cases
Cost Drivers
Market Structure
Supply Chain Map
Trade & Policy
Operating Norms
Deliverables
Buyer Intelligence
Account Basics
Spend & Scope
Procurement Model
Vendor Requirements
Terms & Policies
Entry Strategy
Pain Points & Triggers
Outputs
Pricing Analysis
Benchmarks
Trends
Should-Cost
Indexation
Landed Cost
Commercial Terms
Deliverables
Brand Analysis
Positioning & Value Prop
Share & Presence
Customer Evidence
Go-to-Market
Digital & Reputation
Compliance & Trust
KPIs & Gaps
Outputs
Full Research Suite comprises of:
Market outlook & trends analysis
Interviews & case studies
Strategic recommendations
Vendor profiles & capabilities analysis
5-year forecasts
8 regions and 60+ country-level data splits
Market segment data splits
12 months of continuous data updates
DELIVERED AS:
PDF EXCEL ONLINE
Market Share Breakdown of Pallet Wraps Manufacturers
Australia Pallet Wraps Market Size and Share Forecast Outlook 2025 to 2035
Palletizer Market Size and Share Forecast Outlook 2025 to 2035
Pallet Displays Market Size and Share Forecast Outlook 2025 to 2035
Pallet Pooling Market Forecast and Outlook 2025 to 2035
Palletizing Robot Industry Analysis in North America Size and Share Forecast Outlook 2025 to 2035
Palletizing Robots Market Size and Share Forecast Outlook 2025 to 2035
Pallet Stretch Wrapping Machine Market Size and Share Forecast Outlook 2025 to 2035
Pallet Box Market Size and Share Forecast Outlook 2025 to 2035
Pallet Labelling System Market Size and Share Forecast Outlook 2025 to 2035
Pallet Labeler Market Size and Share Forecast Outlook 2025 to 2035
Pallet Wrap Industry Analysis in Western Europe Size and Share Forecast Outlook 2025 to 2035
Pallet Jacks Market Size and Share Forecast Outlook 2025 to 2035
Pallet Drum Filler Capper Market Size and Share Forecast Outlook 2025 to 2035
Pallets Market Analysis - Size, Share, and Forecast 2025 to 2035
Pallet Packaging Market Size and Share Forecast Outlook 2025 to 2035
Pallet Shippers Market Size and Share Forecast Outlook 2025 to 2035
Pallet Racking Market Analysis - Size, Share, & Forecast Outlook 2025 to 2035
Pallet Banding Machine Market Analysis - Growth & Forecast 2025 to 2035
Palletizing Machines Market Growth & Demand 2025 to 2035

Thank you!
You will receive an email from our Business Development Manager. Please be sure to check your SPAM/JUNK folder too.
Chat With
MaRIA